Quebec Airbnb Market Analysis 2026: Short Term Rental Data & Vacation Rental Statistics in Quebec, Canada
Is Airbnb profitable in Quebec in 2026? Explore comprehensive Airbnb analytics for Quebec, Quebec, Canada to uncover income potential. This 2026 STR market report for Quebec, based on AirROI data from February 2025 to January 2026, reveals key trends in the bustling market of 1,822 active listings.
Whether you're considering an Airbnb investment in Quebec, optimizing your existing vacation rental, or exploring rental arbitrage opportunities, understanding the Quebec Airbnb data is crucial. Navigating the high regulation landscape is key to maximizing your short term rental income potential. Let's dive into the specifics.
Key Quebec Airbnb Performance Metrics Overview
Monthly Airbnb Revenue Variations & Income Potential in Quebec (2026)
Understanding the monthly revenue variations for Airbnb listings in Quebec is key to maximizing your short term rental income potential. Seasonality significantly impacts earnings. Our analysis, based on data from the past 12 months, shows that the peak revenue month for STRs in Quebec is typically August, while January often presents the lowest earnings, highlighting opportunities for strategic pricing adjustments during shoulder and low seasons. Explore the typical Airbnb income in Quebec across different performance tiers:
- Best-in-class properties (Top 10%) achieve $5,527+ monthly, often utilizing dynamic pricing and superior guest experiences.
- Strong performing properties (Top 25%) earn $3,643 or more, indicating effective management and desirable locations/amenities.
- Typical properties (Median) generate around $2,226 per month, representing the average market performance.
- Entry-level properties (Bottom 25%) see earnings around $1,116, often with potential for optimization.
Average Monthly Airbnb Earnings Trend in Quebec
Quebec Airbnb Occupancy Rate Trends (2026)
Maximize your bookings by understanding the Quebec STR occupancy trends. Seasonal demand shifts significantly influence how often properties are booked. Typically, Augustsees the highest demand (peak season occupancy), while January experiences the lowest (low season). Effective strategies, like adjusting minimum stays or offering promotions, can boost occupancy during slower periods. Here's how different property tiers perform in Quebec:
- Best-in-class properties (Top 10%) achieve 86%+ occupancy, indicating high desirability and potentially optimized availability.
- Strong performing properties (Top 25%) maintain 74% or higher occupancy, suggesting good market fit and guest satisfaction.
- Typical properties (Median) have an occupancy rate around 54%.
- Entry-level properties (Bottom 25%) average 30% occupancy, potentially facing higher vacancy.
Average Monthly Occupancy Rate Trend in Quebec
Average Daily Rate (ADR) Airbnb Trends in Quebec (2026)
Effective short term rental pricing strategy in Quebec involves understanding monthly ADR fluctuations. The Average Daily Rate (ADR) for Airbnb in Quebec typically peaks in July and dips lowest during April. Leveraging Airbnb dynamic pricing tools or strategies based on this seasonality can significantly boost revenue. Here's a look at the typical nightly rates achieved:
- Best-in-class properties (Top 10%) command rates of $282+ per night, often due to premium features or locations.
- Strong performing properties (Top 25%) achieve nightly rates of $192 or more.
- Typical properties (Median) charge around $128 per night.
- Entry-level properties (Bottom 25%) earn around $73 per night.
Average Daily Rate (ADR) Trend by Month in Quebec
Get Live Quebec Market Intelligence 👇
Explore Real-time Analytics
Airbnb Seasonality Analysis & Trends in Quebec (2026)
Peak Season (August, July, September)
- Revenue averages $4,111 per month
- Occupancy rates average 63.1%
- Daily rates average $180
Shoulder Season
- Revenue averages $2,744 per month
- Occupancy maintains around 52.1%
- Daily rates hold near $151
Low Season (January, March, April)
- Revenue drops to average $1,667 per month
- Occupancy decreases to average 39.5%
- Daily rates adjust to average $134
Seasonality Insights for Quebec
- The Airbnb seasonality in Quebec shows highly seasonal trends requiring careful strategy. While the sections above show seasonal averages, it's also insightful to look at the extremes:
- During the high season, the absolute peak month showcases Quebec's highest earning potential, with monthly revenues capable of climbing to $4,492, occupancy reaching a high of 66.5%, and ADRs peaking at $184.
- Conversely, the slowest single month of the year, typically falling within the low season, marks the market's lowest point. In this month, revenue might dip to $1,539, occupancy could drop to 31.2%, and ADRs may adjust down to $130.
- Understanding both the seasonal averages and these monthly peaks and troughs in revenue, occupancy, and ADR is crucial for maximizing your Airbnb profit potential in Quebec.
Seasonal Strategies for Maximizing Profit
- Peak Season: Maximize revenue through premium pricing and potentially longer minimum stays. Ensure high availability.
- Low Season: Offer competitive pricing, special promotions (e.g., extended stay discounts), and flexible cancellation policies. Target off-season travelers like remote workers or budget-conscious guests.
- Shoulder Seasons: Implement dynamic pricing that balances peak and low rates. Target weekend travelers or specific events. Offer slightly more flexible terms than peak season.
- Regularly analyze your own performance against these Quebec seasonality benchmarks and adjust your pricing and availability strategy accordingly.
Best Areas for Airbnb Investment in Quebec (2026)
Exploring the top neighborhoods for short-term rentals in Quebec? This section highlights key areas, outlining why they are attractive for hosts and guests, along with notable local attractions. Consider these locations based on your target guest profile and investment strategy.
| Neighborhood / Area | Why Host Here? (Target Guests & Appeal) | Key Attractions & Landmarks |
|---|---|---|
| Old Quebec | A UNESCO World Heritage site, Old Quebec is famous for its historic architecture, cobblestone streets, and vibrant cultural scene. It draws tourists who want to experience its rich history and charm. | Château Frontenac, Old Port, Plains of Abraham, Notre-Dame de Québec Basilica-Cathedral, Montmorency Falls |
| La Cité-Limoilou | Known for its lively neighborhoods and proximity to downtown Quebec City, this area offers a mix of culture, dining, and entertainment. It's perfect for travelers seeking a more local experience. | Traverse Quebec-Limoilou, Les Galeries de la Capitale, Parc de la Francophonie, Quebec City Convention Centre, Street art scene |
| Saint-Roch | A trendy and revitalized neighborhood that combines historic buildings with modern amenities. It is popular among young people, artists, and tech enthusiasts. | Le Palais Montcalm, Limoilou District, Rue du Petit-Champlain, Shops and cafés, Cultural events |
| Montcalm | An upscale neighborhood known for its theaters, art galleries, and green spaces. It attracts art lovers and those looking for a sophisticated Quebec experience. | Plains of Abraham, Grande Allée, Musée national des beaux-arts du Québec, Parc des Champs-de-Bataille, Château Frontenac |
| Sillery | A picturesque residential area offering beautiful parks and waterfront views. It's popular with families and those looking for a quieter stay while still being close to downtown. | Parc du Bois-de-Coulogne, Côte de la rivière Saint-Charles, Plage Jacques-Cartier, Cascades de la rivière Montmorency, Universities |
| Beauport | A charming area close to nature and outdoor activities, perfect for travelers looking to explore the natural beauty of Quebec, including nearby parks and historical sites. | Montmorency Falls, Jardins de Métis, Parc de la Jacques-Cartier, Historical sites, Outdoor activities |
| Limoilou | An up-and-coming neighborhood popular with young professionals, known for its local shops and community vibe. Offers a mix of urban and suburban living. | Limoilou Market, Local cafes, Green parks, Community events, Cultural festivals |
| Saint-Jean-Baptiste | A vibrant neighborhood with a diverse community, cafes, and shops. Its central location makes it a great spot for exploring all that Quebec City has to offer. | Château Frontenac, Parc de l'Artillerie, Food markets, Local theaters, Street performances |
Understanding Airbnb License Requirements & STR Laws in Quebec (2026)
Yes, Quebec, Quebec, Canada enforces high STR regulations. Obtaining a license and ensuring compliance is almost certainly required according to current 2026 STR laws. Always verify the latest short term rental regulations and Airbnb license requirements directly with local government authorities for Quebec to ensure full compliance before hosting.
(Source: AirROI data, 2026, based on 79% licensed listings)
Top Performing Airbnb Properties in Quebec (2026)
Benchmark your potential! Explore examples of top-performing Airbnb properties in Quebecbased on Trailing Twelve Month (TTM) revenue. Analyze their characteristics, revenue, occupancy rate, and ADR to understand what drives success in this market.

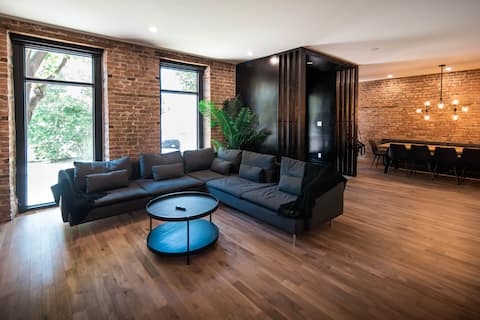
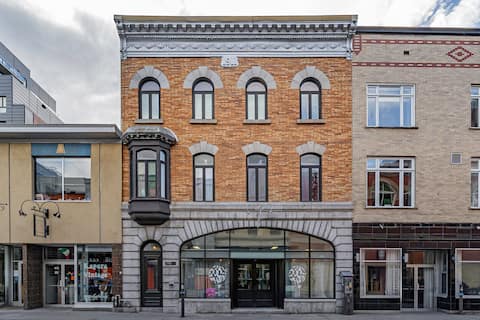
Château Saint-Ursule | In the heart of Old Quebec
Entire Place • 3 bedrooms
Château Deluxe // Vieux-Québec, Énorme Maison
Entire Place • 7 bedrooms

Deluxe Estate - Two in One Downtown Québec City
Entire Place • 5 bedrooms

Old Quebec exceptional B&B for 10 people
Entire Place • 4 bedrooms
Deluxe Penthouse / / 2 in 1 Vieux-Québec
Entire Place • 7 bedrooms

Gorgeous 3 Bedroom 2-floor Old Quebec Townhouse
Entire Place • 3 bedrooms
Note: Performance varies based on location, size, amenities, seasonality, and management quality. Data reflects the past 12 months.
Top Performing Airbnb Hosts in Quebec (2026)
Learn from the best! This table showcases top-performing Airbnb hosts in Quebec based on the number of properties managed and estimated total revenue over the past year. Analyze their scale and performance metrics.
| Host Name | Properties | Grossing Revenue | Stay Reviews | Avg Rating |
|---|---|---|---|---|
| Reception From Lofts Vieux-Qué | 74 | $1,913,015 | 1687 | 4.66/5.0 |
| North-House | 18 | $1,321,374 | 1512 | 4.80/5.0 |
| Louis & Dan | 44 | $1,320,669 | 6486 | 4.80/5.0 |
| Les Immeubles Charlevoix Court | 47 | $1,295,522 | 2058 | 4.72/5.0 |
| Deluxe Appartements | 11 | $1,262,645 | 1549 | 4.94/5.0 |
| Grégoire | 7 | $778,638 | 161 | 4.99/5.0 |
| Barricade | 19 | $739,387 | 271 | 4.80/5.0 |
| Caroline | 16 | $720,725 | 2568 | 4.77/5.0 |
| 77 St-Vallier | 27 | $673,342 | 4336 | 4.82/5.0 |
| Michel | 9 | $581,281 | 949 | 4.92/5.0 |
Analyzing the strategies of top hosts, such as their property selection, pricing, and guest communication, can offer valuable lessons for optimizing your own Airbnb operations in Quebec.
Dive Deeper: Advanced Quebec STR Market Data (2026)
Ready to unlock more insights? AirROI provides access to advanced metrics and comprehensive Airbnb data for Quebec. Explore detailed analytics beyond this report to refine your investment strategy, optimize pricing, and maximize your vacation rental profits.
Explore Advanced MetricsQuebec Short-Term Rental Market Composition (2026): Property & Room Types
Room Type Distribution
Property Type Distribution
Market Composition Insights for Quebec
- The Quebec Airbnb market composition is heavily skewed towards Entire Home/Apt listings, which make up 86.9% of the 1,822 active rentals. This indicates strong guest preference for privacy and space.
- Looking at the property type distribution in Quebec, Apartment/Condo properties are the most common (79.6%), reflecting the local real estate landscape.
- The presence of 5.7% Hotel/Boutique listings indicates integration with traditional hospitality.
- Smaller segments like others, outdoor/unique, unique stays (combined 1.0%) offer potential for unique stay experiences.
Quebec Airbnb Room Capacity Analysis (2026): Bedroom Distribution
Distribution of Listings by Number of Bedrooms
Room Capacity Insights for Quebec
- The dominant room capacity in Quebec is 1 bedroom listings, making up 41.7% of the market. This suggests a strong demand for properties suitable for couples or solo travelers.
- Together, 1 bedroom and 2 bedrooms properties represent 70.6% of the active Airbnb listings in Quebec, indicating a high concentration in these sizes.
Quebec Vacation Rental Guest Capacity Trends (2026)
Distribution of Listings by Guest Capacity
Guest Capacity Insights for Quebec
- The most common guest capacity trend in Quebec vacation rentals is listings accommodating 4 guests (34.8%). This suggests the primary traveler segment is likely small families or groups.
- Properties designed for 4 guests and 2 guests dominate the Quebec STR market, accounting for 60.2% of listings.
- 23.9% of properties accommodate 6+ guests, serving the market segment for larger families or group travel in Quebec.
- On average, properties in Quebec are equipped to host 3.8 guests.
Quebec Airbnb Booking Patterns (2026): Available vs. Booked Days
Available Days Distribution
Booked Days Distribution
Booking Pattern Insights for Quebec
- The most common availability pattern in Quebec falls within the 181-270 days range, representing 31.2% of listings. This suggests many properties have significant open periods on their calendars.
- Approximately 61.4% of listings show high availability (181+ days open annually), indicating potential for increased bookings or specific owner usage patterns.
- For booked days, the 91-180 days range is most frequent in Quebec (31.2%), reflecting common guest stay durations or potential owner blocking patterns.
- A notable 39.9% of properties secure long booking periods (181+ days booked per year), highlighting successful long-term rental strategies or significant owner usage.
Quebec Airbnb Minimum Stay Requirements Analysis
Distribution of Listings by Minimum Night Requirement
1 Night
330 listings
18.1% of total
2 Nights
186 listings
10.2% of total
3 Nights
17 listings
0.9% of total
4-6 Nights
85 listings
4.7% of total
7-29 Nights
143 listings
7.8% of total
30+ Nights
1061 listings
58.2% of total
Key Insights
- The most prevalent minimum stay requirement in Quebec is 30+ Nights, adopted by 58.2% of listings. This highlights the market's preference for longer commitments.
- A significant segment (58.2%) caters to monthly stays (30+ nights) in Quebec, pointing to opportunities in the extended-stay market.
Recommendations
- Align with the market by considering a 30+ Nights minimum stay, as 58.2% of Quebec hosts use this setting.
- If feasible, allowing 1-night stays, especially midweek or during low season, could capture last-minute bookings, as only 18.1% currently do.
- Explore offering discounts for stays of 30+ nights to attract the 58.2% of the market seeking extended stays.
- Adjust minimum nights based on seasonality – potentially shorter during low season and longer during peak demand periods in Quebec.
Quebec Airbnb Cancellation Policy Trends Analysis (2026)
Limited
81 listings
4.5% of total
Super Strict 60 Days
1 listings
0.1% of total
Super Strict 30 Days
22 listings
1.2% of total
Flexible
294 listings
16.2% of total
Moderate
694 listings
38.2% of total
Firm
561 listings
30.8% of total
Strict
166 listings
9.1% of total
Cancellation Policy Insights for Quebec
- The prevailing Airbnb cancellation policy trend in Quebec is Moderate, used by 38.2% of listings.
- There's a relatively balanced mix between guest-friendly (54.4%) and stricter (39.9%) policies, offering choices for different guest needs.
- Strict cancellation policies are quite rare (9.1%), potentially making listings with this policy less competitive unless justified by high demand or property type.
Recommendations for Hosts
- Consider adopting a Moderate policy to align with the 38.2% market standard in Quebec.
- Using a Strict policy might deter some guests, as only 9.1% of listings use it. Evaluate if potential revenue protection outweighs possible lower booking rates.
- Regularly review your cancellation policy against competitors and market demand shifts in Quebec.
Quebec STR Booking Lead Time Analysis (2026)
Average Booking Lead Time by Month
Booking Lead Time Insights for Quebec
- The overall average booking lead time for vacation rentals in Quebec is 53 days.
- Guests book furthest in advance for stays during August (average 70 days), likely coinciding with peak travel demand or local events.
- The shortest booking windows occur for stays in March (average 30 days), indicating more last-minute travel plans during this time.
- Seasonally, Summer (64 days avg.) sees the longest lead times, while Spring (40 days avg.) has the shortest, reflecting typical travel planning cycles.
Recommendations for Hosts
- Use the overall average lead time (53 days) as a baseline for your pricing and availability strategy in Quebec.
- For August stays, consider implementing length-of-stay discounts or slightly higher rates for bookings made less than 70 days out to capitalize on advance planning.
- Target marketing efforts for the Summer season well in advance (at least 64 days) to capture early planners.
- Monitor your own booking lead times against these Quebec averages to identify opportunities for dynamic pricing adjustments.
Popular & Essential Airbnb Amenities in Quebec (2026)
Amenity Prevalence
Amenity Insights for Quebec
- Essential amenities in Quebec that guests expect include: Wifi, Smoke alarm, Heating. Lacking these (any) could significantly impact bookings.
- Popular amenities like TV, Hot water, Coffee maker are common but not universal. Offering these can provide a competitive edge.
Recommendations for Hosts
- Ensure your listing includes all essential amenities for Quebec: Wifi, Smoke alarm, Heating.
- Prioritize adding missing essentials: Wifi, Smoke alarm, Heating.
- Consider adding popular differentiators like TV or Hot water to increase appeal.
- Highlight unique or less common amenities you offer (e.g., hot tub, dedicated workspace, EV charger) in your listing description and photos.
- Regularly check competitor amenities in Quebec to stay competitive.
Quebec Airbnb Guest Demographics & Profile Analysis (2026)
Guest Profile Summary for Quebec
- The typical guest profile for Airbnb in Quebec consists of a mix of domestic (45%) and international guests, with top international origins including United States, typically belonging to the Post-2000s (Gen Z/Alpha) group (50%), primarily speaking English or French.
- Domestic travelers account for 45.4% of guests.
- Key international markets include Canada (45.4%) and United States (32%).
- Top languages spoken are English (49.1%) followed by French (24.6%).
- A significant demographic segment is the Post-2000s (Gen Z/Alpha) group, representing 50% of guests.
Recommendations for Hosts
- Balance marketing efforts between domestic and international channels based on the guest mix.
- Tailor amenities and listing descriptions to appeal to the dominant Post-2000s (Gen Z/Alpha) demographic (e.g., highlight fast WiFi, smart home features, local guides).
- Highlight unique local experiences or amenities relevant to the primary guest profile.
- Consider seasonal promotions aligned with peak travel times for key origin markets.
Nearby Short-Term Rental Market Comparison
How does the Quebec Airbnb market stack up against its neighbors? Compare key performance metrics like average monthly revenue, ADR, and occupancy rates in surrounding areas to understand the broader regional STR landscape.
| Market | Active Properties | Monthly Revenue | Daily Rate | Avg. Occupancy |
|---|---|---|---|---|
| Shannon | 39 | $4,054 | $300.77 | 47% |
| Waterloo | 12 | $3,972 | $370.53 | 34% |
| Lac-Beauport | 56 | $3,833 | $240.91 | 53% |
| Saint-Denis-de-Brompton | 29 | $3,749 | $375.15 | 32% |
| Stanstead (Canton) | 37 | $3,684 | $241.35 | 51% |
| Saint-Roch-de-Mékinac | 14 | $3,325 | $384.02 | 33% |
| Lac-Sergent | 10 | $3,315 | $235.49 | 44% |
| Les Éboulements | 139 | $3,230 | $250.03 | 43% |
| Shefford | 28 | $3,221 | $247.26 | 41% |
| Grandes-Piles | 20 | $3,133 | $258.81 | 43% |