Saint Come Airbnb Market Analysis 2026: Short Term Rental Data & Vacation Rental Statistics in Quebec, Canada
Is Airbnb profitable in Saint Come in 2026? Explore comprehensive Airbnb analytics for Saint Come, Quebec, Canada to uncover income potential. This 2026 STR market report for Saint Come, based on AirROI data from February 2025 to January 2026, reveals key trends in the niche market of 28 active listings.
Whether you're considering an Airbnb investment in Saint Come, optimizing your existing vacation rental, or exploring rental arbitrage opportunities, understanding the Saint Come Airbnb data is crucial. Navigating the high regulation landscape is key to maximizing your short term rental income potential. Let's dive into the specifics.
Key Saint Come Airbnb Performance Metrics Overview
Monthly Airbnb Revenue Variations & Income Potential in Saint Come (2026)
Understanding the monthly revenue variations for Airbnb listings in Saint Come is key to maximizing your short term rental income potential. Seasonality significantly impacts earnings. Our analysis, based on data from the past 12 months, shows that the peak revenue month for STRs in Saint Come is typically December, while May often presents the lowest earnings, highlighting opportunities for strategic pricing adjustments during shoulder and low seasons. Explore the typical Airbnb income in Saint Come across different performance tiers:
- Best-in-class properties (Top 10%) achieve $5,341+ monthly, often utilizing dynamic pricing and superior guest experiences.
- Strong performing properties (Top 25%) earn $3,329 or more, indicating effective management and desirable locations/amenities.
- Typical properties (Median) generate around $2,362 per month, representing the average market performance.
- Entry-level properties (Bottom 25%) see earnings around $1,464, often with potential for optimization.
Average Monthly Airbnb Earnings Trend in Saint Come
Saint Come Airbnb Occupancy Rate Trends (2026)
Maximize your bookings by understanding the Saint Come STR occupancy trends. Seasonal demand shifts significantly influence how often properties are booked. Typically, Augustsees the highest demand (peak season occupancy), while May experiences the lowest (low season). Effective strategies, like adjusting minimum stays or offering promotions, can boost occupancy during slower periods. Here's how different property tiers perform in Saint Come:
- Best-in-class properties (Top 10%) achieve 57%+ occupancy, indicating high desirability and potentially optimized availability.
- Strong performing properties (Top 25%) maintain 43% or higher occupancy, suggesting good market fit and guest satisfaction.
- Typical properties (Median) have an occupancy rate around 29%.
- Entry-level properties (Bottom 25%) average 18% occupancy, potentially facing higher vacancy.
Average Monthly Occupancy Rate Trend in Saint Come
Average Daily Rate (ADR) Airbnb Trends in Saint Come (2026)
Effective short term rental pricing strategy in Saint Come involves understanding monthly ADR fluctuations. The Average Daily Rate (ADR) for Airbnb in Saint Come typically peaks in December and dips lowest during November. Leveraging Airbnb dynamic pricing tools or strategies based on this seasonality can significantly boost revenue. Here's a look at the typical nightly rates achieved:
- Best-in-class properties (Top 10%) command rates of $369+ per night, often due to premium features or locations.
- Strong performing properties (Top 25%) achieve nightly rates of $320 or more.
- Typical properties (Median) charge around $245 per night.
- Entry-level properties (Bottom 25%) earn around $181 per night.
Average Daily Rate (ADR) Trend by Month in Saint Come
Get Live Saint Come Market Intelligence 👇
Explore Real-time Analytics
Airbnb Seasonality Analysis & Trends in Saint Come (2026)
Peak Season (December, August, July)
- Revenue averages $3,820 per month
- Occupancy rates average 43.6%
- Daily rates average $269
Shoulder Season
- Revenue averages $2,091 per month
- Occupancy maintains around 26.2%
- Daily rates hold near $255
Low Season (February, March, April)
- Revenue drops to average $0 per month
- Occupancy decreases to average 0.0%
- Daily rates adjust to average $259
Seasonality Insights for Saint Come
- The Airbnb seasonality in Saint Come shows highly seasonal trends requiring careful strategy. While the sections above show seasonal averages, it's also insightful to look at the extremes:
- During the high season, the absolute peak month showcases Saint Come's highest earning potential, with monthly revenues capable of climbing to $4,276, occupancy reaching a high of 50.5%, and ADRs peaking at $318.
- Conversely, the slowest single month of the year, typically falling within the low season, marks the market's lowest point. In this month, revenue might dip to $0, occupancy could drop to 0.0%, and ADRs may adjust down to $227.
- Understanding both the seasonal averages and these monthly peaks and troughs in revenue, occupancy, and ADR is crucial for maximizing your Airbnb profit potential in Saint Come.
Seasonal Strategies for Maximizing Profit
- Peak Season: Maximize revenue through premium pricing and potentially longer minimum stays. Ensure high availability.
- Low Season: Offer competitive pricing, special promotions (e.g., extended stay discounts), and flexible cancellation policies. Target off-season travelers like remote workers or budget-conscious guests.
- Shoulder Seasons: Implement dynamic pricing that balances peak and low rates. Target weekend travelers or specific events. Offer slightly more flexible terms than peak season.
- Regularly analyze your own performance against these Saint Come seasonality benchmarks and adjust your pricing and availability strategy accordingly.
Best Areas for Airbnb Investment in Saint Come (2026)
Exploring the top neighborhoods for short-term rentals in Saint Come? This section highlights key areas, outlining why they are attractive for hosts and guests, along with notable local attractions. Consider these locations based on your target guest profile and investment strategy.
| Neighborhood / Area | Why Host Here? (Target Guests & Appeal) | Key Attractions & Landmarks |
|---|---|---|
| Lac Saint Come | A beautiful lake surrounded by nature, popular for summer and winter activities. A prime location for those seeking relaxation and outdoor adventures, making it perfect for vacation rentals. | Lac Saint Come, Ski Montcalm, Sentiers de l'Estrie, Montagne du Diable, Canoeing and kayaking opportunities, Fishing spots |
| Valley of the 1000 Lakes | This region offers breathtaking scenery and numerous lakes, making it an ideal spot for nature enthusiasts and vacationers looking to explore outdoor activities and serenity. | Parc National du Mont-Tremblant, Lake Ouimet, Lac des Écorces, Hiking and biking trails, Camping spots, Water sports on the lakes |
| Montcalm | Known for its skiing and winter sports, Montcalm attracts snow enthusiasts throughout the winter season. It provides ample opportunities for seasonal rental properties. | Ski Montcalm, Snowshoeing trails, Ice fishing, Winter festivals, Snowmobile trails, Local dining options |
| Saint Come Village | A quaint village atmosphere with charming local shops and eateries. Great for visitors wanting a cozy and authentic Quebec experience. | Local artisan shops, Bistro des Gourmets, Historical sites, Community events, Markets, Cultural festivals |
| La Réserve | A stunning natural park area perfect for hiking and wildlife watching. Ideal for those looking to enjoy outdoor activities and a peaceful environment. | La Réserve Naturelle des Monts-Valin, Bird watching, Hiking trails, Nature photography, Flora and fauna diversity, Picnic areas |
| Saint Donat | Popular for its ski resorts and year-round outdoor activities. It offers a family-friendly environment with lots of recreational options. | Mont Garceau, Lake Archambault, Festival des Arts, Winter sports activities, Summer hiking, Cultural attractions |
| Rawdon | Easily accessible from major cities, Rawdon features numerous lakes and outdoor recreation opportunities, making it a great spot for short-term rentals. | Rawdon Park, Lac Rawdon, Golf courses, Hiking trails, Year-round outdoor activities, Community festivals |
| Lanaudière Region | Known for its rich cultural heritage and natural beauty, offering travelers a blend of history and nature that's appealing for short-term stays. | Cultural attractions, Charming towns, Natural parks, Art galleries, Local cuisine, Festivals and events |
Understanding Airbnb License Requirements & STR Laws in Saint Come (2026)
Yes, Saint Come, Quebec, Canada enforces high STR regulations. Obtaining a license and ensuring compliance is almost certainly required according to current 2026 STR laws. Always verify the latest short term rental regulations and Airbnb license requirements directly with local government authorities for Saint Come to ensure full compliance before hosting.
(Source: AirROI data, 2026, based on 96% licensed listings)
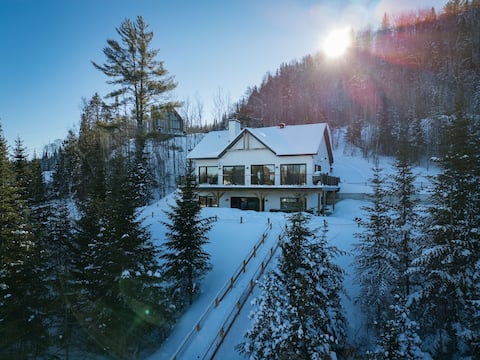
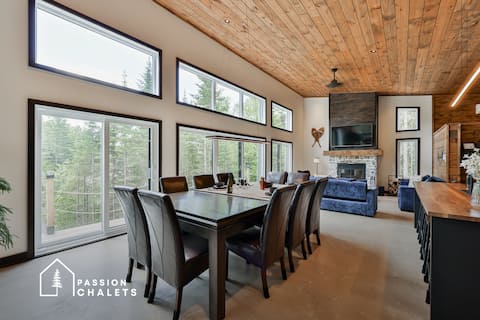
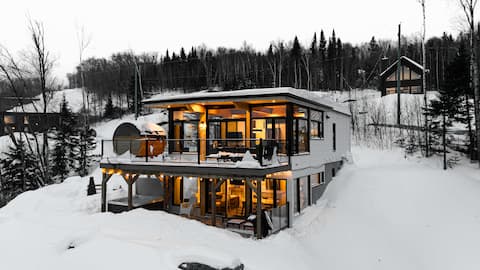
Top Performing Airbnb Properties in Saint Come (2026)
Benchmark your potential! Explore examples of top-performing Airbnb properties in Saint Comebased on Trailing Twelve Month (TTM) revenue. Analyze their characteristics, revenue, occupancy rate, and ADR to understand what drives success in this market.
Spa - Pool Table - Lake Access - Chalet Saint-Cerf
Entire Place • 4 bedrooms

Houéfifa | Passion Chalets | Ski - Foyer - Spa
Entire Place • 4 bedrooms
Le Charlois | Passion Chalets | Lakefront & Spa
Entire Place • 3 bedrooms
Ski Chalet with Sauna and Spa - La Vedette
Entire Place • 4 bedrooms
Le Loup | Passion Chalets | Spa - Sauna - Arcade
Entire Place • 4 bedrooms
Panoramic View - Spa - L'Espace-temps
Entire Place • 3 bedrooms
Note: Performance varies based on location, size, amenities, seasonality, and management quality. Data reflects the past 12 months.
Top Performing Airbnb Hosts in Saint Come (2026)
Learn from the best! This table showcases top-performing Airbnb hosts in Saint Come based on the number of properties managed and estimated total revenue over the past year. Analyze their scale and performance metrics.
| Host Name | Properties | Grossing Revenue | Stay Reviews | Avg Rating |
|---|---|---|---|---|
| Chaletô | 13 | $313,689 | 274 | 4.70/5.0 |
| Émy | 5 | $148,883 | 26 | 4.90/5.0 |
| Mélanie | 2 | $45,102 | 56 | 4.93/5.0 |
| Galaxia | 2 | $32,197 | 18 | 4.60/5.0 |
| L'Équipe Ma Kabane | 2 | $24,405 | 21 | 4.96/5.0 |
| Anaïs | 1 | $22,114 | 13 | 4.77/5.0 |
| Geneviève | 1 | $14,183 | 6 | 5.00/5.0 |
| Daphné | 1 | $5,687 | 2 | Not Rated |
| Gestion BNB | 1 | $3,536 | 4 | 4.00/5.0 |
Analyzing the strategies of top hosts, such as their property selection, pricing, and guest communication, can offer valuable lessons for optimizing your own Airbnb operations in Saint Come.
Dive Deeper: Advanced Saint Come STR Market Data (2026)
Ready to unlock more insights? AirROI provides access to advanced metrics and comprehensive Airbnb data for Saint Come. Explore detailed analytics beyond this report to refine your investment strategy, optimize pricing, and maximize your vacation rental profits.
Explore Advanced MetricsSaint Come Short-Term Rental Market Composition (2026): Property & Room Types
Room Type Distribution
Property Type Distribution
Market Composition Insights for Saint Come
- The Saint Come Airbnb market composition is heavily skewed towards Entire Home/Apt listings, which make up 100% of the 28 active rentals. This indicates strong guest preference for privacy and space.
- Looking at the property type distribution in Saint Come, House properties are the most common (82.1%), reflecting the local real estate landscape.
- Houses represent a significant 82.1% portion, catering likely to families or larger groups.
- Smaller segments like unique stays, outdoor/unique (combined 7.2%) offer potential for unique stay experiences.
Saint Come Airbnb Room Capacity Analysis (2026): Bedroom Distribution
Distribution of Listings by Number of Bedrooms
Room Capacity Insights for Saint Come
- The dominant room capacity in Saint Come is 4 bedrooms listings, making up 35.7% of the market. This suggests a strong demand for properties suitable for families or small groups.
- Together, 4 bedrooms and 3 bedrooms properties represent 71.4% of the active Airbnb listings in Saint Come, indicating a high concentration in these sizes.
- A significant 71.4% of listings offer 3+ bedrooms, catering to larger groups and families seeking more space in Saint Come.
Saint Come Vacation Rental Guest Capacity Trends (2026)
Distribution of Listings by Guest Capacity
Guest Capacity Insights for Saint Come
- The most common guest capacity trend in Saint Come vacation rentals is listings accommodating 8+ guests (67.9%). This suggests the primary traveler segment is likely larger groups.
- Properties designed for 8+ guests and 6 guests dominate the Saint Come STR market, accounting for 85.8% of listings.
- 85.8% of properties accommodate 6+ guests, serving the market segment for larger families or group travel in Saint Come.
- On average, properties in Saint Come are equipped to host 7.2 guests.
Saint Come Airbnb Booking Patterns (2026): Available vs. Booked Days
Available Days Distribution
Booked Days Distribution
Booking Pattern Insights for Saint Come
- The most common availability pattern in Saint Come falls within the 271-366 days range, representing 60.7% of listings. This suggests many properties have significant open periods on their calendars.
- Approximately 100.0% of listings show high availability (181+ days open annually), indicating potential for increased bookings or specific owner usage patterns.
- For booked days, the 31-90 days range is most frequent in Saint Come (53.6%), reflecting common guest stay durations or potential owner blocking patterns.
Saint Come Airbnb Minimum Stay Requirements Analysis
Distribution of Listings by Minimum Night Requirement
2 Nights
25 listings
89.3% of total
30+ Nights
3 listings
10.7% of total
Key Insights
- The most prevalent minimum stay requirement in Saint Come is 2 Nights, adopted by 89.3% of listings. This highlights the market's preference for shorter, flexible bookings.
- A strong majority (89.3%) of the Saint Come Airbnb data shows acceptance of very short stays (1-2 nights), indicating a dynamic, high-turnover market.
- A significant segment (10.7%) caters to monthly stays (30+ nights) in Saint Come, pointing to opportunities in the extended-stay market.
Recommendations
- Align with the market by considering a 2 Nights minimum stay, as 89.3% of Saint Come hosts use this setting.
- A 2-night minimum appears standard (89.3%). Consider this for weekends or peak periods.
- Explore offering discounts for stays of 30+ nights to attract the 10.7% of the market seeking extended stays.
- Adjust minimum nights based on seasonality – potentially shorter during low season and longer during peak demand periods in Saint Come.
Saint Come Airbnb Cancellation Policy Trends Analysis (2026)
Super Strict 60 Days
7 listings
25% of total
Super Strict 30 Days
7 listings
25% of total
Limited
6 listings
21.4% of total
Firm
6 listings
21.4% of total
Strict
2 listings
7.1% of total
Cancellation Policy Insights for Saint Come
- The prevailing Airbnb cancellation policy trend in Saint Come is Super Strict 60 Days, used by 25% of listings.
- There's a relatively balanced mix between guest-friendly (0.0%) and stricter (28.5%) policies, offering choices for different guest needs.
- Strict cancellation policies are quite rare (7.1%), potentially making listings with this policy less competitive unless justified by high demand or property type.
Recommendations for Hosts
- Consider adopting a Super Strict 60 Days policy to align with the 25% market standard in Saint Come.
- Using a Strict policy might deter some guests, as only 7.1% of listings use it. Evaluate if potential revenue protection outweighs possible lower booking rates.
- Regularly review your cancellation policy against competitors and market demand shifts in Saint Come.
Saint Come STR Booking Lead Time Analysis (2026)
Average Booking Lead Time by Month
Booking Lead Time Insights for Saint Come
- The overall average booking lead time for vacation rentals in Saint Come is 29 days.
- Guests book furthest in advance for stays during December (average 60 days), likely coinciding with peak travel demand or local events.
- The shortest booking windows occur for stays in April (average 0 days), indicating more last-minute travel plans during this time.
- Seasonally, Winter (32 days avg.) sees the longest lead times, while Spring (1 days avg.) has the shortest, reflecting typical travel planning cycles.
Recommendations for Hosts
- Use the overall average lead time (29 days) as a baseline for your pricing and availability strategy in Saint Come.
- For December stays, consider implementing length-of-stay discounts or slightly higher rates for bookings made less than 60 days out to capitalize on advance planning.
- During April, focus on last-minute booking availability and promotions, as guests book with very short notice (0 days avg.).
- Target marketing efforts for the Winter season well in advance (at least 32 days) to capture early planners.
- Monitor your own booking lead times against these Saint Come averages to identify opportunities for dynamic pricing adjustments.
Popular & Essential Airbnb Amenities in Saint Come (2026)
Amenity Prevalence
Amenity Insights for Saint Come
- Essential amenities in Saint Come that guests expect include: Kitchen, Refrigerator, Cooking basics, Stove, Heating, Smoke alarm, Bed linens, Free parking on premises, Air conditioning, Toaster. Lacking these (any) could significantly impact bookings.
Recommendations for Hosts
- Ensure your listing includes all essential amenities for Saint Come: Kitchen, Refrigerator, Cooking basics, Stove, Heating, Smoke alarm, Bed linens, Free parking on premises, Air conditioning, Toaster.
- Prioritize adding missing essentials: Toaster.
- Highlight unique or less common amenities you offer (e.g., hot tub, dedicated workspace, EV charger) in your listing description and photos.
- Regularly check competitor amenities in Saint Come to stay competitive.
Saint Come Airbnb Guest Demographics & Profile Analysis (2026)
Guest Profile Summary for Saint Come
- The typical guest profile for Airbnb in Saint Come consists of primarily domestic travelers (87%), often arriving from nearby Montreal, typically belonging to the Post-2000s (Gen Z/Alpha) group (50%), primarily speaking English or French.
- Domestic travelers account for 86.6% of guests.
- Key international markets include Canada (86.6%) and United States (5.7%).
- Top languages spoken are English (42.5%) followed by French (41.1%).
- A significant demographic segment is the Post-2000s (Gen Z/Alpha) group, representing 50% of guests.
Recommendations for Hosts
- Target domestic marketing efforts towards travelers from Montreal and Laval.
- Tailor amenities and listing descriptions to appeal to the dominant Post-2000s (Gen Z/Alpha) demographic (e.g., highlight fast WiFi, smart home features, local guides).
- Highlight unique local experiences or amenities relevant to the primary guest profile.
- Consider seasonal promotions aligned with peak travel times for key origin markets.
Nearby Short-Term Rental Market Comparison
How does the Saint Come Airbnb market stack up against its neighbors? Compare key performance metrics like average monthly revenue, ADR, and occupancy rates in surrounding areas to understand the broader regional STR landscape.
| Market | Active Properties | Monthly Revenue | Daily Rate | Avg. Occupancy |
|---|---|---|---|---|
| Mille-Isles | 89 | $5,219 | $472.25 | 38% |
| Waterloo | 12 | $3,972 | $370.53 | 34% |
| La Conception | 183 | $3,872 | $333.14 | 41% |
| Venise-en-Québec | 19 | $3,816 | $378.35 | 38% |
| Grenville-sur-la-Rouge | 31 | $3,795 | $381.21 | 39% |
| Saint-Denis-de-Brompton | 29 | $3,749 | $375.15 | 32% |
| Stanstead (Canton) | 37 | $3,684 | $241.35 | 51% |
| Saint-Roch-de-Mékinac | 14 | $3,325 | $384.02 | 33% |
| Saint-Alphonse-Rodriguez | 35 | $3,249 | $305.90 | 44% |
| Shefford | 28 | $3,221 | $247.26 | 41% |