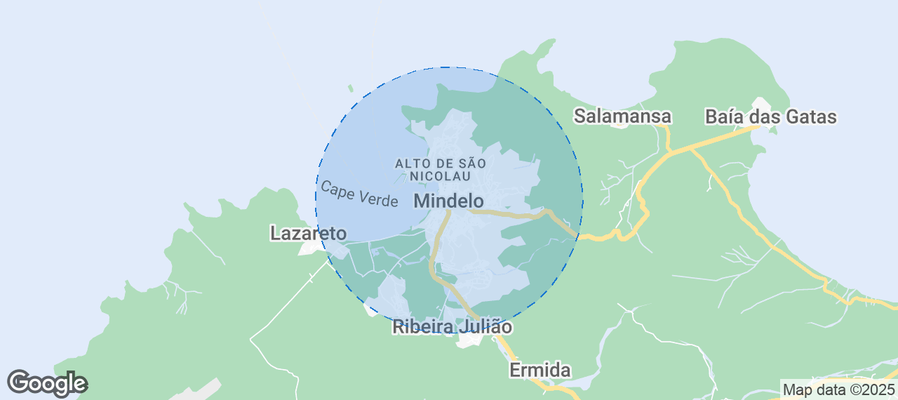
Mindelo Airbnb Market Analysis 2026: Short Term Rental Data & Vacation Rental Statistics in São Vicente, Cape Verde
Is Airbnb profitable in Mindelo in 2026? Explore comprehensive Airbnb analytics for Mindelo, São Vicente, Cape Verde to uncover income potential. This 2026 STR market report for Mindelo, based on AirROI data from February 2025 to January 2026, reveals key trends in the niche market of 35 active listings.
Whether you're considering an Airbnb investment in Mindelo, optimizing your existing vacation rental, or exploring rental arbitrage opportunities, understanding the Mindelo Airbnb data is crucial. Leveraging the low regulation environment is key to maximizing your short term rental income potential. Let's dive into the specifics.
Key Mindelo Airbnb Performance Metrics Overview
Monthly Airbnb Revenue Variations & Income Potential in Mindelo (2026)
Understanding the monthly revenue variations for Airbnb listings in Mindelo is key to maximizing your short term rental income potential. Seasonality significantly impacts earnings. Our analysis, based on data from the past 12 months, shows that the peak revenue month for STRs in Mindelo is typically February, while May often presents the lowest earnings, highlighting opportunities for strategic pricing adjustments during shoulder and low seasons. Explore the typical Airbnb income in Mindelo across different performance tiers:
- Best-in-class properties (Top 10%) achieve $1,834+ monthly, often utilizing dynamic pricing and superior guest experiences.
- Strong performing properties (Top 25%) earn $1,157 or more, indicating effective management and desirable locations/amenities.
- Typical properties (Median) generate around $690 per month, representing the average market performance.
- Entry-level properties (Bottom 25%) see earnings around $288, often with potential for optimization.
Average Monthly Airbnb Earnings Trend in Mindelo
Mindelo Airbnb Occupancy Rate Trends (2026)
Maximize your bookings by understanding the Mindelo STR occupancy trends. Seasonal demand shifts significantly influence how often properties are booked. Typically, Februarysees the highest demand (peak season occupancy), while May experiences the lowest (low season). Effective strategies, like adjusting minimum stays or offering promotions, can boost occupancy during slower periods. Here's how different property tiers perform in Mindelo:
- Best-in-class properties (Top 10%) achieve 67%+ occupancy, indicating high desirability and potentially optimized availability.
- Strong performing properties (Top 25%) maintain 54% or higher occupancy, suggesting good market fit and guest satisfaction.
- Typical properties (Median) have an occupancy rate around 33%.
- Entry-level properties (Bottom 25%) average 15% occupancy, potentially facing higher vacancy.
Average Monthly Occupancy Rate Trend in Mindelo
Average Daily Rate (ADR) Airbnb Trends in Mindelo (2026)
Effective short term rental pricing strategy in Mindelo involves understanding monthly ADR fluctuations. The Average Daily Rate (ADR) for Airbnb in Mindelo typically peaks in September and dips lowest during April. Leveraging Airbnb dynamic pricing tools or strategies based on this seasonality can significantly boost revenue. Here's a look at the typical nightly rates achieved:
- Best-in-class properties (Top 10%) command rates of $121+ per night, often due to premium features or locations.
- Strong performing properties (Top 25%) achieve nightly rates of $90 or more.
- Typical properties (Median) charge around $63 per night.
- Entry-level properties (Bottom 25%) earn around $43 per night.
Average Daily Rate (ADR) Trend by Month in Mindelo
Get Live Mindelo Market Intelligence 👇
Explore Real-time Analytics
Airbnb Seasonality Analysis & Trends in Mindelo (2026)
Peak Season (February, November, March)
- Revenue averages $1,187 per month
- Occupancy rates average 46.1%
- Daily rates average $81
Shoulder Season
- Revenue averages $915 per month
- Occupancy maintains around 36.8%
- Daily rates hold near $81
Low Season (May, September, October)
- Revenue drops to average $594 per month
- Occupancy decreases to average 22.5%
- Daily rates adjust to average $83
Seasonality Insights for Mindelo
- The Airbnb seasonality in Mindelo shows highly seasonal trends requiring careful strategy. While the sections above show seasonal averages, it's also insightful to look at the extremes:
- During the high season, the absolute peak month showcases Mindelo's highest earning potential, with monthly revenues capable of climbing to $1,337, occupancy reaching a high of 58.0%, and ADRs peaking at $87.
- Conversely, the slowest single month of the year, typically falling within the low season, marks the market's lowest point. In this month, revenue might dip to $282, occupancy could drop to 13.9%, and ADRs may adjust down to $79.
- Understanding both the seasonal averages and these monthly peaks and troughs in revenue, occupancy, and ADR is crucial for maximizing your Airbnb profit potential in Mindelo.
Seasonal Strategies for Maximizing Profit
- Peak Season: Maximize revenue through premium pricing and potentially longer minimum stays. Ensure high availability.
- Low Season: Offer competitive pricing, special promotions (e.g., extended stay discounts), and flexible cancellation policies. Target off-season travelers like remote workers or budget-conscious guests.
- Shoulder Seasons: Implement dynamic pricing that balances peak and low rates. Target weekend travelers or specific events. Offer slightly more flexible terms than peak season.
- Regularly analyze your own performance against these Mindelo seasonality benchmarks and adjust your pricing and availability strategy accordingly.
Best Areas for Airbnb Investment in Mindelo (2026)
Exploring the top neighborhoods for short-term rentals in Mindelo? This section highlights key areas, outlining why they are attractive for hosts and guests, along with notable local attractions. Consider these locations based on your target guest profile and investment strategy.
| Neighborhood / Area | Why Host Here? (Target Guests & Appeal) | Key Attractions & Landmarks |
|---|---|---|
| Praia da Laginha | The most popular beach in Mindelo, known for its beautiful sand and clear waters. It's a prime spot for both tourists wanting to relax by the sea and locals enjoying leisure activities. | Laginha Beach, Kite Surfing, Beachfront restaurants, Music events, Sunbathing spots |
| Centro Histórico | The historic center of Mindelo features colonial architecture and cultural attractions, appealing to travelers interested in history and local culture. | Museu do Mar, Palácio do Povo, Historical buildings, Local markets, Cultural events |
| Mindelo Marina | A hub for sailing and water sports, attracting tourists interested in maritime activities and nightlife. It provides access to various boat trips and excursions. | Marina facilities, Boat tours, Waterfront dining, Nightclubs, Art galleries |
| Cabo Verde's nightlife district | This area is known for its vibrant nightlife, with bars and clubs that attract both locals and tourists looking for entertainment after dark. | Live music venues, Dance clubs, Bars with local drinks, Cultural performances, Street parties |
| Mercado Municipal | A bustling local market where tourists can experience local flavors and crafts, great for those wanting to immerse themselves in local life. | Local produce, Handcrafted souvenirs, Street food vendors, Cultural atmosphere, Local artisans |
| Ponta d'Pom | Famous for its stunning sunsets and beautiful viewpoints, ideal for couples and those looking for a romantic getaway. | Scenic views, Sunset viewing, Photography spots, Walking trails, Local dining options |
| Cultural Center of Mindelo | A place for art and cultural events, attracting those interested in the arts, theater, and music. | Art exhibitions, Theater performances, Live music, Workshops, Cultural festivals |
| Baía das Gatas | Known for its annual music festival and beautiful beach, it attracts both locals and tourists, especially during the summer months. | Baía das Gatas beach, Music festival, Camping areas, Natural beauty, Ecotourism opportunities |
Understanding Airbnb License Requirements & STR Laws in Mindelo (2026)
While Mindelo, São Vicente, Cape Verde currently shows low STR regulations, specific Airbnb license requirements might still exist or change. Always verify the latest short term rental regulations and Airbnb license requirements directly with local government authorities for Mindelo to ensure full compliance before hosting.
(Source: AirROI data, 2026, finding no licensed listings among those analyzed)
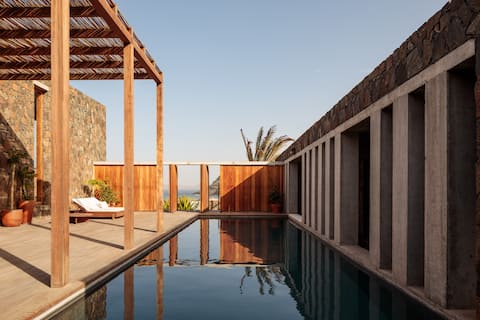
Top Performing Airbnb Properties in Mindelo (2026)
Benchmark your potential! Explore examples of top-performing Airbnb properties in Mindelobased on Trailing Twelve Month (TTM) revenue. Analyze their characteristics, revenue, occupancy rate, and ADR to understand what drives success in this market.
Casa Amigos Cabo
Entire Place • 3 bedrooms

T2 Magnificent Ocean View
Entire Place • 2 bedrooms
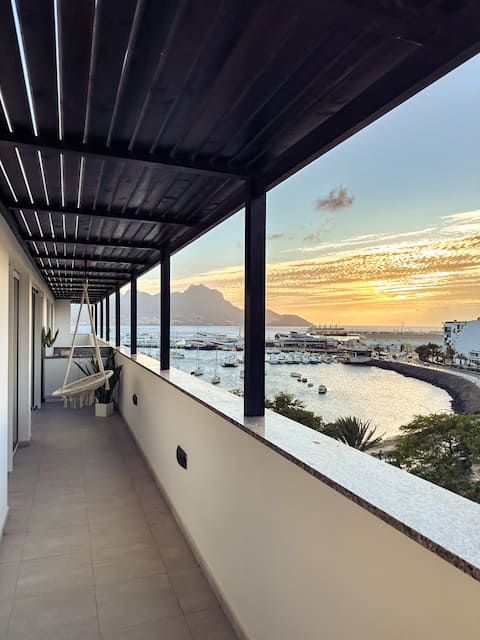
Marina Mindelo Bay View
Entire Place • 1 bedroom
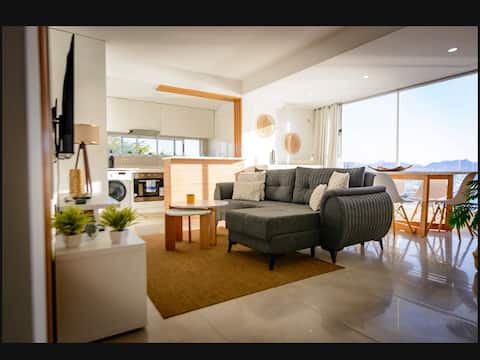
Extraordinary Bay View Apartment
Entire Place • 2 bedrooms
Villa - Sea View and Private Pool
Entire Place • 4 bedrooms
Beautiful Seafront Villa-Mindelo
Entire Place • 2 bedrooms
Note: Performance varies based on location, size, amenities, seasonality, and management quality. Data reflects the past 12 months.
Top Performing Airbnb Hosts in Mindelo (2026)
Learn from the best! This table showcases top-performing Airbnb hosts in Mindelo based on the number of properties managed and estimated total revenue over the past year. Analyze their scale and performance metrics.
| Host Name | Properties | Grossing Revenue | Stay Reviews | Avg Rating |
|---|---|---|---|---|
| Marcus | 4 | $27,123 | 16 | 4.37/5.0 |
| Serge | 1 | $26,920 | 12 | 5.00/5.0 |
| Marise | 1 | $18,348 | 9 | 4.89/5.0 |
| Ausenda | 1 | $16,620 | 17 | 4.94/5.0 |
| Yenda Rodrigues | 1 | $15,731 | 26 | 4.96/5.0 |
| Thibaut | 1 | $13,732 | 4 | 5.00/5.0 |
| Ira | 1 | $11,863 | 48 | 4.79/5.0 |
| Jennifer | 1 | $10,431 | 12 | 4.92/5.0 |
| Samuel - LCGR | 1 | $8,615 | 3 | 4.33/5.0 |
| Kevin | 1 | $8,580 | 22 | 4.73/5.0 |
Analyzing the strategies of top hosts, such as their property selection, pricing, and guest communication, can offer valuable lessons for optimizing your own Airbnb operations in Mindelo.
Dive Deeper: Advanced Mindelo STR Market Data (2026)
Ready to unlock more insights? AirROI provides access to advanced metrics and comprehensive Airbnb data for Mindelo. Explore detailed analytics beyond this report to refine your investment strategy, optimize pricing, and maximize your vacation rental profits.
Explore Advanced MetricsMindelo Short-Term Rental Market Composition (2026): Property & Room Types
Room Type Distribution
Property Type Distribution
Market Composition Insights for Mindelo
- The Mindelo Airbnb market composition is heavily skewed towards Entire Home/Apt listings, which make up 91.4% of the 35 active rentals. This indicates strong guest preference for privacy and space.
- Looking at the property type distribution in Mindelo, Apartment/Condo properties are the most common (85.7%), reflecting the local real estate landscape.
- Smaller segments like hotel/boutique (combined 2.9%) offer potential for unique stay experiences.
Mindelo Airbnb Room Capacity Analysis (2026): Bedroom Distribution
Distribution of Listings by Number of Bedrooms
Room Capacity Insights for Mindelo
- The dominant room capacity in Mindelo is 2 bedrooms listings, making up 45.7% of the market. This suggests a strong demand for properties suitable for couples or solo travelers.
- Together, 2 bedrooms and 1 bedroom properties represent 77.1% of the active Airbnb listings in Mindelo, indicating a high concentration in these sizes.
Mindelo Vacation Rental Guest Capacity Trends (2026)
Distribution of Listings by Guest Capacity
Guest Capacity Insights for Mindelo
- The most common guest capacity trend in Mindelo vacation rentals is listings accommodating 4 guests (40%). This suggests the primary traveler segment is likely small families or groups.
- Properties designed for 4 guests and 6 guests dominate the Mindelo STR market, accounting for 60.0% of listings.
- 28.6% of properties accommodate 6+ guests, serving the market segment for larger families or group travel in Mindelo.
- On average, properties in Mindelo are equipped to host 4.3 guests.
Mindelo Airbnb Booking Patterns (2026): Available vs. Booked Days
Available Days Distribution
Booked Days Distribution
Booking Pattern Insights for Mindelo
- The most common availability pattern in Mindelo falls within the 271-366 days range, representing 71.4% of listings. This suggests many properties have significant open periods on their calendars.
- Approximately 97.1% of listings show high availability (181+ days open annually), indicating potential for increased bookings or specific owner usage patterns.
- For booked days, the 31-90 days range is most frequent in Mindelo (48.6%), reflecting common guest stay durations or potential owner blocking patterns.
- A notable 2.9% of properties secure long booking periods (181+ days booked per year), highlighting successful long-term rental strategies or significant owner usage.
Mindelo Airbnb Minimum Stay Requirements Analysis
Distribution of Listings by Minimum Night Requirement
1 Night
8 listings
22.9% of total
2 Nights
14 listings
40% of total
3 Nights
4 listings
11.4% of total
4-6 Nights
4 listings
11.4% of total
30+ Nights
5 listings
14.3% of total
Key Insights
- The most prevalent minimum stay requirement in Mindelo is 2 Nights, adopted by 40% of listings. This highlights the market's preference for shorter, flexible bookings.
- A strong majority (62.9%) of the Mindelo Airbnb data shows acceptance of very short stays (1-2 nights), indicating a dynamic, high-turnover market.
- A significant segment (14.3%) caters to monthly stays (30+ nights) in Mindelo, pointing to opportunities in the extended-stay market.
Recommendations
- Align with the market by considering a 2 Nights minimum stay, as 40% of Mindelo hosts use this setting.
- If feasible, allowing 1-night stays, especially midweek or during low season, could capture last-minute bookings, as only 22.9% currently do.
- Explore offering discounts for stays of 30+ nights to attract the 14.3% of the market seeking extended stays.
- Adjust minimum nights based on seasonality – potentially shorter during low season and longer during peak demand periods in Mindelo.
Mindelo Airbnb Cancellation Policy Trends Analysis (2026)
Limited
1 listings
2.9% of total
Flexible
17 listings
48.6% of total
Moderate
5 listings
14.3% of total
Firm
11 listings
31.4% of total
Strict
1 listings
2.9% of total
Cancellation Policy Insights for Mindelo
- The prevailing Airbnb cancellation policy trend in Mindelo is Flexible, used by 48.6% of listings.
- There's a relatively balanced mix between guest-friendly (62.9%) and stricter (34.3%) policies, offering choices for different guest needs.
- Strict cancellation policies are quite rare (2.9%), potentially making listings with this policy less competitive unless justified by high demand or property type.
Recommendations for Hosts
- Consider adopting a Flexible policy to align with the 48.6% market standard in Mindelo.
- Using a Strict policy might deter some guests, as only 2.9% of listings use it. Evaluate if potential revenue protection outweighs possible lower booking rates.
- Regularly review your cancellation policy against competitors and market demand shifts in Mindelo.
Mindelo STR Booking Lead Time Analysis (2026)
Average Booking Lead Time by Month
Booking Lead Time Insights for Mindelo
- The overall average booking lead time for vacation rentals in Mindelo is 45 days.
- Guests book furthest in advance for stays during February (average 68 days), likely coinciding with peak travel demand or local events.
- The shortest booking windows occur for stays in June (average 15 days), indicating more last-minute travel plans during this time.
- Seasonally, Winter (49 days avg.) sees the longest lead times, while Summer (27 days avg.) has the shortest, reflecting typical travel planning cycles.
Recommendations for Hosts
- Use the overall average lead time (45 days) as a baseline for your pricing and availability strategy in Mindelo.
- For February stays, consider implementing length-of-stay discounts or slightly higher rates for bookings made less than 68 days out to capitalize on advance planning.
- Target marketing efforts for the Winter season well in advance (at least 49 days) to capture early planners.
- Monitor your own booking lead times against these Mindelo averages to identify opportunities for dynamic pricing adjustments.
Popular & Essential Airbnb Amenities in Mindelo (2026)
Amenity Prevalence
Amenity Insights for Mindelo
- Popular amenities like Wifi, Kitchen, TV are common but not universal. Offering these can provide a competitive edge.
- Warning: Wifi is not universally provided but is considered essential globally. Ensure reliable Wifi is offered.
Recommendations for Hosts
- Consider adding popular differentiators like Wifi or Kitchen to increase appeal.
- Highlight unique or less common amenities you offer (e.g., hot tub, dedicated workspace, EV charger) in your listing description and photos.
- Regularly check competitor amenities in Mindelo to stay competitive.
Mindelo Airbnb Guest Demographics & Profile Analysis (2026)
Guest Profile Summary for Mindelo
- The typical guest profile for Airbnb in Mindelo consists of predominantly international visitors (99%), with top international origins including Germany, typically belonging to the Post-2000s (Gen Z/Alpha) group (50%), primarily speaking English or French.
- Domestic travelers account for 0.8% of guests.
- Key international markets include France (38.1%) and Germany (11.1%).
- Top languages spoken are English (32.7%) followed by French (19.1%).
- A significant demographic segment is the Post-2000s (Gen Z/Alpha) group, representing 50% of guests.
Recommendations for Hosts
- Focus marketing internationally, particularly towards travelers from Germany.
- Tailor amenities and listing descriptions to appeal to the dominant Post-2000s (Gen Z/Alpha) demographic (e.g., highlight fast WiFi, smart home features, local guides).
- Highlight unique local experiences or amenities relevant to the primary guest profile.
- Consider seasonal promotions aligned with peak travel times for key origin markets.
Nearby Short-Term Rental Market Comparison
How does the Mindelo Airbnb market stack up against its neighbors? Compare key performance metrics like average monthly revenue, ADR, and occupancy rates in surrounding areas to understand the broader regional STR landscape.
| Market | Active Properties | Monthly Revenue | Daily Rate | Avg. Occupancy |
|---|---|---|---|---|
| Ponta do Sol | 17 | $558 | $50.84 | 42% |
| (Cidade) Mindelo | 247 | $540 | $75.76 | 35% |
| Tarrafal | 79 | $447 | $66.70 | 31% |
| Cidade do Maio | 51 | $381 | $67.03 | 27% |
| Tarrafal | 11 | $323 | $55.72 | 26% |
| Porto Novo | 20 | $296 | $46.97 | 30% |
| Ribeira Grande | 16 | $287 | $51.76 | 29% |