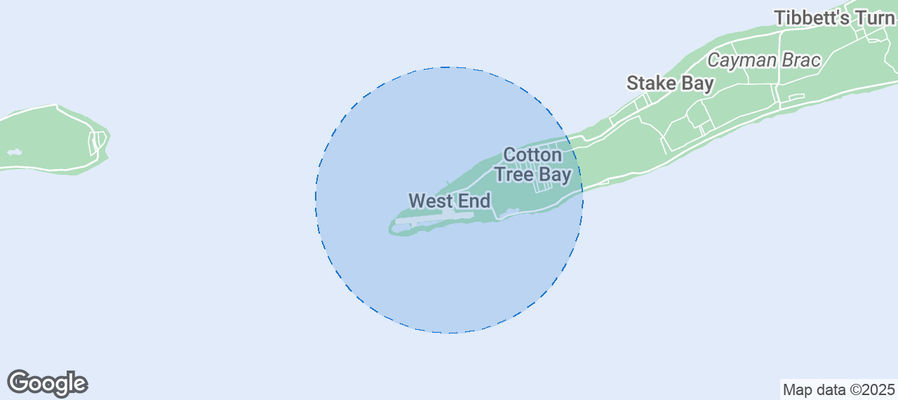
West End Airbnb Market Analysis 2026: Short Term Rental Data & Vacation Rental Statistics in Sister Islands, Cayman Islands
Is Airbnb profitable in West End in 2026? Explore comprehensive Airbnb analytics for West End, Sister Islands, Cayman Islands to uncover income potential. This 2026 STR market report for West End, based on AirROI data from December 2024 to November 2025, reveals key trends in the niche market of 18 active listings.
Whether you're considering an Airbnb investment in West End, optimizing your existing vacation rental, or exploring rental arbitrage opportunities, understanding the West End Airbnb data is crucial. Leveraging the low regulation environment is key to maximizing your short term rental income potential. Let's dive into the specifics.
Key West End Airbnb Performance Metrics Overview
Monthly Airbnb Revenue Variations & Income Potential in West End (2026)
Understanding the monthly revenue variations for Airbnb listings in West End is key to maximizing your short term rental income potential. Seasonality significantly impacts earnings. Our analysis, based on data from the past 12 months, shows that the peak revenue month for STRs in West End is typically December, while September often presents the lowest earnings, highlighting opportunities for strategic pricing adjustments during shoulder and low seasons. Explore the typical Airbnb income in West End across different performance tiers:
- Best-in-class properties (Top 10%) achieve $5,566+ monthly, often utilizing dynamic pricing and superior guest experiences.
- Strong performing properties (Top 25%) earn $3,979 or more, indicating effective management and desirable locations/amenities.
- Typical properties (Median) generate around $2,463 per month, representing the average market performance.
- Entry-level properties (Bottom 25%) see earnings around $1,656, often with potential for optimization.
Average Monthly Airbnb Earnings Trend in West End
West End Airbnb Occupancy Rate Trends (2026)
Maximize your bookings by understanding the West End STR occupancy trends. Seasonal demand shifts significantly influence how often properties are booked. Typically, Februarysees the highest demand (peak season occupancy), while September experiences the lowest (low season). Effective strategies, like adjusting minimum stays or offering promotions, can boost occupancy during slower periods. Here's how different property tiers perform in West End:
- Best-in-class properties (Top 10%) achieve 63%+ occupancy, indicating high desirability and potentially optimized availability.
- Strong performing properties (Top 25%) maintain 51% or higher occupancy, suggesting good market fit and guest satisfaction.
- Typical properties (Median) have an occupancy rate around 32%.
- Entry-level properties (Bottom 25%) average 20% occupancy, potentially facing higher vacancy.
Average Monthly Occupancy Rate Trend in West End
Average Daily Rate (ADR) Airbnb Trends in West End (2026)
Effective short term rental pricing strategy in West End involves understanding monthly ADR fluctuations. The Average Daily Rate (ADR) for Airbnb in West End typically peaks in January and dips lowest during August. Leveraging Airbnb dynamic pricing tools or strategies based on this seasonality can significantly boost revenue. Here's a look at the typical nightly rates achieved:
- Best-in-class properties (Top 10%) command rates of $437+ per night, often due to premium features or locations.
- Strong performing properties (Top 25%) achieve nightly rates of $360 or more.
- Typical properties (Median) charge around $269 per night.
- Entry-level properties (Bottom 25%) earn around $195 per night.
Average Daily Rate (ADR) Trend by Month in West End
Get Live West End Market Intelligence 👇
Explore Real-time Analytics
Airbnb Seasonality Analysis & Trends in West End (2025)
Peak Season (December, February, January)
- Revenue averages $5,122 per month
- Occupancy rates average 54.6%
- Daily rates average $304
Shoulder Season
- Revenue averages $2,841 per month
- Occupancy maintains around 32.7%
- Daily rates hold near $297
Low Season (June, July, September)
- Revenue drops to average $1,956 per month
- Occupancy decreases to average 23.6%
- Daily rates adjust to average $298
Seasonality Insights for West End
- The Airbnb seasonality in West End shows highly seasonal trends requiring careful strategy. While the sections above show seasonal averages, it's also insightful to look at the extremes:
- During the high season, the absolute peak month showcases West End's highest earning potential, with monthly revenues capable of climbing to $5,929, occupancy reaching a high of 65.3%, and ADRs peaking at $306.
- Conversely, the slowest single month of the year, typically falling within the low season, marks the market's lowest point. In this month, revenue might dip to $1,535, occupancy could drop to 17.4%, and ADRs may adjust down to $287.
- Understanding both the seasonal averages and these monthly peaks and troughs in revenue, occupancy, and ADR is crucial for maximizing your Airbnb profit potential in West End.
Seasonal Strategies for Maximizing Profit
- Peak Season: Maximize revenue through premium pricing and potentially longer minimum stays. Ensure high availability.
- Low Season: Offer competitive pricing, special promotions (e.g., extended stay discounts), and flexible cancellation policies. Target off-season travelers like remote workers or budget-conscious guests.
- Shoulder Seasons: Implement dynamic pricing that balances peak and low rates. Target weekend travelers or specific events. Offer slightly more flexible terms than peak season.
- Regularly analyze your own performance against these West End seasonality benchmarks and adjust your pricing and availability strategy accordingly.
Best Areas for Airbnb Investment in West End (2026)
Exploring the top neighborhoods for short-term rentals in West End? This section highlights key areas, outlining why they are attractive for hosts and guests, along with notable local attractions. Consider these locations based on your target guest profile and investment strategy.
| Neighborhood / Area | Why Host Here? (Target Guests & Appeal) | Key Attractions & Landmarks |
|---|---|---|
| Seven Mile Beach | Renowned for its stunning beaches and clear waters, Seven Mile Beach is a prime tourist destination with luxury resorts and vibrant nightlife. It attracts tourists looking for a Caribbean getaway with numerous dining and entertainment options. | Seven Mile Beach, Camana Bay, Governor's Beach, the Coral Beach Club, water sports activities, restaurants and bars |
| West Bay | A quieter area offering beautiful beaches and local culture, West Bay is perfect for families and those who want a more laid-back experience. It's close to attractions like the Cayman Turtle Centre and famous snorkeling spots. | Cayman Turtle Centre, Barker's National Park, West Bay Beach, Snorkeling at the Barrier Reef, Local seafood restaurants |
| George Town | As the capital of the Cayman Islands, George Town has a mix of historical charm and modern amenities. It's ideal for tourists interested in shopping, local culture, and easy access to cruise ship terminals. | National Gallery of the Cayman Islands, Fort George, day cruises, local shops, duty-free shopping |
| East End | Known for its serene environment and natural beauty, East End is less developed and offers a more authentic experience of the Cayman Islands, perfect for nature lovers and adventure seekers. | Rum Point, Starfish Point, Bioluminescent Bay, Kayaking and water sports, local eateries |
| North Side | Offering secluded beaches and stunning views, North Side is ideal for those looking to experience the quieter side of Grand Cayman. It's great for relaxation and enjoying nature. | Cayman Crystal Caves, Starfish Beach, Chapel Beach, Scuba diving and snorkeling spots, local markets |
| Little Cayman | A peaceful retreat with some of the best diving spots in the Caribbean, Little Cayman is perfect for travelers looking for a secluded island experience with breathtaking natural beauty. | Bloody Bay Marine Park, Oven Rock, the Great Wall dive site, scenic beaches, tropical wildlife |
| Cayman Brac | Known for its rugged cliffs and beautiful diving spots, Cayman Brac offers a unique experience with opportunities for hiking and exploring the natural landscape. It's popular among adventure tourists. | Brac Parrot Reserve, Caves and hiking trails, Diving at the MV Capt. Keith Tibbetts, scenic lookout points |
| South Sound | A residential area that is gaining popularity among visitors, South Sound offers easy access to the beach and local attractions while being close to George Town's amenities. | South Sound Beach, local restaurants, community parks, proximity to George Town, family-friendly activities |
Understanding Airbnb License Requirements & STR Laws in West End (2026)
While West End, Sister Islands, Cayman Islands currently shows low STR regulations, specific Airbnb license requirements might still exist or change. Always verify the latest short term rental regulations and Airbnb license requirements directly with local government authorities for West End to ensure full compliance before hosting.
(Source: AirROI data, 2026, finding no licensed listings among those analyzed)
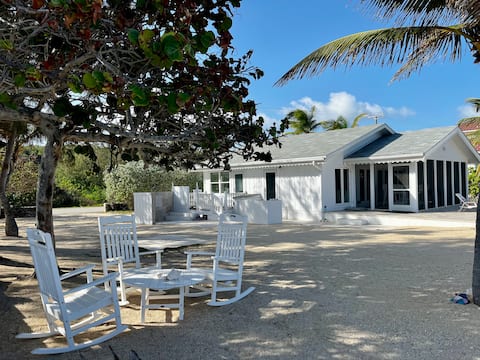
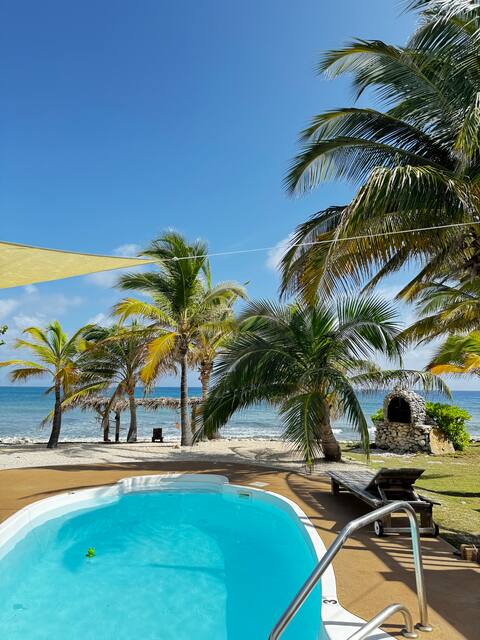
Top Performing Airbnb Properties in West End (2026)
Benchmark your potential! Explore examples of top-performing Airbnb properties in West Endbased on Trailing Twelve Month (TTM) revenue. Analyze their characteristics, revenue, occupancy rate, and ADR to understand what drives success in this market.

5-bdm beachfront villa w/pool, cabana & more
Entire Place • 5 bedrooms

Ocean Odyssey 3-bdr 2.5-bath Beachfront Home
Entire Place • 3 bedrooms
Breezy Bluff Cottage
Entire Place • 2 bedrooms

Southern Exposure, Secluded Paradise, Cayman Brac
Entire Place • 2 bedrooms
1-bdm tropical beach paradise w/pool & more
Entire Place • 1 bedroom

The Sandy Beach Retreat Guest Suite - Sonscape
Entire Place • 1 bedroom
Note: Performance varies based on location, size, amenities, seasonality, and management quality. Data reflects the past 12 months.
Top Performing Airbnb Hosts in West End (2026)
Learn from the best! This table showcases top-performing Airbnb hosts in West End based on the number of properties managed and estimated total revenue over the past year. Analyze their scale and performance metrics.
| Host Name | Properties | Grossing Revenue | Stay Reviews | Avg Rating |
|---|---|---|---|---|
| Henry | 6 | $151,710 | 50 | 4.91/5.0 |
| Krista | 2 | $95,791 | 35 | 4.91/5.0 |
| Julia | 1 | $38,910 | 5 | 5.00/5.0 |
| Jen & Rick | 1 | $36,468 | 89 | 4.81/5.0 |
| Dennis | 1 | $27,950 | 33 | 4.85/5.0 |
| Karen | 1 | $27,655 | 11 | 5.00/5.0 |
| Enrico | 1 | $15,786 | 36 | 4.53/5.0 |
| Ashley | 1 | $15,103 | 55 | 4.73/5.0 |
| Calton | 1 | $14,145 | 22 | 4.82/5.0 |
| Derri | 1 | $14,065 | 6 | 4.50/5.0 |
Analyzing the strategies of top hosts, such as their property selection, pricing, and guest communication, can offer valuable lessons for optimizing your own Airbnb operations in West End.
Dive Deeper: Advanced West End STR Market Data (2026)
Ready to unlock more insights? AirROI provides access to advanced metrics and comprehensive Airbnb data for West End. Explore detailed analytics beyond this report to refine your investment strategy, optimize pricing, and maximize your vacation rental profits.
Explore Advanced MetricsWest End Short-Term Rental Market Composition (2026): Property & Room Types
Room Type Distribution
Property Type Distribution
Market Composition Insights for West End
- The West End Airbnb market composition is heavily skewed towards Entire Home/Apt listings, which make up 100% of the 18 active rentals. This indicates strong guest preference for privacy and space.
- Looking at the property type distribution in West End, House properties are the most common (88.9%), reflecting the local real estate landscape.
- Houses represent a significant 88.9% portion, catering likely to families or larger groups.
- The presence of 5.6% Hotel/Boutique listings indicates integration with traditional hospitality.
West End Airbnb Room Capacity Analysis (2026): Bedroom Distribution
Distribution of Listings by Number of Bedrooms
Room Capacity Insights for West End
- The dominant room capacity in West End is 2 bedrooms listings, making up 33.3% of the market. This suggests a strong demand for properties suitable for couples or solo travelers.
- Together, 2 bedrooms and 1 bedroom properties represent 66.6% of the active Airbnb listings in West End, indicating a high concentration in these sizes.
- A significant 33.4% of listings offer 3+ bedrooms, catering to larger groups and families seeking more space in West End.
West End Vacation Rental Guest Capacity Trends (2026)
Distribution of Listings by Guest Capacity
Guest Capacity Insights for West End
- The most common guest capacity trend in West End vacation rentals is listings accommodating 6 guests (33.3%). This suggests the primary traveler segment is likely larger groups.
- Properties designed for 6 guests and 2 guests dominate the West End STR market, accounting for 50.0% of listings.
- 55.5% of properties accommodate 6+ guests, serving the market segment for larger families or group travel in West End.
- On average, properties in West End are equipped to host 5.2 guests.
West End Airbnb Booking Patterns (2026): Available vs. Booked Days
Available Days Distribution
Booked Days Distribution
Booking Pattern Insights for West End
- The most common availability pattern in West End falls within the 271-366 days range, representing 50% of listings. This suggests many properties have significant open periods on their calendars.
- Approximately 94.4% of listings show high availability (181+ days open annually), indicating potential for increased bookings or specific owner usage patterns.
- For booked days, the 91-180 days range is most frequent in West End (38.9%), reflecting common guest stay durations or potential owner blocking patterns.
- A notable 11.1% of properties secure long booking periods (181+ days booked per year), highlighting successful long-term rental strategies or significant owner usage.
West End Airbnb Minimum Stay Requirements Analysis
Distribution of Listings by Minimum Night Requirement
2 Nights
5 listings
27.8% of total
3 Nights
2 listings
11.1% of total
4-6 Nights
8 listings
44.4% of total
7-29 Nights
2 listings
11.1% of total
30+ Nights
1 listings
5.6% of total
Key Insights
- The most prevalent minimum stay requirement in West End is 4-6 Nights, adopted by 44.4% of listings. This highlights the market's preference for longer commitments.
Recommendations
- Align with the market by considering a 4-6 Nights minimum stay, as 44.4% of West End hosts use this setting.
- Explore offering discounts for stays of 30+ nights to attract the 5.6% of the market seeking extended stays.
- Adjust minimum nights based on seasonality – potentially shorter during low season and longer during peak demand periods in West End.
West End Airbnb Cancellation Policy Trends Analysis (2026)
Limited
2 listings
11.1% of total
Flexible
3 listings
16.7% of total
Moderate
1 listings
5.6% of total
Firm
3 listings
16.7% of total
Strict
9 listings
50% of total
Cancellation Policy Insights for West End
- The prevailing Airbnb cancellation policy trend in West End is Strict, used by 50% of listings.
- A majority (66.7%) of hosts in West End utilize Firm or Strict policies, indicating a market where hosts prioritize booking security.
Recommendations for Hosts
- Consider adopting a Strict policy to align with the 50% market standard in West End.
- With 50% using Strict terms, this is a viable option in West End, particularly for high-value properties or during peak demand periods.
- Regularly review your cancellation policy against competitors and market demand shifts in West End.
West End STR Booking Lead Time Analysis (2026)
Average Booking Lead Time by Month
Booking Lead Time Insights for West End
- The overall average booking lead time for vacation rentals in West End is 74 days.
- Guests book furthest in advance for stays during December (average 144 days), likely coinciding with peak travel demand or local events.
- The shortest booking windows occur for stays in August (average 29 days), indicating more last-minute travel plans during this time.
- Seasonally, Winter (121 days avg.) sees the longest lead times, while Summer (35 days avg.) has the shortest, reflecting typical travel planning cycles.
Recommendations for Hosts
- Use the overall average lead time (74 days) as a baseline for your pricing and availability strategy in West End.
- For December stays, consider implementing length-of-stay discounts or slightly higher rates for bookings made less than 144 days out to capitalize on advance planning.
- Target marketing efforts for the Winter season well in advance (at least 121 days) to capture early planners.
- Monitor your own booking lead times against these West End averages to identify opportunities for dynamic pricing adjustments.
Popular & Essential Airbnb Amenities in West End (2026)
Amenity Prevalence
Amenity Insights for West End
- Essential amenities in West End that guests expect include: Fire extinguisher, TV, Wifi, Air conditioning, Kitchen, Smoke alarm. Lacking these (any) could significantly impact bookings.
- Popular amenities like Beach access, Washer, Essentials are common but not universal. Offering these can provide a competitive edge.
Recommendations for Hosts
- Ensure your listing includes all essential amenities for West End: Fire extinguisher, TV, Wifi, Air conditioning, Kitchen, Smoke alarm.
- Consider adding popular differentiators like Beach access or Washer to increase appeal.
- Highlight unique or less common amenities you offer (e.g., hot tub, dedicated workspace, EV charger) in your listing description and photos.
- Regularly check competitor amenities in West End to stay competitive.
West End Airbnb Guest Demographics & Profile Analysis (2026)
Guest Profile Summary for West End
- The typical guest profile for Airbnb in West End consists of predominantly international visitors (80%), with top international origins including Cayman Islands, typically belonging to the Post-2000s (Gen Z/Alpha) group (50%), primarily speaking English or Spanish.
- Domestic travelers account for 20.0% of guests.
- Key international markets include United States (63.3%) and Cayman Islands (20%).
- Top languages spoken are English (83.3%) followed by Spanish (16.7%).
- A significant demographic segment is the Post-2000s (Gen Z/Alpha) group, representing 50% of guests.
Recommendations for Hosts
- Focus marketing internationally, particularly towards travelers from Cayman Islands.
- Tailor amenities and listing descriptions to appeal to the dominant Post-2000s (Gen Z/Alpha) demographic (e.g., highlight fast WiFi, smart home features, local guides).
- Highlight unique local experiences or amenities relevant to the primary guest profile.
- Consider seasonal promotions aligned with peak travel times for key origin markets.
Nearby Short-Term Rental Market Comparison
How does the West End Airbnb market stack up against its neighbors? Compare key performance metrics like average monthly revenue, ADR, and occupancy rates in surrounding areas to understand the broader regional STR landscape.
| Market | Active Properties | Monthly Revenue | Daily Rate | Avg. Occupancy |
|---|---|---|---|---|
| Head of Bay | 10 | $3,486 | $530.45 | 30% |
| West Bay | 32 | $3,485 | $390.16 | 43% |
| Davis Cove | 16 | $2,715 | $296.78 | 28% |
| West End | 20 | $1,652 | $200.44 | 31% |
| Negril | 427 | $1,269 | $170.36 | 33% |
| Lucea | 61 | $1,057 | $149.53 | 33% |
| Kew | 26 | $993 | $136.19 | 34% |
| Sandy Bay | 17 | $884 | $250.52 | 26% |
| Belmont | 19 | $807 | $109.08 | 28% |
| Elgin Town | 23 | $730 | $127.35 | 30% |