Freire Airbnb Market Analysis 2025: Short Term Rental Data & Vacation Rental Statistics in Araucania Region, Chile
Is Airbnb profitable in Freire in 2025? Explore comprehensive Airbnb analytics for Freire, Araucania Region, Chile to uncover income potential. This 2025 STR market report for Freire, based on AirROI data from June 2024 to May 2025, reveals key trends in the niche market of 19 active listings.
Whether you're considering an Airbnb investment in Freire, optimizing your existing vacation rental, or exploring rental arbitrage opportunities, understanding the Freire Airbnb data is crucial. Understanding the local regulations is key to maximizing your short term rental income potential. Let's dive into the specifics.
Key Freire Airbnb Performance Metrics Overview
Monthly Airbnb Revenue Variations & Income Potential in Freire (2025)
Understanding the monthly revenue variations for Airbnb listings in Freire is key to maximizing your short term rental income potential. Seasonality significantly impacts earnings. Our analysis, based on data from the past 12 months, shows that the peak revenue month for STRs in Freire is typically February, while June often presents the lowest earnings, highlighting opportunities for strategic pricing adjustments during shoulder and low seasons. Explore the typical Airbnb income in Freire across different performance tiers:
- Best-in-class properties (Top 10%) achieve $738+ monthly, often utilizing dynamic pricing and superior guest experiences.
- Strong performing properties (Top 25%) earn $533 or more, indicating effective management and desirable locations/amenities.
- Typical properties (Median) generate around $299 per month, representing the average market performance.
- Entry-level properties (Bottom 25%) see earnings around $163, often with potential for optimization.
Average Monthly Airbnb Earnings Trend in Freire
Freire Airbnb Occupancy Rate Trends (2025)
Maximize your bookings by understanding the Freire STR occupancy trends. Seasonal demand shifts significantly influence how often properties are booked. Typically, Februarysees the highest demand (peak season occupancy), while May experiences the lowest (low season). Effective strategies, like adjusting minimum stays or offering promotions, can boost occupancy during slower periods. Here's how different property tiers perform in Freire:
- Best-in-class properties (Top 10%) achieve 35%+ occupancy, indicating high desirability and potentially optimized availability.
- Strong performing properties (Top 25%) maintain 29% or higher occupancy, suggesting good market fit and guest satisfaction.
- Typical properties (Median) have an occupancy rate around 18%.
- Entry-level properties (Bottom 25%) average 9% occupancy, potentially facing higher vacancy.
Average Monthly Occupancy Rate Trend in Freire
Average Daily Rate (ADR) Airbnb Trends in Freire (2025)
Effective short term rental pricing strategy in Freire involves understanding monthly ADR fluctuations. The Average Daily Rate (ADR) for Airbnb in Freire typically peaks in May and dips lowest during December. Leveraging Airbnb dynamic pricing tools or strategies based on this seasonality can significantly boost revenue. Here's a look at the typical nightly rates achieved:
- Best-in-class properties (Top 10%) command rates of $93+ per night, often due to premium features or locations.
- Strong performing properties (Top 25%) achieve nightly rates of $78 or more.
- Typical properties (Median) charge around $55 per night.
- Entry-level properties (Bottom 25%) earn around $42 per night.
Average Daily Rate (ADR) Trend by Month in Freire
Get Live Freire Market Intelligence 👇

Explore Real-time Analytics
Airbnb Seasonality Analysis & Trends in Freire (2025)
Peak Season (February, January, July)
- Revenue averages $567 per month
- Occupancy rates average 27.9%
- Daily rates average $63
Shoulder Season
- Revenue averages $398 per month
- Occupancy maintains around 21.1%
- Daily rates hold near $63
Low Season (May, June, October)
- Revenue drops to average $180 per month
- Occupancy decreases to average 11.2%
- Daily rates adjust to average $64
Seasonality Insights for Freire
- The Airbnb seasonality in Freire shows highly seasonal trends requiring careful strategy. While the sections above show seasonal averages, it's also insightful to look at the extremes:
- During the high season, the absolute peak month showcases Freire's highest earning potential, with monthly revenues capable of climbing to $688, occupancy reaching a high of 34.2%, and ADRs peaking at $69.
- Conversely, the slowest single month of the year, typically falling within the low season, marks the market's lowest point. In this month, revenue might dip to $101, occupancy could drop to 8.8%, and ADRs may adjust down to $61.
- Understanding both the seasonal averages and these monthly peaks and troughs in revenue, occupancy, and ADR is crucial for maximizing your Airbnb profit potential in Freire.
Seasonal Strategies for Maximizing Profit
- Peak Season: Maximize revenue through premium pricing and potentially longer minimum stays. Ensure high availability.
- Low Season: Offer competitive pricing, special promotions (e.g., extended stay discounts), and flexible cancellation policies. Target off-season travelers like remote workers or budget-conscious guests.
- Shoulder Seasons: Implement dynamic pricing that balances peak and low rates. Target weekend travelers or specific events. Offer slightly more flexible terms than peak season.
- Regularly analyze your own performance against these Freire seasonality benchmarks and adjust your pricing and availability strategy accordingly.
Best Areas for Airbnb Investment in Freire (2025)
Exploring the top neighborhoods for short-term rentals in Freire? This section highlights key areas, outlining why they are attractive for hosts and guests, along with notable local attractions. Consider these locations based on your target guest profile and investment strategy.
| Neighborhood / Area | Why Host Here? (Target Guests & Appeal) | Key Attractions & Landmarks |
|---|---|---|
| Lake Villarrica | A picturesque lake surrounded by stunning volcanoes and lush nature. A great destination for outdoor enthusiasts and water sports lovers, making it a desirable spot for tourists year-round. | Villarrica National Park, Lake Villarrica, Volcán Villarrica, Termas Geométricas, Pucón beach |
| Pucón | A charming town famous for its adventure tourism, including hiking, skiing, and hot springs. Its vibrant atmosphere and natural beauty attract a variety of tourists seeking relaxation and thrill. | Pucón Ski Resort, Cascadas de Río Turbio, Termas Los Pozones, Playa Grande, Cerro Viejo |
| Cajón de Maipo | Known for its stunning landscapes and opportunities for outdoor activities like hiking and rafting. A favorite getaway for those looking to escape the city. | Embalse El Yeso, Cerro La Campana, Baños Colina, Pueblo de San José de Maipo, Lago Los Molinos |
| Conguillio National Park | A national park renowned for its diverse ecosystems and beautiful araucaria trees. Ideal for nature lovers and hikers seeking stunning views and tranquility. | Lago Conguillio, Volcán Llaima, Araucaria forests, Hiking trails, Flora and fauna watching |
| Temuco | The capital of the Araucanía region, offering urban amenities and cultural attractions. A good investment for those catering to business and touring visitors. | Pablo Neruda Museum, Temuco Municipal Market, Museo Regional IX, Parque Urbano, Lake Temuco |
| Villarrica | A vibrant town famous for its outdoor activities and proximity to Villarrica Volcano and Lake. Heavy tourist traffic from both adventure seekers and families. | Villarrica Volcano, Lake Villarrica, Playa Blanca, Museo Histórico, Parque Pino Huacho |
| Loncoche | A smaller town with access to natural wonders and regional parks. Increasingly popular with visitors seeking an authentic Chilean experience. | Lago Loncoche, Cerro La Bandera, Hiking trails, Rural tourism, Cultural experiences |
| Malleco | An area of stunning landscapes with opportunities for nature tourism and adventure sports. Ideal for those looking to escape to nature. | Cascada del Saltillo, Parque Nacional Nahuelbuta, Cerro Colorado, Río Malleco, Cultural attractions in local villages |
Understanding Airbnb License Requirements & STR Laws in Freire (2025)
With 26% of listings showing registration in 2025, understanding potential Airbnb license requirements is crucial in Freire. Always verify the latest short term rental regulations and Airbnb license requirements directly with local government authorities for Freire to ensure full compliance before hosting.
(Source: AirROI data, 2025, based on 26% licensed listings)
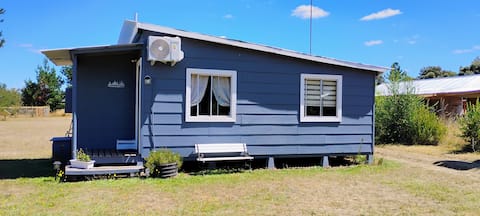
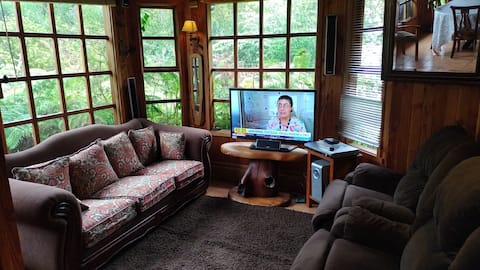
Top Performing Airbnb Properties in Freire (2025)
Benchmark your potential! Explore examples of top-performing Airbnb properties in Freirebased on Trailing Twelve Month (TTM) revenue. Analyze their characteristics, revenue, occupancy rate, and ADR to understand what drives success in this market.

Tranquila cabaña en sector rural
Entire Place • 2 bedrooms
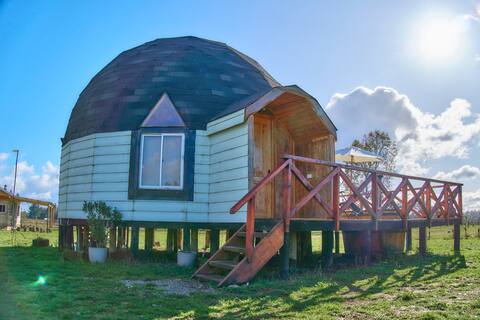
Dome with hot jar 18 k from Freire.
Entire Place • 2 bedrooms
Los Maitenes Cabins (1)
Entire Place • 1 bedroom

Cabin, Freire, Allipén, N3
Entire Place • 3 bedrooms

Hermosa cabaña Entre Ríos con vista a los volcanes
Entire Place • 3 bedrooms
Cabañas Confortables Pétalos
Entire Place • 1 bedroom
Note: Performance varies based on location, size, amenities, seasonality, and management quality. Data reflects the past 12 months.
Top Performing Airbnb Hosts in Freire (2025)
Learn from the best! This table showcases top-performing Airbnb hosts in Freire based on the number of properties managed and estimated total revenue over the past year. Analyze their scale and performance metrics.
| Host Name | Properties | Grossing Revenue | Stay Reviews | Avg Rating |
|---|---|---|---|---|
| Javier | 4 | $9,222 | 28 | 4.94/5.0 |
| Host #173415751 | 1 | $6,885 | 0 | Not Rated |
| Juan | 1 | $6,496 | 30 | 5.00/5.0 |
| Camila | 3 | $6,351 | 3 | 5.00/5.0 |
| Hostal Quimey Ruca | 4 | $5,669 | 3 | Not Rated |
| Host #501524093 | 1 | $2,849 | 1 | Not Rated |
| Host #481675430 | 1 | $2,588 | 0 | Not Rated |
| Host #548103717 | 1 | $1,976 | 0 | Not Rated |
| Host #485848083 | 1 | $1,072 | 0 | Not Rated |
| Sebastian | 1 | $320 | 31 | 4.77/5.0 |
Analyzing the strategies of top hosts, such as their property selection, pricing, and guest communication, can offer valuable lessons for optimizing your own Airbnb operations in Freire.
Dive Deeper: Advanced Freire STR Market Data (2025)
Ready to unlock more insights? AirROI provides access to advanced metrics and comprehensive Airbnb data for Freire. Explore detailed analytics beyond this report to refine your investment strategy, optimize pricing, and maximize your vacation rental profits.
Explore Advanced MetricsFreire Short-Term Rental Market Composition (2025): Property & Room Types
Room Type Distribution
Property Type Distribution
Market Composition Insights for Freire
- The Freire Airbnb market composition is heavily skewed towards Entire Home/Apt listings, which make up 73.7% of the 19 active rentals. This indicates strong guest preference for privacy and space.
- Looking at the property type distribution in Freire, Outdoor/Unique properties are the most common (52.6%), reflecting the local real estate landscape.
- Houses represent a significant 26.3% portion, catering likely to families or larger groups.
- The presence of 10.5% Hotel/Boutique listings indicates integration with traditional hospitality.
Freire Airbnb Room Capacity Analysis (2025): Bedroom Distribution
Distribution of Listings by Number of Bedrooms
Room Capacity Insights for Freire
- The dominant room capacity in Freire is 2 bedrooms listings, making up 31.6% of the market. This suggests a strong demand for properties suitable for couples or solo travelers.
- Together, 2 bedrooms and 1 bedroom properties represent 57.9% of the active Airbnb listings in Freire, indicating a high concentration in these sizes.
- A significant 26.3% of listings offer 3+ bedrooms, catering to larger groups and families seeking more space in Freire.
Freire Vacation Rental Guest Capacity Trends (2025)
Distribution of Listings by Guest Capacity
Guest Capacity Insights for Freire
- The most common guest capacity trend in Freire vacation rentals is listings accommodating 6 guests (31.6%). This suggests the primary traveler segment is likely larger groups.
- Properties designed for 6 guests and 2 guests dominate the Freire STR market, accounting for 57.9% of listings.
- 31.6% of properties accommodate 6+ guests, serving the market segment for larger families or group travel in Freire.
- On average, properties in Freire are equipped to host 3.6 guests.
Freire Airbnb Booking Patterns (2025): Available vs. Booked Days
Available Days Distribution
Booked Days Distribution
Booking Pattern Insights for Freire
- The most common availability pattern in Freire falls within the 271-366 days range, representing 89.5% of listings. This suggests many properties have significant open periods on their calendars.
- Approximately 100.0% of listings show high availability (181+ days open annually), indicating potential for increased bookings or specific owner usage patterns.
- For booked days, the 1-30 days range is most frequent in Freire (47.4%), reflecting common guest stay durations or potential owner blocking patterns.
Freire Airbnb Minimum Stay Requirements Analysis
Distribution of Listings by Minimum Night Requirement
1 Night
16 listings
84.2% of total
2 Nights
2 listings
10.5% of total
30+ Nights
1 listings
5.3% of total
Key Insights
- The most prevalent minimum stay requirement in Freire is 1 Night, adopted by 84.2% of listings. This highlights the market's preference for shorter, flexible bookings.
- A strong majority (94.7%) of the Freire Airbnb data shows acceptance of very short stays (1-2 nights), indicating a dynamic, high-turnover market.
Recommendations
- Align with the market by considering a 1 Night minimum stay, as 84.2% of Freire hosts use this setting.
- Explore offering discounts for stays of 30+ nights to attract the 5.3% of the market seeking extended stays.
- Adjust minimum nights based on seasonality – potentially shorter during low season and longer during peak demand periods in Freire.
Freire Airbnb Cancellation Policy Trends Analysis (2025)
Flexible
16 listings
100% of total
Cancellation Policy Insights for Freire
- The prevailing Airbnb cancellation policy trend in Freire is Flexible, used by 100% of listings.
- The market strongly favors guest-friendly terms, with 100.0% of listings offering Flexible or Moderate policies. This suggests guests in Freire may expect booking flexibility.
Recommendations for Hosts
- Consider adopting a Flexible policy to align with the 100% market standard in Freire.
- Given the high prevalence of Flexible policies (100%), offering this can enhance booking appeal, especially during shoulder seasons.
- Regularly review your cancellation policy against competitors and market demand shifts in Freire.
Freire STR Booking Lead Time Analysis (2025)
Average Booking Lead Time by Month
Booking Lead Time Insights for Freire
- The overall average booking lead time for vacation rentals in Freire is 13 days.
- Guests book furthest in advance for stays during October (average 34 days), likely coinciding with peak travel demand or local events.
- The shortest booking windows occur for stays in June (average 1 days), indicating more last-minute travel plans during this time.
- Seasonally, Fall (28 days avg.) sees the longest lead times, while Summer (2 days avg.) has the shortest, reflecting typical travel planning cycles.
Recommendations for Hosts
- Use the overall average lead time (13 days) as a baseline for your pricing and availability strategy in Freire.
- For October stays, consider implementing length-of-stay discounts or slightly higher rates for bookings made less than 34 days out to capitalize on advance planning.
- During June, focus on last-minute booking availability and promotions, as guests book with very short notice (1 days avg.).
- Target marketing efforts for the Fall season well in advance (at least 28 days) to capture early planners.
- Monitor your own booking lead times against these Freire averages to identify opportunities for dynamic pricing adjustments.
Popular & Essential Airbnb Amenities in Freire (2025)
Amenity Prevalence
Amenity Insights for Freire
- Popular amenities like TV, Free parking on premises, Kitchen are common but not universal. Offering these can provide a competitive edge.
- Warning: Wifi is not universally provided but is considered essential globally. Ensure reliable Wifi is offered.
Recommendations for Hosts
- Consider adding popular differentiators like TV or Free parking on premises to increase appeal.
- Highlight unique or less common amenities you offer (e.g., hot tub, dedicated workspace, EV charger) in your listing description and photos.
- Regularly check competitor amenities in Freire to stay competitive.
Freire Airbnb Guest Demographics & Profile Analysis (2025)
Guest Profile Summary for Freire
- The typical guest profile for Airbnb in Freire consists of primarily domestic travelers (87%), often arriving from nearby Santiago, typically belonging to the Post-2000s (Gen Z/Alpha) group (50%), primarily speaking Spanish or English.
- Domestic travelers account for 86.7% of guests.
- Key international markets include Chile (86.7%) and Germany (3.3%).
- Top languages spoken are Spanish (55.6%) followed by English (25.9%).
- A significant demographic segment is the Post-2000s (Gen Z/Alpha) group, representing 50% of guests.
Recommendations for Hosts
- Target domestic marketing efforts towards travelers from Santiago and Ancud.
- Tailor amenities and listing descriptions to appeal to the dominant Post-2000s (Gen Z/Alpha) demographic (e.g., highlight fast WiFi, smart home features, local guides).
- Highlight unique local experiences or amenities relevant to the primary guest profile.
- Consider seasonal promotions aligned with peak travel times for key origin markets.
Nearby Short-Term Rental Market Comparison
How does the Freire Airbnb market stack up against its neighbors? Compare key performance metrics like average monthly revenue, ADR, and occupancy rates in surrounding areas to understand the broader regional STR landscape.
| Market | Active Properties | Monthly Revenue | Daily Rate | Avg. Occupancy |
|---|---|---|---|---|
| Villa Pehuenia | 19 | $822 | $109.84 | 36% |
| Vilcún | 12 | $791 | $137.73 | 24% |
| Candelaria | 15 | $685 | $118.88 | 39% |
| Pucon | 43 | $648 | $110.79 | 32% |
| Curacautín | 347 | $601 | $151.18 | 25% |
| Municipio de Caviahue - Copahue | 21 | $566 | $119.13 | 25% |
| Santa Bárbara | 28 | $533 | $104.89 | 30% |
| Pucón | 2,268 | $525 | $101.43 | 35% |
| Panguipulli | 622 | $512 | $94.94 | 33% |
| Los Lagos | 44 | $464 | $112.55 | 27% |