Cañete Airbnb Market Analysis 2026: Short Term Rental Data & Vacation Rental Statistics in Biobio Region, Chile
Is Airbnb profitable in Cañete in 2026? Explore comprehensive Airbnb analytics for Cañete, Biobio Region, Chile to uncover income potential. This 2026 STR market report for Cañete, based on AirROI data from February 2025 to January 2026, reveals key trends in the niche market of 20 active listings.
Whether you're considering an Airbnb investment in Cañete, optimizing your existing vacation rental, or exploring rental arbitrage opportunities, understanding the Cañete Airbnb data is crucial. Leveraging the low regulation environment is key to maximizing your short term rental income potential. Let's dive into the specifics.
Key Cañete Airbnb Performance Metrics Overview
Monthly Airbnb Revenue Variations & Income Potential in Cañete (2026)
Understanding the monthly revenue variations for Airbnb listings in Cañete is key to maximizing your short term rental income potential. Seasonality significantly impacts earnings. Our analysis, based on data from the past 12 months, shows that the peak revenue month for STRs in Cañete is typically February, while July often presents the lowest earnings, highlighting opportunities for strategic pricing adjustments during shoulder and low seasons. Explore the typical Airbnb income in Cañete across different performance tiers:
- Best-in-class properties (Top 10%) achieve $1,427+ monthly, often utilizing dynamic pricing and superior guest experiences.
- Strong performing properties (Top 25%) earn $882 or more, indicating effective management and desirable locations/amenities.
- Typical properties (Median) generate around $421 per month, representing the average market performance.
- Entry-level properties (Bottom 25%) see earnings around $219, often with potential for optimization.
Average Monthly Airbnb Earnings Trend in Cañete
Cañete Airbnb Occupancy Rate Trends (2026)
Maximize your bookings by understanding the Cañete STR occupancy trends. Seasonal demand shifts significantly influence how often properties are booked. Typically, Februarysees the highest demand (peak season occupancy), while September experiences the lowest (low season). Effective strategies, like adjusting minimum stays or offering promotions, can boost occupancy during slower periods. Here's how different property tiers perform in Cañete:
- Best-in-class properties (Top 10%) achieve 51%+ occupancy, indicating high desirability and potentially optimized availability.
- Strong performing properties (Top 25%) maintain 32% or higher occupancy, suggesting good market fit and guest satisfaction.
- Typical properties (Median) have an occupancy rate around 18%.
- Entry-level properties (Bottom 25%) average 10% occupancy, potentially facing higher vacancy.
Average Monthly Occupancy Rate Trend in Cañete
Average Daily Rate (ADR) Airbnb Trends in Cañete (2026)
Effective short term rental pricing strategy in Cañete involves understanding monthly ADR fluctuations. The Average Daily Rate (ADR) for Airbnb in Cañete typically peaks in January and dips lowest during March. Leveraging Airbnb dynamic pricing tools or strategies based on this seasonality can significantly boost revenue. Here's a look at the typical nightly rates achieved:
- Best-in-class properties (Top 10%) command rates of $154+ per night, often due to premium features or locations.
- Strong performing properties (Top 25%) achieve nightly rates of $108 or more.
- Typical properties (Median) charge around $89 per night.
- Entry-level properties (Bottom 25%) earn around $57 per night.
Average Daily Rate (ADR) Trend by Month in Cañete
Get Live Cañete Market Intelligence 👇

Explore Real-time Analytics
Airbnb Seasonality Analysis & Trends in Cañete (2026)
Peak Season (February, January, March)
- Revenue averages $1,251 per month
- Occupancy rates average 32.9%
- Daily rates average $94
Shoulder Season
- Revenue averages $495 per month
- Occupancy maintains around 24.4%
- Daily rates hold near $90
Low Season (July, September, November)
- Revenue drops to average $323 per month
- Occupancy decreases to average 15.2%
- Daily rates adjust to average $91
Seasonality Insights for Cañete
- The Airbnb seasonality in Cañete shows highly seasonal trends requiring careful strategy. While the sections above show seasonal averages, it's also insightful to look at the extremes:
- During the high season, the absolute peak month showcases Cañete's highest earning potential, with monthly revenues capable of climbing to $2,130, occupancy reaching a high of 59.9%, and ADRs peaking at $99.
- Conversely, the slowest single month of the year, typically falling within the low season, marks the market's lowest point. In this month, revenue might dip to $294, occupancy could drop to 14.8%, and ADRs may adjust down to $89.
- Understanding both the seasonal averages and these monthly peaks and troughs in revenue, occupancy, and ADR is crucial for maximizing your Airbnb profit potential in Cañete.
Seasonal Strategies for Maximizing Profit
- Peak Season: Maximize revenue through premium pricing and potentially longer minimum stays. Ensure high availability.
- Low Season: Offer competitive pricing, special promotions (e.g., extended stay discounts), and flexible cancellation policies. Target off-season travelers like remote workers or budget-conscious guests.
- Shoulder Seasons: Implement dynamic pricing that balances peak and low rates. Target weekend travelers or specific events. Offer slightly more flexible terms than peak season.
- Regularly analyze your own performance against these Cañete seasonality benchmarks and adjust your pricing and availability strategy accordingly.
Best Areas for Airbnb Investment in Cañete (2026)
Exploring the top neighborhoods for short-term rentals in Cañete? This section highlights key areas, outlining why they are attractive for hosts and guests, along with notable local attractions. Consider these locations based on your target guest profile and investment strategy.
| Neighborhood / Area | Why Host Here? (Target Guests & Appeal) | Key Attractions & Landmarks |
|---|---|---|
| Péncoa | A charming small town known for its beautiful natural landscapes and proximity to Lago Laja. Ideal for nature lovers and those looking for a peaceful retreat. | Lago Laja, Cerro La Vieja, Péncoa River, Chorombo Bridge, local craft markets |
| Cañete | The main city in the region, offering a blend of cultural heritage and modern amenities. Close to various attractions and a convenient base for exploring. | Cañete Castle, Museo Mapuche, Cañete River, Plaza de Armas, Cultural events and festivals |
| Lake Laja | A picturesque area known for its stunning lake and recreational activities. A popular spot for water sports and camping. | Laja River, Laja Waterfall, camping sites, hiking trails, scenic picnic areas |
| Cerro San Sebastián | A unique location offering panoramic views of the Biobío region. Great for tourists interested in hiking and nature exploration. | Hiking trails, scenic viewpoints, wildlife watching, picnic areas, local flora and fauna |
| Ranquil | Known for its rich agricultural history and beautiful countryside. Attracts those interested in rural tourism and agriculture. | local farms, agritourism experiences, traditional food markets, community festivals, nature walks |
| Pelluhue | A coastal town offering a relaxing beach vibe, perfect for summer getaways. Popular for beach activities and seafood cuisine. | beaches, surfing spots, seafood restaurants, cliff views, local artisanal shops |
| Contulmo | A tranquil area surrounded by nature, ideal for those looking to escape the city and enjoy a serene environment. | Contulmo Lake, hiking excursions, bird watching, community gardens, oferta cultural local |
| Quilaco | A hidden gem in the Biobío region with pristine nature and a focus on sustainable tourism. Attracts eco-tourists and adventurers. | nature reserves, trekking routes, local artisans, cultural heritage sites, wildlife |
Understanding Airbnb License Requirements & STR Laws in Cañete (2026)
While Cañete, Biobio Region, Chile currently shows low STR regulations, specific Airbnb license requirements might still exist or change. Always verify the latest short term rental regulations and Airbnb license requirements directly with local government authorities for Cañete to ensure full compliance before hosting.
(Source: AirROI data, 2026, based on 5% licensed listings)
Top Performing Airbnb Properties in Cañete (2026)
Benchmark your potential! Explore examples of top-performing Airbnb properties in Cañetebased on Trailing Twelve Month (TTM) revenue. Analyze their characteristics, revenue, occupancy rate, and ADR to understand what drives success in this market.

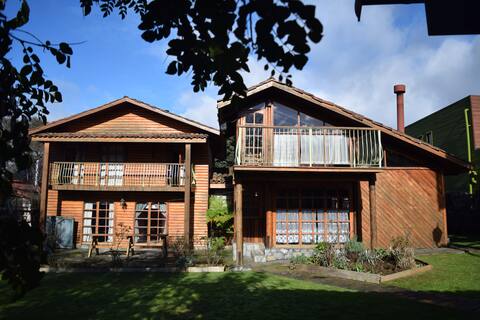
Lake Shore House with Pool
Entire Place • 6 bedrooms
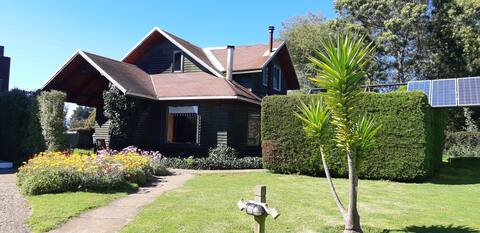
Casona Antulafquen Lake Lanalhue
Entire Place • 8 bedrooms
cabin for 10 people
Entire Place • 4 bedrooms
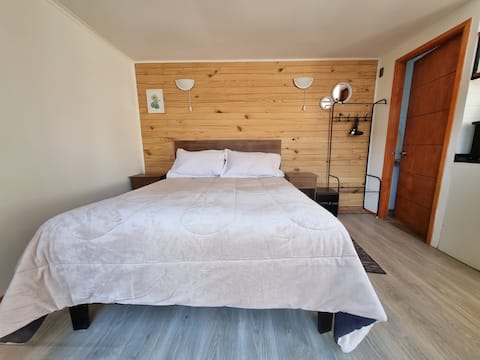
Double cabin for 2 people with tinaja included
Entire Place • 1 bedroom
Lake House
Entire Place • 3 bedrooms
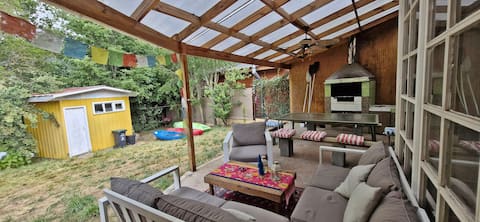
Cosy room close to Lake Lanalhue - breakfast incl
Private Room • N/A
Note: Performance varies based on location, size, amenities, seasonality, and management quality. Data reflects the past 12 months.
Top Performing Airbnb Hosts in Cañete (2026)
Learn from the best! This table showcases top-performing Airbnb hosts in Cañete based on the number of properties managed and estimated total revenue over the past year. Analyze their scale and performance metrics.
| Host Name | Properties | Grossing Revenue | Stay Reviews | Avg Rating |
|---|---|---|---|---|
| Tatiana | 4 | $18,880 | 62 | 4.72/5.0 |
| Francisca | 1 | $15,834 | 18 | 4.83/5.0 |
| Alejandro | 1 | $11,310 | 14 | 5.00/5.0 |
| Cabañas | 1 | $8,824 | 83 | 4.96/5.0 |
| Pablo | 3 | $6,002 | 29 | 4.58/5.0 |
| Patricia | 1 | $5,534 | 19 | 4.84/5.0 |
| Refugio Encantado | 2 | $4,980 | 90 | 4.88/5.0 |
| Celeste | 1 | $4,603 | 64 | 4.73/5.0 |
| Sady | 1 | $1,792 | 10 | 5.00/5.0 |
| Maria Alicia | 1 | $888 | 40 | 4.60/5.0 |
Analyzing the strategies of top hosts, such as their property selection, pricing, and guest communication, can offer valuable lessons for optimizing your own Airbnb operations in Cañete.
Dive Deeper: Advanced Cañete STR Market Data (2026)
Ready to unlock more insights? AirROI provides access to advanced metrics and comprehensive Airbnb data for Cañete. Explore detailed analytics beyond this report to refine your investment strategy, optimize pricing, and maximize your vacation rental profits.
Explore Advanced MetricsCañete Short-Term Rental Market Composition (2026): Property & Room Types
Room Type Distribution
Property Type Distribution
Market Composition Insights for Cañete
- The Cañete Airbnb market composition is heavily skewed towards Entire Home/Apt listings, which make up 80% of the 20 active rentals. This indicates strong guest preference for privacy and space.
- Looking at the property type distribution in Cañete, Outdoor/Unique properties are the most common (40%), reflecting the local real estate landscape.
- Houses represent a significant 35% portion, catering likely to families or larger groups.
- The presence of 10% Hotel/Boutique listings indicates integration with traditional hospitality.
Cañete Airbnb Room Capacity Analysis (2026): Bedroom Distribution
Distribution of Listings by Number of Bedrooms
Room Capacity Insights for Cañete
- The dominant room capacity in Cañete is 1 bedroom listings, making up 40% of the market. This suggests a strong demand for properties suitable for couples or solo travelers.
- Together, 1 bedroom and 3 bedrooms properties represent 55.0% of the active Airbnb listings in Cañete, indicating a high concentration in these sizes.
- A significant 30.0% of listings offer 3+ bedrooms, catering to larger groups and families seeking more space in Cañete.
Cañete Vacation Rental Guest Capacity Trends (2026)
Distribution of Listings by Guest Capacity
Guest Capacity Insights for Cañete
- The most common guest capacity trend in Cañete vacation rentals is listings accommodating 8+ guests (30%). This suggests the primary traveler segment is likely larger groups.
- Properties designed for 8+ guests and 2 guests dominate the Cañete STR market, accounting for 60.0% of listings.
- 35.0% of properties accommodate 6+ guests, serving the market segment for larger families or group travel in Cañete.
- On average, properties in Cañete are equipped to host 4.1 guests.
Cañete Airbnb Booking Patterns (2026): Available vs. Booked Days
Available Days Distribution
Booked Days Distribution
Booking Pattern Insights for Cañete
- The most common availability pattern in Cañete falls within the 271-366 days range, representing 90% of listings. This suggests many properties have significant open periods on their calendars.
- Approximately 100.0% of listings show high availability (181+ days open annually), indicating potential for increased bookings or specific owner usage patterns.
- For booked days, the 1-30 days range is most frequent in Cañete (50%), reflecting common guest stay durations or potential owner blocking patterns.
Cañete Airbnb Minimum Stay Requirements Analysis
Distribution of Listings by Minimum Night Requirement
1 Night
8 listings
40% of total
2 Nights
4 listings
20% of total
30+ Nights
8 listings
40% of total
Key Insights
- The most prevalent minimum stay requirement in Cañete is 1 Night, adopted by 40% of listings. This highlights the market's preference for shorter, flexible bookings.
- A significant segment (40%) caters to monthly stays (30+ nights) in Cañete, pointing to opportunities in the extended-stay market.
Recommendations
- Align with the market by considering a 1 Night minimum stay, as 40% of Cañete hosts use this setting.
- Explore offering discounts for stays of 30+ nights to attract the 40% of the market seeking extended stays.
- Adjust minimum nights based on seasonality – potentially shorter during low season and longer during peak demand periods in Cañete.
Cañete Airbnb Cancellation Policy Trends Analysis (2026)
Flexible
12 listings
60% of total
Moderate
1 listings
5% of total
Firm
7 listings
35% of total
Cancellation Policy Insights for Cañete
- The prevailing Airbnb cancellation policy trend in Cañete is Flexible, used by 60% of listings.
- There's a relatively balanced mix between guest-friendly (65.0%) and stricter (35.0%) policies, offering choices for different guest needs.
Recommendations for Hosts
- Consider adopting a Flexible policy to align with the 60% market standard in Cañete.
- Given the high prevalence of Flexible policies (60%), offering this can enhance booking appeal, especially during shoulder seasons.
- Regularly review your cancellation policy against competitors and market demand shifts in Cañete.
Cañete STR Booking Lead Time Analysis (2026)
Average Booking Lead Time by Month
Booking Lead Time Insights for Cañete
- The overall average booking lead time for vacation rentals in Cañete is 16 days.
- Guests book furthest in advance for stays during March (average 22 days), likely coinciding with peak travel demand or local events.
- The shortest booking windows occur for stays in August (average 3 days), indicating more last-minute travel plans during this time.
- Seasonally, Winter (19 days avg.) sees the longest lead times, while Summer (10 days avg.) has the shortest, reflecting typical travel planning cycles.
Recommendations for Hosts
- Use the overall average lead time (16 days) as a baseline for your pricing and availability strategy in Cañete.
- During August, focus on last-minute booking availability and promotions, as guests book with very short notice (3 days avg.).
- Target marketing efforts for the Winter season well in advance (at least 19 days) to capture early planners.
- Monitor your own booking lead times against these Cañete averages to identify opportunities for dynamic pricing adjustments.
Popular & Essential Airbnb Amenities in Cañete (2026)
Amenity Prevalence
Amenity Insights for Cañete
- Popular amenities like Free parking on premises, Dishes and silverware, Hot water are common but not universal. Offering these can provide a competitive edge.
Recommendations for Hosts
- Consider adding popular differentiators like Free parking on premises or Dishes and silverware to increase appeal.
- Highlight unique or less common amenities you offer (e.g., hot tub, dedicated workspace, EV charger) in your listing description and photos.
- Regularly check competitor amenities in Cañete to stay competitive.
Cañete Airbnb Guest Demographics & Profile Analysis (2026)
Guest Profile Summary for Cañete
- The typical guest profile for Airbnb in Cañete consists of primarily domestic travelers (98%), often arriving from nearby Concepción, typically belonging to the Post-2000s (Gen Z/Alpha) group (50%), primarily speaking Spanish or English.
- Domestic travelers account for 97.6% of guests.
- Key international markets include Chile (97.6%) and France (2.4%).
- Top languages spoken are Spanish (70.8%) followed by English (29.2%).
- A significant demographic segment is the Post-2000s (Gen Z/Alpha) group, representing 50% of guests.
Recommendations for Hosts
- Target domestic marketing efforts towards travelers from Concepción and Santiago.
- Tailor amenities and listing descriptions to appeal to the dominant Post-2000s (Gen Z/Alpha) demographic (e.g., highlight fast WiFi, smart home features, local guides).
- Highlight unique local experiences or amenities relevant to the primary guest profile.
- Consider seasonal promotions aligned with peak travel times for key origin markets.
Nearby Short-Term Rental Market Comparison
How does the Cañete Airbnb market stack up against its neighbors? Compare key performance metrics like average monthly revenue, ADR, and occupancy rates in surrounding areas to understand the broader regional STR landscape.
| Market | Active Properties | Monthly Revenue | Daily Rate | Avg. Occupancy |
|---|---|---|---|---|
| Cabrero | 19 | $498 | $73.98 | 31% |
| Tomé | 211 | $496 | $100.25 | 28% |
| Vilcún | 13 | $481 | $87.68 | 24% |
| Talcahuano | 57 | $458 | $54.78 | 39% |
| Concepcion | 611 | $421 | $52.55 | 35% |
| San Pedro de la Paz | 74 | $402 | $66.23 | 29% |
| Quillón | 78 | $397 | $118.27 | 23% |
| Bulnes | 24 | $394 | $117.24 | 24% |
| Cobquecura | 132 | $381 | $92.55 | 26% |
| Chillán | 208 | $354 | $63.04 | 30% |