Dalcahue Airbnb Market Analysis 2026: Short Term Rental Data & Vacation Rental Statistics in Los Lagos Region, Chile
Is Airbnb profitable in Dalcahue in 2026? Explore comprehensive Airbnb analytics for Dalcahue, Los Lagos Region, Chile to uncover income potential. This 2026 STR market report for Dalcahue, based on AirROI data from February 2025 to January 2026, reveals key trends in the niche market of 103 active listings.
Whether you're considering an Airbnb investment in Dalcahue, optimizing your existing vacation rental, or exploring rental arbitrage opportunities, understanding the Dalcahue Airbnb data is crucial. Leveraging the low regulation environment is key to maximizing your short term rental income potential. Let's dive into the specifics.
Key Dalcahue Airbnb Performance Metrics Overview
Monthly Airbnb Revenue Variations & Income Potential in Dalcahue (2026)
Understanding the monthly revenue variations for Airbnb listings in Dalcahue is key to maximizing your short term rental income potential. Seasonality significantly impacts earnings. Our analysis, based on data from the past 12 months, shows that the peak revenue month for STRs in Dalcahue is typically February, while May often presents the lowest earnings, highlighting opportunities for strategic pricing adjustments during shoulder and low seasons. Explore the typical Airbnb income in Dalcahue across different performance tiers:
- Best-in-class properties (Top 10%) achieve $1,231+ monthly, often utilizing dynamic pricing and superior guest experiences.
- Strong performing properties (Top 25%) earn $740 or more, indicating effective management and desirable locations/amenities.
- Typical properties (Median) generate around $326 per month, representing the average market performance.
- Entry-level properties (Bottom 25%) see earnings around $147, often with potential for optimization.
Average Monthly Airbnb Earnings Trend in Dalcahue
Dalcahue Airbnb Occupancy Rate Trends (2026)
Maximize your bookings by understanding the Dalcahue STR occupancy trends. Seasonal demand shifts significantly influence how often properties are booked. Typically, Februarysees the highest demand (peak season occupancy), while August experiences the lowest (low season). Effective strategies, like adjusting minimum stays or offering promotions, can boost occupancy during slower periods. Here's how different property tiers perform in Dalcahue:
- Best-in-class properties (Top 10%) achieve 54%+ occupancy, indicating high desirability and potentially optimized availability.
- Strong performing properties (Top 25%) maintain 36% or higher occupancy, suggesting good market fit and guest satisfaction.
- Typical properties (Median) have an occupancy rate around 19%.
- Entry-level properties (Bottom 25%) average 10% occupancy, potentially facing higher vacancy.
Average Monthly Occupancy Rate Trend in Dalcahue
Average Daily Rate (ADR) Airbnb Trends in Dalcahue (2026)
Effective short term rental pricing strategy in Dalcahue involves understanding monthly ADR fluctuations. The Average Daily Rate (ADR) for Airbnb in Dalcahue typically peaks in January and dips lowest during March. Leveraging Airbnb dynamic pricing tools or strategies based on this seasonality can significantly boost revenue. Here's a look at the typical nightly rates achieved:
- Best-in-class properties (Top 10%) command rates of $97+ per night, often due to premium features or locations.
- Strong performing properties (Top 25%) achieve nightly rates of $69 or more.
- Typical properties (Median) charge around $54 per night.
- Entry-level properties (Bottom 25%) earn around $43 per night.
Average Daily Rate (ADR) Trend by Month in Dalcahue
Get Live Dalcahue Market Intelligence 👇

Explore Real-time Analytics
Airbnb Seasonality Analysis & Trends in Dalcahue (2026)
Peak Season (February, January, December)
- Revenue averages $746 per month
- Occupancy rates average 36.3%
- Daily rates average $62
Shoulder Season
- Revenue averages $484 per month
- Occupancy maintains around 25.0%
- Daily rates hold near $60
Low Season (May, August, October)
- Revenue drops to average $366 per month
- Occupancy decreases to average 17.6%
- Daily rates adjust to average $60
Seasonality Insights for Dalcahue
- The Airbnb seasonality in Dalcahue shows highly seasonal trends requiring careful strategy. While the sections above show seasonal averages, it's also insightful to look at the extremes:
- During the high season, the absolute peak month showcases Dalcahue's highest earning potential, with monthly revenues capable of climbing to $938, occupancy reaching a high of 55.6%, and ADRs peaking at $64.
- Conversely, the slowest single month of the year, typically falling within the low season, marks the market's lowest point. In this month, revenue might dip to $344, occupancy could drop to 14.4%, and ADRs may adjust down to $59.
- Understanding both the seasonal averages and these monthly peaks and troughs in revenue, occupancy, and ADR is crucial for maximizing your Airbnb profit potential in Dalcahue.
Seasonal Strategies for Maximizing Profit
- Peak Season: Maximize revenue through premium pricing and potentially longer minimum stays. Ensure high availability.
- Low Season: Offer competitive pricing, special promotions (e.g., extended stay discounts), and flexible cancellation policies. Target off-season travelers like remote workers or budget-conscious guests.
- Shoulder Seasons: Implement dynamic pricing that balances peak and low rates. Target weekend travelers or specific events. Offer slightly more flexible terms than peak season.
- Regularly analyze your own performance against these Dalcahue seasonality benchmarks and adjust your pricing and availability strategy accordingly.
Best Areas for Airbnb Investment in Dalcahue (2026)
Exploring the top neighborhoods for short-term rentals in Dalcahue? This section highlights key areas, outlining why they are attractive for hosts and guests, along with notable local attractions. Consider these locations based on your target guest profile and investment strategy.
| Neighborhood / Area | Why Host Here? (Target Guests & Appeal) | Key Attractions & Landmarks |
|---|---|---|
| Dalcahue Town Center | The heart of Dalcahue with access to local culture, shops, and restaurants. It's a popular spot for tourists who want to experience the local lifestyle and arts. | Church of Dalcahue, Dalcahue Market, Museo Historico de Dalcahue, Feria Artesanal Dalcahue, Dalcahue Pier |
| Quinchao Island | A beautiful island near Dalcahue with stunning landscapes and rich cultural heritage. It'll attract nature lovers and those seeking tranquility away from the mainland. | Quinchao Church, Cochamó Beach, Local artisan markets, Island hiking trails, Traditional Chilean cuisine |
| Achao | Known for its historical significance and beautiful architecture, Achao offers a unique glimpse into the local culture and attracts history buffs and tourists alike. | Iglesia de Achao, Achao Museum, Artisan shops, Scenic viewpoints, Local food stalls |
| Cucao | Famous for its national park and stunning natural beauty. Highly appealing to those interested in nature, hiking, and outdoor activities. | Cucao National Park, Chile's coastal forests, Beach walks, Local wildlife, Surfing spots |
| Las Cascadas | A serene area known for its natural waterfalls and lush greenery, drawing in visitors looking for relaxation and nature exploration. | Cascadas de Las Cascadas, Hiking trails, Photo opportunities, Nature walks, Picnic areas |
| Rilan Peninsula | An idyllic area with breathtaking views of the waters and nearby islands, perfect for those looking for a scenic retreat. | Rilan Lookout, Local beaches, Kayaking spots, Wildlife watching, Fishing adventures |
| Mahuida | A quaint village that serves as a gateway to the surrounding natural attractions. Perfect for visitors wanting a home-like experience. | Mahuida Beach, Local farms, Cultural workshops, Community events, Scenic hikes |
| Chulchuy | A hidden gem offering privacy and seclusion, ideal for travelers looking to escape the crowds and enjoy the peaceful countryside. | Chulchuy Beach, Countryside views, Local wildlife, Quiet walking paths, Chilean farm experiences |
Understanding Airbnb License Requirements & STR Laws in Dalcahue (2026)
While Dalcahue, Los Lagos Region, Chile currently shows low STR regulations, specific Airbnb license requirements might still exist or change. Always verify the latest short term rental regulations and Airbnb license requirements directly with local government authorities for Dalcahue to ensure full compliance before hosting.
(Source: AirROI data, 2026, based on 6% licensed listings)
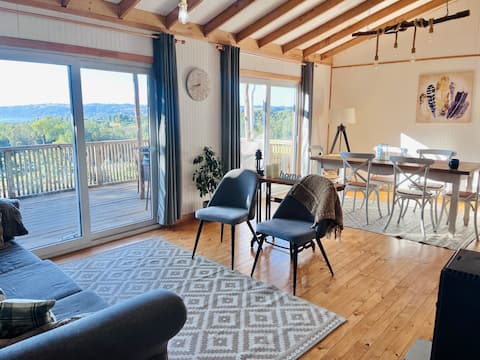
Top Performing Airbnb Properties in Dalcahue (2026)
Benchmark your potential! Explore examples of top-performing Airbnb properties in Dalcahuebased on Trailing Twelve Month (TTM) revenue. Analyze their characteristics, revenue, occupancy rate, and ADR to understand what drives success in this market.
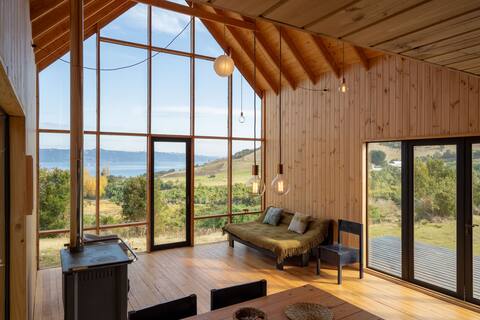
Beautiful cabin in Dalcahue - Chiloé
Entire Place • 2 bedrooms

Beautiful country house with panoramic ocean view
Entire Place • 3 bedrooms
Casa Pascuala Entire cabin, ocean view
Entire Place • 2 bedrooms
House with ocean views in a natural environment – 4x4 access
Entire Place • 3 bedrooms

Trumahue, dream with a hot tub in the woods in Castro
Entire Place • 1 bedroom
Dalcahue Centro Cabin
Entire Place • 2 bedrooms
Note: Performance varies based on location, size, amenities, seasonality, and management quality. Data reflects the past 12 months.
Top Performing Airbnb Hosts in Dalcahue (2026)
Learn from the best! This table showcases top-performing Airbnb hosts in Dalcahue based on the number of properties managed and estimated total revenue over the past year. Analyze their scale and performance metrics.
| Host Name | Properties | Grossing Revenue | Stay Reviews | Avg Rating |
|---|---|---|---|---|
| Cristóbal | 2 | $28,999 | 164 | 4.96/5.0 |
| Romina | 2 | $19,126 | 173 | 4.95/5.0 |
| Marcos | 2 | $17,409 | 22 | 4.92/5.0 |
| Alejandra | 1 | $14,037 | 112 | 4.98/5.0 |
| Tamy | 1 | $11,682 | 9 | 4.44/5.0 |
| Roni | 1 | $10,438 | 129 | 4.99/5.0 |
| Ema | 4 | $9,298 | 255 | 4.92/5.0 |
| Daniela | 1 | $8,137 | 2 | Not Rated |
| Consuelo | 1 | $7,568 | 5 | 5.00/5.0 |
| Loreto | 1 | $7,463 | 40 | 4.98/5.0 |
Analyzing the strategies of top hosts, such as their property selection, pricing, and guest communication, can offer valuable lessons for optimizing your own Airbnb operations in Dalcahue.
Dive Deeper: Advanced Dalcahue STR Market Data (2026)
Ready to unlock more insights? AirROI provides access to advanced metrics and comprehensive Airbnb data for Dalcahue. Explore detailed analytics beyond this report to refine your investment strategy, optimize pricing, and maximize your vacation rental profits.
Explore Advanced MetricsDalcahue Short-Term Rental Market Composition (2026): Property & Room Types
Room Type Distribution
Property Type Distribution
Market Composition Insights for Dalcahue
- The Dalcahue Airbnb market composition is heavily skewed towards Entire Home/Apt listings, which make up 85.4% of the 103 active rentals. This indicates strong guest preference for privacy and space.
- Looking at the property type distribution in Dalcahue, Outdoor/Unique properties are the most common (51.5%), reflecting the local real estate landscape.
- Houses represent a significant 32% portion, catering likely to families or larger groups.
- The presence of 5.8% Hotel/Boutique listings indicates integration with traditional hospitality.
- Smaller segments like apartment/condo, unique stays, others (combined 10.8%) offer potential for unique stay experiences.
Dalcahue Airbnb Room Capacity Analysis (2026): Bedroom Distribution
Distribution of Listings by Number of Bedrooms
Room Capacity Insights for Dalcahue
- The dominant room capacity in Dalcahue is 2 bedrooms listings, making up 43.7% of the market. This suggests a strong demand for properties suitable for couples or solo travelers.
- Together, 2 bedrooms and 1 bedroom properties represent 61.2% of the active Airbnb listings in Dalcahue, indicating a high concentration in these sizes.
- A significant 28.2% of listings offer 3+ bedrooms, catering to larger groups and families seeking more space in Dalcahue.
Dalcahue Vacation Rental Guest Capacity Trends (2026)
Distribution of Listings by Guest Capacity
Guest Capacity Insights for Dalcahue
- The most common guest capacity trend in Dalcahue vacation rentals is listings accommodating 4 guests (32%). This suggests the primary traveler segment is likely small families or groups.
- Properties designed for 4 guests and 5 guests dominate the Dalcahue STR market, accounting for 48.5% of listings.
- 24.3% of properties accommodate 6+ guests, serving the market segment for larger families or group travel in Dalcahue.
- On average, properties in Dalcahue are equipped to host 4.2 guests.
Dalcahue Airbnb Booking Patterns (2026): Available vs. Booked Days
Available Days Distribution
Booked Days Distribution
Booking Pattern Insights for Dalcahue
- The most common availability pattern in Dalcahue falls within the 271-366 days range, representing 90.3% of listings. This suggests many properties have significant open periods on their calendars.
- Approximately 97.1% of listings show high availability (181+ days open annually), indicating potential for increased bookings or specific owner usage patterns.
- For booked days, the 1-30 days range is most frequent in Dalcahue (47.6%), reflecting common guest stay durations or potential owner blocking patterns.
- A notable 2.9% of properties secure long booking periods (181+ days booked per year), highlighting successful long-term rental strategies or significant owner usage.
Dalcahue Airbnb Minimum Stay Requirements Analysis
Distribution of Listings by Minimum Night Requirement
1 Night
38 listings
36.9% of total
2 Nights
34 listings
33% of total
3 Nights
5 listings
4.9% of total
4-6 Nights
1 listings
1% of total
30+ Nights
25 listings
24.3% of total
Key Insights
- The most prevalent minimum stay requirement in Dalcahue is 1 Night, adopted by 36.9% of listings. This highlights the market's preference for shorter, flexible bookings.
- A strong majority (69.9%) of the Dalcahue Airbnb data shows acceptance of very short stays (1-2 nights), indicating a dynamic, high-turnover market.
- A significant segment (24.3%) caters to monthly stays (30+ nights) in Dalcahue, pointing to opportunities in the extended-stay market.
Recommendations
- Align with the market by considering a 1 Night minimum stay, as 36.9% of Dalcahue hosts use this setting.
- Explore offering discounts for stays of 30+ nights to attract the 24.3% of the market seeking extended stays.
- Adjust minimum nights based on seasonality – potentially shorter during low season and longer during peak demand periods in Dalcahue.
Dalcahue Airbnb Cancellation Policy Trends Analysis (2026)
Flexible
62 listings
60.2% of total
Moderate
28 listings
27.2% of total
Firm
11 listings
10.7% of total
Strict
2 listings
1.9% of total
Cancellation Policy Insights for Dalcahue
- The prevailing Airbnb cancellation policy trend in Dalcahue is Flexible, used by 60.2% of listings.
- The market strongly favors guest-friendly terms, with 87.4% of listings offering Flexible or Moderate policies. This suggests guests in Dalcahue may expect booking flexibility.
- Strict cancellation policies are quite rare (1.9%), potentially making listings with this policy less competitive unless justified by high demand or property type.
Recommendations for Hosts
- Consider adopting a Flexible policy to align with the 60.2% market standard in Dalcahue.
- Given the high prevalence of Flexible policies (60.2%), offering this can enhance booking appeal, especially during shoulder seasons.
- Using a Strict policy might deter some guests, as only 1.9% of listings use it. Evaluate if potential revenue protection outweighs possible lower booking rates.
- Regularly review your cancellation policy against competitors and market demand shifts in Dalcahue.
Dalcahue STR Booking Lead Time Analysis (2026)
Average Booking Lead Time by Month
Booking Lead Time Insights for Dalcahue
- The overall average booking lead time for vacation rentals in Dalcahue is 23 days.
- Guests book furthest in advance for stays during December (average 42 days), likely coinciding with peak travel demand or local events.
- The shortest booking windows occur for stays in June (average 8 days), indicating more last-minute travel plans during this time.
- Seasonally, Winter (33 days avg.) sees the longest lead times, while Summer (12 days avg.) has the shortest, reflecting typical travel planning cycles.
Recommendations for Hosts
- Use the overall average lead time (23 days) as a baseline for your pricing and availability strategy in Dalcahue.
- For December stays, consider implementing length-of-stay discounts or slightly higher rates for bookings made less than 42 days out to capitalize on advance planning.
- During June, focus on last-minute booking availability and promotions, as guests book with very short notice (8 days avg.).
- Target marketing efforts for the Winter season well in advance (at least 33 days) to capture early planners.
- Monitor your own booking lead times against these Dalcahue averages to identify opportunities for dynamic pricing adjustments.
Popular & Essential Airbnb Amenities in Dalcahue (2026)
Amenity Prevalence
Amenity Insights for Dalcahue
- Essential amenities in Dalcahue that guests expect include: Free parking on premises. Lacking these (this) could significantly impact bookings.
- Popular amenities like Kitchen, TV, Hot water are common but not universal. Offering these can provide a competitive edge.
- Warning: Wifi is not universally provided but is considered essential globally. Ensure reliable Wifi is offered.
Recommendations for Hosts
- Ensure your listing includes all essential amenities for Dalcahue: Free parking on premises.
- Prioritize adding missing essentials: Free parking on premises.
- Consider adding popular differentiators like Kitchen or TV to increase appeal.
- Highlight unique or less common amenities you offer (e.g., hot tub, dedicated workspace, EV charger) in your listing description and photos.
- Regularly check competitor amenities in Dalcahue to stay competitive.
Dalcahue Airbnb Guest Demographics & Profile Analysis (2026)
Guest Profile Summary for Dalcahue
- The typical guest profile for Airbnb in Dalcahue consists of primarily domestic travelers (76%), often arriving from nearby Santiago, typically belonging to the Post-2000s (Gen Z/Alpha) group (50%), primarily speaking Spanish or English.
- Domestic travelers account for 75.5% of guests.
- Key international markets include Chile (75.5%) and France (5.2%).
- Top languages spoken are Spanish (50.8%) followed by English (32.8%).
- A significant demographic segment is the Post-2000s (Gen Z/Alpha) group, representing 50% of guests.
Recommendations for Hosts
- Target domestic marketing efforts towards travelers from Santiago and Antofagasta.
- Tailor amenities and listing descriptions to appeal to the dominant Post-2000s (Gen Z/Alpha) demographic (e.g., highlight fast WiFi, smart home features, local guides).
- Highlight unique local experiences or amenities relevant to the primary guest profile.
- Consider seasonal promotions aligned with peak travel times for key origin markets.
Nearby Short-Term Rental Market Comparison
How does the Dalcahue Airbnb market stack up against its neighbors? Compare key performance metrics like average monthly revenue, ADR, and occupancy rates in surrounding areas to understand the broader regional STR landscape.
| Market | Active Properties | Monthly Revenue | Daily Rate | Avg. Occupancy |
|---|---|---|---|---|
| Puerto Varas | 1,250 | $660 | $102.65 | 38% |
| Frutillar | 244 | $566 | $111.42 | 34% |
| Chaitén | 70 | $496 | $95.25 | 37% |
| Cochamó | 140 | $410 | $88.51 | 30% |
| Llanquihue | 122 | $398 | $83.95 | 36% |
| Chonchi | 134 | $374 | $91.35 | 27% |
| Castro | 431 | $331 | $74.56 | 32% |
| Quemchi | 26 | $307 | $79.20 | 30% |
| Puerto Montt | 647 | $305 | $56.46 | 33% |
| Calbuco | 26 | $300 | $65.87 | 31% |