Corral Airbnb Market Analysis 2026: Short Term Rental Data & Vacation Rental Statistics in Los Ríos, Chile
Is Airbnb profitable in Corral in 2026? Explore comprehensive Airbnb analytics for Corral, Los Ríos, Chile to uncover income potential. This 2026 STR market report for Corral, based on AirROI data from October 2024 to September 2025, reveals key trends in the niche market of 17 active listings.
Whether you're considering an Airbnb investment in Corral, optimizing your existing vacation rental, or exploring rental arbitrage opportunities, understanding the Corral Airbnb data is crucial. Leveraging the low regulation environment is key to maximizing your short term rental income potential. Let's dive into the specifics.
Key Corral Airbnb Performance Metrics Overview
Monthly Airbnb Revenue Variations & Income Potential in Corral (2026)
Understanding the monthly revenue variations for Airbnb listings in Corral is key to maximizing your short term rental income potential. Seasonality significantly impacts earnings. Our analysis, based on data from the past 12 months, shows that the peak revenue month for STRs in Corral is typically February, while August often presents the lowest earnings, highlighting opportunities for strategic pricing adjustments during shoulder and low seasons. Explore the typical Airbnb income in Corral across different performance tiers:
- Best-in-class properties (Top 10%) achieve $877+ monthly, often utilizing dynamic pricing and superior guest experiences.
- Strong performing properties (Top 25%) earn $559 or more, indicating effective management and desirable locations/amenities.
- Typical properties (Median) generate around $345 per month, representing the average market performance.
- Entry-level properties (Bottom 25%) see earnings around $171, often with potential for optimization.
Average Monthly Airbnb Earnings Trend in Corral
Corral Airbnb Occupancy Rate Trends (2026)
Maximize your bookings by understanding the Corral STR occupancy trends. Seasonal demand shifts significantly influence how often properties are booked. Typically, Februarysees the highest demand (peak season occupancy), while August experiences the lowest (low season). Effective strategies, like adjusting minimum stays or offering promotions, can boost occupancy during slower periods. Here's how different property tiers perform in Corral:
- Best-in-class properties (Top 10%) achieve 40%+ occupancy, indicating high desirability and potentially optimized availability.
- Strong performing properties (Top 25%) maintain 34% or higher occupancy, suggesting good market fit and guest satisfaction.
- Typical properties (Median) have an occupancy rate around 17%.
- Entry-level properties (Bottom 25%) average 9% occupancy, potentially facing higher vacancy.
Average Monthly Occupancy Rate Trend in Corral
Average Daily Rate (ADR) Airbnb Trends in Corral (2026)
Effective short term rental pricing strategy in Corral involves understanding monthly ADR fluctuations. The Average Daily Rate (ADR) for Airbnb in Corral typically peaks in May and dips lowest during November. Leveraging Airbnb dynamic pricing tools or strategies based on this seasonality can significantly boost revenue. Here's a look at the typical nightly rates achieved:
- Best-in-class properties (Top 10%) command rates of $109+ per night, often due to premium features or locations.
- Strong performing properties (Top 25%) achieve nightly rates of $79 or more.
- Typical properties (Median) charge around $68 per night.
- Entry-level properties (Bottom 25%) earn around $55 per night.
Average Daily Rate (ADR) Trend by Month in Corral
Get Live Corral Market Intelligence 👇

Explore Real-time Analytics
Airbnb Seasonality Analysis & Trends in Corral (2025)
Peak Season (February, January, March)
- Revenue averages $795 per month
- Occupancy rates average 38.5%
- Daily rates average $74
Shoulder Season
- Revenue averages $386 per month
- Occupancy maintains around 17.7%
- Daily rates hold near $77
Low Season (August, September, November)
- Revenue drops to average $195 per month
- Occupancy decreases to average 10.9%
- Daily rates adjust to average $78
Seasonality Insights for Corral
- The Airbnb seasonality in Corral shows highly seasonal trends requiring careful strategy. While the sections above show seasonal averages, it's also insightful to look at the extremes:
- During the high season, the absolute peak month showcases Corral's highest earning potential, with monthly revenues capable of climbing to $1,053, occupancy reaching a high of 51.6%, and ADRs peaking at $81.
- Conversely, the slowest single month of the year, typically falling within the low season, marks the market's lowest point. In this month, revenue might dip to $159, occupancy could drop to 7.1%, and ADRs may adjust down to $73.
- Understanding both the seasonal averages and these monthly peaks and troughs in revenue, occupancy, and ADR is crucial for maximizing your Airbnb profit potential in Corral.
Seasonal Strategies for Maximizing Profit
- Peak Season: Maximize revenue through premium pricing and potentially longer minimum stays. Ensure high availability.
- Low Season: Offer competitive pricing, special promotions (e.g., extended stay discounts), and flexible cancellation policies. Target off-season travelers like remote workers or budget-conscious guests.
- Shoulder Seasons: Implement dynamic pricing that balances peak and low rates. Target weekend travelers or specific events. Offer slightly more flexible terms than peak season.
- Regularly analyze your own performance against these Corral seasonality benchmarks and adjust your pricing and availability strategy accordingly.
Best Areas for Airbnb Investment in Corral (2026)
Exploring the top neighborhoods for short-term rentals in Corral? This section highlights key areas, outlining why they are attractive for hosts and guests, along with notable local attractions. Consider these locations based on your target guest profile and investment strategy.
| Neighborhood / Area | Why Host Here? (Target Guests & Appeal) | Key Attractions & Landmarks |
|---|---|---|
| Valdivia | The capital of Los Ríos Region, known for its beautiful rivers and rich history, it attracts tourists for its unique architecture and vibrant culture. | Parque Saval, Cerro Anson, Museo Histórico y Antropológico, Costanera de Valdivia, Mercado Fluvial, Catedral de Valdivia |
| Niebla | A picturesque coastal area near Valdivia, famous for its beaches and historical sites, making it ideal for beachgoers and history enthusiasts. | Castillo de Niebla, Playa Niebla, Nature trails, Cabo Blanco, Museo del Castillo de Niebla |
| Los Lagos | A rural area characterized by stunning lakes and natural beauty, popular for outdoor activities, fishing, and relaxation. | Lago Ranco, Lago Maihue, Hiking trails, Fishing spots, Camping areas |
| Río Calle Calle | Scenic river area known for its biodiversity and stunning landscapes, attracting nature lovers and eco-tourists. | Kayaking on Río Calle Calle, Nature reserves, Birdwatching spots, Scenic viewpoints |
| Futrono | A charming town surrounded by lakes and mountains, ideal for those looking for a serene environment and outdoor activities. | Lago Ranco, Cerro Leptepu, Hiking trails, Local artisan markets |
| La Unión | Known for its rich cultural heritage and beautiful landscapes, it offers a great mix of rural charm and historical sites. | Cerro Huagán, Local festivals, Nature parks, Cultural heritage sites |
| Mariposas | A tranquil area near Valdivia, perfect for nature retreats and offers access to beautiful rural landscapes. | Local flora and fauna, Eco-tourism activities, Gardens |
| Cerca de la Playa | Coastal regions close to the beach that offer a mix of relaxation and water activities, drawing beach lovers. | Beaches, Water sports, Beachside restaurants |
Understanding Airbnb License Requirements & STR Laws in Corral (2026)
While Corral, Los Ríos, Chile currently shows low STR regulations, specific Airbnb license requirements might still exist or change. Always verify the latest short term rental regulations and Airbnb license requirements directly with local government authorities for Corral to ensure full compliance before hosting.
(Source: AirROI data, 2026, based on 6% licensed listings)
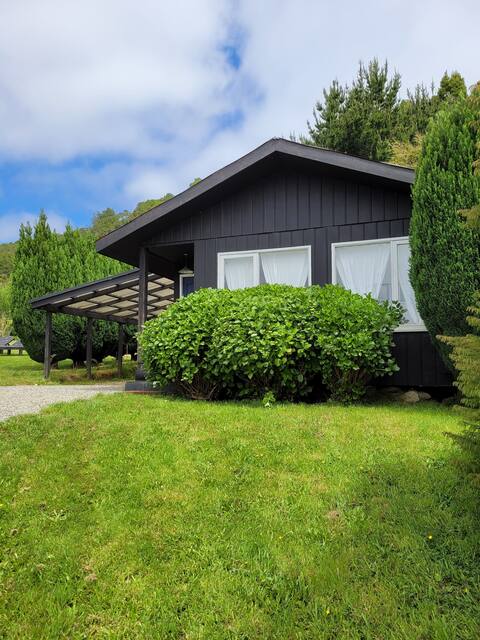
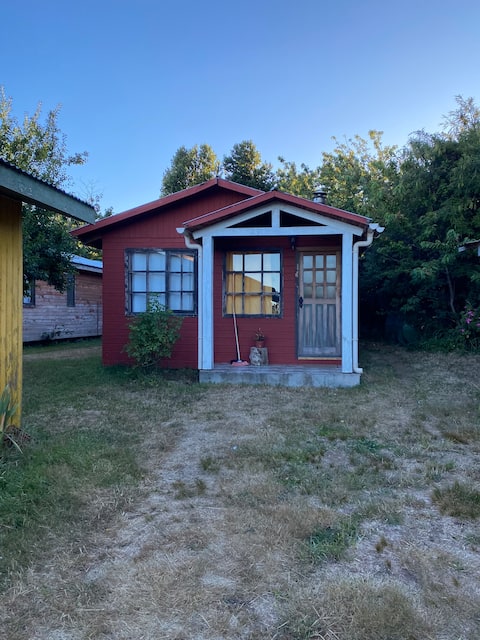
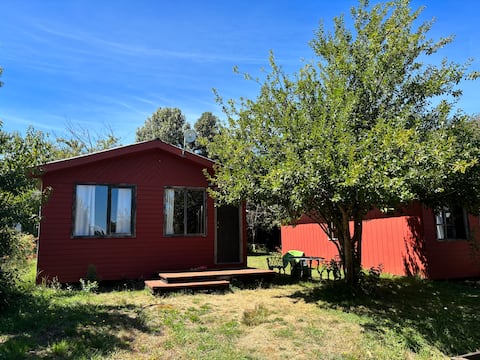
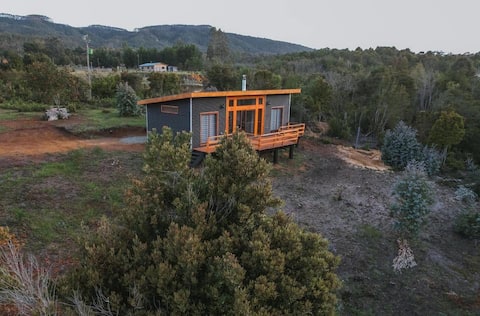
Top Performing Airbnb Properties in Corral (2026)
Benchmark your potential! Explore examples of top-performing Airbnb properties in Corralbased on Trailing Twelve Month (TTM) revenue. Analyze their characteristics, revenue, occupancy rate, and ADR to understand what drives success in this market.

Oceanfront cabin with hot tub and pool
Entire Place • 2 bedrooms
Cabin with an ocean view
Entire Place • 2 bedrooms

Huiro Lodge Dome and Marine Wildlife Watching D2
Entire Place • 1 bedroom
Cabin in Chaihuin
Entire Place • 2 bedrooms
Cabin in Chaihuín
Entire Place • 2 bedrooms
Loft Nativos
Entire Place • 2 bedrooms
Note: Performance varies based on location, size, amenities, seasonality, and management quality. Data reflects the past 12 months.
Top Performing Airbnb Hosts in Corral (2026)
Learn from the best! This table showcases top-performing Airbnb hosts in Corral based on the number of properties managed and estimated total revenue over the past year. Analyze their scale and performance metrics.
| Host Name | Properties | Grossing Revenue | Stay Reviews | Avg Rating |
|---|---|---|---|---|
| Antonia | 1 | $12,800 | 4 | 5.00/5.0 |
| Stephanie | 3 | $10,038 | 8 | 5.00/5.0 |
| Anita | 1 | $7,681 | 39 | 4.97/5.0 |
| Fernando | 2 | $7,001 | 77 | 4.88/5.0 |
| Mike | 1 | $2,854 | 18 | 5.00/5.0 |
| Sebastian | 1 | $2,033 | 0 | Not Rated |
| Paulina | 1 | $1,971 | 20 | 4.80/5.0 |
| Shirly | 1 | $1,561 | 22 | 4.77/5.0 |
| Josimar | 1 | $1,343 | 8 | 4.25/5.0 |
| Javier | 1 | $985 | 7 | 4.86/5.0 |
Analyzing the strategies of top hosts, such as their property selection, pricing, and guest communication, can offer valuable lessons for optimizing your own Airbnb operations in Corral.
Dive Deeper: Advanced Corral STR Market Data (2026)
Ready to unlock more insights? AirROI provides access to advanced metrics and comprehensive Airbnb data for Corral. Explore detailed analytics beyond this report to refine your investment strategy, optimize pricing, and maximize your vacation rental profits.
Explore Advanced MetricsCorral Short-Term Rental Market Composition (2026): Property & Room Types
Room Type Distribution
Property Type Distribution
Market Composition Insights for Corral
- The Corral Airbnb market composition is heavily skewed towards Entire Home/Apt listings, which make up 100% of the 17 active rentals. This indicates strong guest preference for privacy and space.
- Looking at the property type distribution in Corral, Outdoor/Unique properties are the most common (47.1%), reflecting the local real estate landscape.
- Houses represent a significant 35.3% portion, catering likely to families or larger groups.
Corral Airbnb Room Capacity Analysis (2026): Bedroom Distribution
Distribution of Listings by Number of Bedrooms
Room Capacity Insights for Corral
- The dominant room capacity in Corral is 2 bedrooms listings, making up 58.8% of the market. This suggests a strong demand for properties suitable for couples or solo travelers.
- Together, 2 bedrooms and 1 bedroom properties represent 82.3% of the active Airbnb listings in Corral, indicating a high concentration in these sizes.
Corral Vacation Rental Guest Capacity Trends (2026)
Distribution of Listings by Guest Capacity
Guest Capacity Insights for Corral
- The most common guest capacity trend in Corral vacation rentals is listings accommodating 4 guests (29.4%). This suggests the primary traveler segment is likely small families or groups.
- Properties designed for 4 guests and 5 guests dominate the Corral STR market, accounting for 52.9% of listings.
- 17.7% of properties accommodate 6+ guests, serving the market segment for larger families or group travel in Corral.
- On average, properties in Corral are equipped to host 4.4 guests.
Corral Airbnb Booking Patterns (2026): Available vs. Booked Days
Available Days Distribution
Booked Days Distribution
Booking Pattern Insights for Corral
- The most common availability pattern in Corral falls within the 271-366 days range, representing 88.2% of listings. This suggests many properties have significant open periods on their calendars.
- Approximately 100.0% of listings show high availability (181+ days open annually), indicating potential for increased bookings or specific owner usage patterns.
- For booked days, the 1-30 days range is most frequent in Corral (52.9%), reflecting common guest stay durations or potential owner blocking patterns.
Corral Airbnb Minimum Stay Requirements Analysis
Distribution of Listings by Minimum Night Requirement
1 Night
7 listings
41.2% of total
2 Nights
5 listings
29.4% of total
3 Nights
1 listings
5.9% of total
30+ Nights
4 listings
23.5% of total
Key Insights
- The most prevalent minimum stay requirement in Corral is 1 Night, adopted by 41.2% of listings. This highlights the market's preference for shorter, flexible bookings.
- A strong majority (70.6%) of the Corral Airbnb data shows acceptance of very short stays (1-2 nights), indicating a dynamic, high-turnover market.
- A significant segment (23.5%) caters to monthly stays (30+ nights) in Corral, pointing to opportunities in the extended-stay market.
Recommendations
- Align with the market by considering a 1 Night minimum stay, as 41.2% of Corral hosts use this setting.
- Explore offering discounts for stays of 30+ nights to attract the 23.5% of the market seeking extended stays.
- Adjust minimum nights based on seasonality – potentially shorter during low season and longer during peak demand periods in Corral.
Corral Airbnb Cancellation Policy Trends Analysis (2026)
Flexible
10 listings
58.8% of total
Moderate
7 listings
41.2% of total
Cancellation Policy Insights for Corral
- The prevailing Airbnb cancellation policy trend in Corral is Flexible, used by 58.8% of listings.
- The market strongly favors guest-friendly terms, with 100.0% of listings offering Flexible or Moderate policies. This suggests guests in Corral may expect booking flexibility.
Recommendations for Hosts
- Consider adopting a Flexible policy to align with the 58.8% market standard in Corral.
- Given the high prevalence of Flexible policies (58.8%), offering this can enhance booking appeal, especially during shoulder seasons.
- Regularly review your cancellation policy against competitors and market demand shifts in Corral.
Corral STR Booking Lead Time Analysis (2026)
Average Booking Lead Time by Month
Booking Lead Time Insights for Corral
- The overall average booking lead time for vacation rentals in Corral is 19 days.
- Guests book furthest in advance for stays during March (average 36 days), likely coinciding with peak travel demand or local events.
- The shortest booking windows occur for stays in August (average 6 days), indicating more last-minute travel plans during this time.
- Seasonally, Fall (26 days avg.) sees the longest lead times, while Summer (8 days avg.) has the shortest, reflecting typical travel planning cycles.
Recommendations for Hosts
- Use the overall average lead time (19 days) as a baseline for your pricing and availability strategy in Corral.
- For March stays, consider implementing length-of-stay discounts or slightly higher rates for bookings made less than 36 days out to capitalize on advance planning.
- During August, focus on last-minute booking availability and promotions, as guests book with very short notice (6 days avg.).
- Target marketing efforts for the Fall season well in advance (at least 26 days) to capture early planners.
- Monitor your own booking lead times against these Corral averages to identify opportunities for dynamic pricing adjustments.
Popular & Essential Airbnb Amenities in Corral (2026)
Amenity Prevalence
Amenity Insights for Corral
- Popular amenities like Free parking on premises, Kitchen, TV are common but not universal. Offering these can provide a competitive edge.
Recommendations for Hosts
- Consider adding popular differentiators like Free parking on premises or Kitchen to increase appeal.
- Highlight unique or less common amenities you offer (e.g., hot tub, dedicated workspace, EV charger) in your listing description and photos.
- Regularly check competitor amenities in Corral to stay competitive.
Corral Airbnb Guest Demographics & Profile Analysis (2026)
Guest Profile Summary for Corral
- The typical guest profile for Airbnb in Corral consists of primarily domestic travelers (87%), often arriving from nearby Santiago, typically belonging to the Post-2000s (Gen Z/Alpha) group (50%), primarily speaking Spanish or English.
- Domestic travelers account for 86.5% of guests.
- Key international markets include Chile (86.5%) and Brazil (2.7%).
- Top languages spoken are Spanish (50%) followed by English (34.4%).
- A significant demographic segment is the Post-2000s (Gen Z/Alpha) group, representing 50% of guests.
Recommendations for Hosts
- Target domestic marketing efforts towards travelers from Santiago and Temuco.
- Tailor amenities and listing descriptions to appeal to the dominant Post-2000s (Gen Z/Alpha) demographic (e.g., highlight fast WiFi, smart home features, local guides).
- Highlight unique local experiences or amenities relevant to the primary guest profile.
- Consider seasonal promotions aligned with peak travel times for key origin markets.
Nearby Short-Term Rental Market Comparison
How does the Corral Airbnb market stack up against its neighbors? Compare key performance metrics like average monthly revenue, ADR, and occupancy rates in surrounding areas to understand the broader regional STR landscape.
| Market | Active Properties | Monthly Revenue | Daily Rate | Avg. Occupancy |
|---|---|---|---|---|
| Los Lagos | 37 | $595 | $116.26 | 29% |
| Puerto Octay | 110 | $594 | $121.48 | 29% |
| Futrono | 178 | $578 | $119.43 | 34% |
| Puyehue | 88 | $557 | $96.95 | 29% |
| Panguipulli | 611 | $544 | $96.27 | 34% |
| Río Bueno | 32 | $483 | $74.72 | 33% |
| Vilcún | 11 | $475 | $89.97 | 26% |
| Lago Ranco | 160 | $468 | $108.45 | 33% |
| Villarrica | 1,326 | $444 | $95.59 | 36% |
| Cunco | 54 | $423 | $144.94 | 26% |