Valdivia Airbnb Market Analysis 2026: Short Term Rental Data & Vacation Rental Statistics in Los Ríos, Chile
Is Airbnb profitable in Valdivia in 2026? Explore comprehensive Airbnb analytics for Valdivia, Los Ríos, Chile to uncover income potential. This 2026 STR market report for Valdivia, based on AirROI data from February 2025 to January 2026, reveals key trends in the bustling market of 1,180 active listings.
Whether you're considering an Airbnb investment in Valdivia, optimizing your existing vacation rental, or exploring rental arbitrage opportunities, understanding the Valdivia Airbnb data is crucial. Leveraging the low regulation environment is key to maximizing your short term rental income potential. Let's dive into the specifics.
Key Valdivia Airbnb Performance Metrics Overview
Monthly Airbnb Revenue Variations & Income Potential in Valdivia (2026)
Understanding the monthly revenue variations for Airbnb listings in Valdivia is key to maximizing your short term rental income potential. Seasonality significantly impacts earnings. Our analysis, based on data from the past 12 months, shows that the peak revenue month for STRs in Valdivia is typically February, while April often presents the lowest earnings, highlighting opportunities for strategic pricing adjustments during shoulder and low seasons. Explore the typical Airbnb income in Valdivia across different performance tiers:
- Best-in-class properties (Top 10%) achieve $1,427+ monthly, often utilizing dynamic pricing and superior guest experiences.
- Strong performing properties (Top 25%) earn $941 or more, indicating effective management and desirable locations/amenities.
- Typical properties (Median) generate around $512 per month, representing the average market performance.
- Entry-level properties (Bottom 25%) see earnings around $227, often with potential for optimization.
Average Monthly Airbnb Earnings Trend in Valdivia
Valdivia Airbnb Occupancy Rate Trends (2026)
Maximize your bookings by understanding the Valdivia STR occupancy trends. Seasonal demand shifts significantly influence how often properties are booked. Typically, Februarysees the highest demand (peak season occupancy), while May experiences the lowest (low season). Effective strategies, like adjusting minimum stays or offering promotions, can boost occupancy during slower periods. Here's how different property tiers perform in Valdivia:
- Best-in-class properties (Top 10%) achieve 72%+ occupancy, indicating high desirability and potentially optimized availability.
- Strong performing properties (Top 25%) maintain 51% or higher occupancy, suggesting good market fit and guest satisfaction.
- Typical properties (Median) have an occupancy rate around 30%.
- Entry-level properties (Bottom 25%) average 13% occupancy, potentially facing higher vacancy.
Average Monthly Occupancy Rate Trend in Valdivia
Average Daily Rate (ADR) Airbnb Trends in Valdivia (2026)
Effective short term rental pricing strategy in Valdivia involves understanding monthly ADR fluctuations. The Average Daily Rate (ADR) for Airbnb in Valdivia typically peaks in September and dips lowest during March. Leveraging Airbnb dynamic pricing tools or strategies based on this seasonality can significantly boost revenue. Here's a look at the typical nightly rates achieved:
- Best-in-class properties (Top 10%) command rates of $101+ per night, often due to premium features or locations.
- Strong performing properties (Top 25%) achieve nightly rates of $72 or more.
- Typical properties (Median) charge around $55 per night.
- Entry-level properties (Bottom 25%) earn around $42 per night.
Average Daily Rate (ADR) Trend by Month in Valdivia
Get Live Valdivia Market Intelligence 👇

Explore Real-time Analytics
Airbnb Seasonality Analysis & Trends in Valdivia (2026)
Peak Season (February, January, March)
- Revenue averages $899 per month
- Occupancy rates average 45.7%
- Daily rates average $64
Shoulder Season
- Revenue averages $617 per month
- Occupancy maintains around 31.3%
- Daily rates hold near $65
Low Season (April, May, August)
- Revenue drops to average $550 per month
- Occupancy decreases to average 29.8%
- Daily rates adjust to average $64
Seasonality Insights for Valdivia
- The Airbnb seasonality in Valdivia shows highly seasonal trends requiring careful strategy. While the sections above show seasonal averages, it's also insightful to look at the extremes:
- During the high season, the absolute peak month showcases Valdivia's highest earning potential, with monthly revenues capable of climbing to $1,125, occupancy reaching a high of 60.8%, and ADRs peaking at $66.
- Conversely, the slowest single month of the year, typically falling within the low season, marks the market's lowest point. In this month, revenue might dip to $523, occupancy could drop to 29.5%, and ADRs may adjust down to $62.
- Understanding both the seasonal averages and these monthly peaks and troughs in revenue, occupancy, and ADR is crucial for maximizing your Airbnb profit potential in Valdivia.
Seasonal Strategies for Maximizing Profit
- Peak Season: Maximize revenue through premium pricing and potentially longer minimum stays. Ensure high availability.
- Low Season: Offer competitive pricing, special promotions (e.g., extended stay discounts), and flexible cancellation policies. Target off-season travelers like remote workers or budget-conscious guests.
- Shoulder Seasons: Implement dynamic pricing that balances peak and low rates. Target weekend travelers or specific events. Offer slightly more flexible terms than peak season.
- Regularly analyze your own performance against these Valdivia seasonality benchmarks and adjust your pricing and availability strategy accordingly.
Best Areas for Airbnb Investment in Valdivia (2026)
Exploring the top neighborhoods for short-term rentals in Valdivia? This section highlights key areas, outlining why they are attractive for hosts and guests, along with notable local attractions. Consider these locations based on your target guest profile and investment strategy.
| Neighborhood / Area | Why Host Here? (Target Guests & Appeal) | Key Attractions & Landmarks |
|---|---|---|
| Calle General Lagos | A vibrant area in downtown Valdivia filled with restaurants, shops, and cultural venues. It's a prime location for tourists who want to experience the local lifestyle and attractions nearby. | Catedral de Valdivia, Plaza de la República, Museo Histórico y Antropológico, Teatro Nazareno, Mercado Municipal |
| Costanera de Valdivia | The beautiful riverside costanera offers stunning views and access to outdoor activities, making it a favorite spot for visitors who enjoy nature and leisure. | Rio Calle-Calle, Costanera Mall, Cerro Cai Cai, Paseo Libertad, Parque Saval |
| Isla Teja | A serene area known for its parks and natural beauty, attracting families and nature lovers looking for a peaceful getaway close to the city center. | Jardin Botanico, Parque Saval, Universidad Austral de Chile, Costanera Isla Teja, Museo de la Exploración |
| Niebla | Located on the coast, Niebla is famous for its beaches and historical sites, appealing to both beachgoers and history enthusiasts. | Fuerte Niebla, Playa Niebla, Cabo Blanco, Museo de Sitio Castillo de Niebla, Casa del Patrimonio |
| Río Cruces | A picturesque area along the river, perfect for outdoor activities such as kayaking and hiking. It's great for tourists who love nature. | Reserva Natural Río Cruces, Bridge over Río Cruces, Estero de Pichirropulli, Birdwatching spots, Trilha de Observación |
| Valdivia Maritime Museum | This area combines history and culture, featuring rich maritime history and attractions that draw tourists interested in naval history. | Museo Marítimo, Puerto de Valdivia, Barco de la Armada, Acuario de Valdivia, Fuerte San Luis |
| Pueblo Histórico de Corral | Known for its colonial architecture and historical significance, Corral attracts tourists interested in Chile's history. | Fuerte San Sebastián, Playa de Corral, Mirador de Corral, Museo Histórico de Corral, Caminos de Tierra |
| Parque Saval | A popular urban park in Valdivia that attracts locals and tourists alike. It features walking trails and ponds, perfect for leisure activities. | Lago de Parque Saval, Senderos de Interpretación, Eventos culturales, Áreas de picnic, Actividades deportivas |
Understanding Airbnb License Requirements & STR Laws in Valdivia (2026)
While Valdivia, Los Ríos, Chile currently shows low STR regulations, specific Airbnb license requirements might still exist or change. Always verify the latest short term rental regulations and Airbnb license requirements directly with local government authorities for Valdivia to ensure full compliance before hosting.
(Source: AirROI data, 2026, based on 1% licensed listings)
Top Performing Airbnb Properties in Valdivia (2026)
Benchmark your potential! Explore examples of top-performing Airbnb properties in Valdiviabased on Trailing Twelve Month (TTM) revenue. Analyze their characteristics, revenue, occupancy rate, and ADR to understand what drives success in this market.
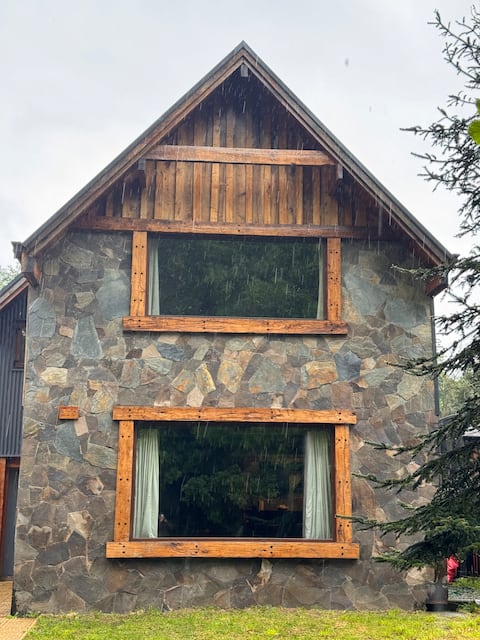
Casona Rustica, in front of Humedal Bosque Valdiviano
Entire Place • 6 bedrooms
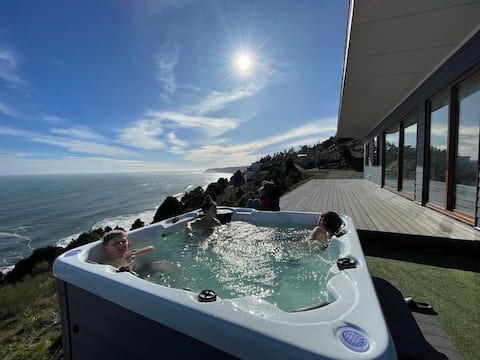
Casa Cielo y Mar
Entire Place • 3 bedrooms
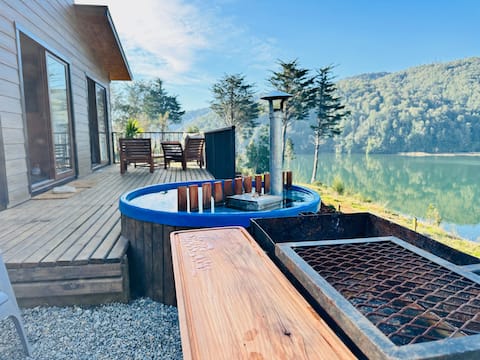
RiverView House for 5.Firepit & HotTub free to use
Entire Place • 2 bedrooms

Puertas Rojas, House 4, beaches, restaurants nearby
Entire Place • 2 bedrooms

Black Swan Villa
Entire Place • 6 bedrooms

Apartment Puertas Rojas, Orilla Rio Valdivia.
Entire Place • 2 bedrooms
Note: Performance varies based on location, size, amenities, seasonality, and management quality. Data reflects the past 12 months.
Top Performing Airbnb Hosts in Valdivia (2026)
Learn from the best! This table showcases top-performing Airbnb hosts in Valdivia based on the number of properties managed and estimated total revenue over the past year. Analyze their scale and performance metrics.
| Host Name | Properties | Grossing Revenue | Stay Reviews | Avg Rating |
|---|---|---|---|---|
| Paolo Enrique | 6 | $75,500 | 509 | 4.84/5.0 |
| Alejandro | 6 | $74,296 | 1012 | 4.97/5.0 |
| La Rueda Del Chucao | 8 | $64,199 | 74 | 4.92/5.0 |
| Lorena | 8 | $60,006 | 1414 | 4.87/5.0 |
| Ricardo | 5 | $58,331 | 715 | 4.92/5.0 |
| Stefani | 6 | $57,760 | 27 | 4.97/5.0 |
| Andy Enrique | 9 | $56,994 | 119 | 4.24/5.0 |
| Lisette | 10 | $56,885 | 435 | 4.75/5.0 |
| Gustavo | 4 | $52,578 | 179 | 4.61/5.0 |
| Natalia | 2 | $51,236 | 160 | 4.92/5.0 |
Analyzing the strategies of top hosts, such as their property selection, pricing, and guest communication, can offer valuable lessons for optimizing your own Airbnb operations in Valdivia.
Dive Deeper: Advanced Valdivia STR Market Data (2026)
Ready to unlock more insights? AirROI provides access to advanced metrics and comprehensive Airbnb data for Valdivia. Explore detailed analytics beyond this report to refine your investment strategy, optimize pricing, and maximize your vacation rental profits.
Explore Advanced MetricsValdivia Short-Term Rental Market Composition (2026): Property & Room Types
Room Type Distribution
Property Type Distribution
Market Composition Insights for Valdivia
- The Valdivia Airbnb market composition is heavily skewed towards Entire Home/Apt listings, which make up 86.6% of the 1,180 active rentals. This indicates strong guest preference for privacy and space.
- Looking at the property type distribution in Valdivia, Apartment/Condo properties are the most common (38.2%), reflecting the local real estate landscape.
- Houses represent a significant 24% portion, catering likely to families or larger groups.
- The presence of 6% Hotel/Boutique listings indicates integration with traditional hospitality.
- Smaller segments like others, unique stays (combined 1.5%) offer potential for unique stay experiences.
Valdivia Airbnb Room Capacity Analysis (2026): Bedroom Distribution
Distribution of Listings by Number of Bedrooms
Room Capacity Insights for Valdivia
- The dominant room capacity in Valdivia is 2 bedrooms listings, making up 38.6% of the market. This suggests a strong demand for properties suitable for couples or solo travelers.
- Together, 2 bedrooms and 1 bedroom properties represent 75.2% of the active Airbnb listings in Valdivia, indicating a high concentration in these sizes.
Valdivia Vacation Rental Guest Capacity Trends (2026)
Distribution of Listings by Guest Capacity
Guest Capacity Insights for Valdivia
- The most common guest capacity trend in Valdivia vacation rentals is listings accommodating 2 guests (26.4%). This suggests the primary traveler segment is likely couples or solo travelers.
- Properties designed for 2 guests and 4 guests dominate the Valdivia STR market, accounting for 52.2% of listings.
- 14.2% of properties accommodate 6+ guests, serving the market segment for larger families or group travel in Valdivia.
- On average, properties in Valdivia are equipped to host 3.4 guests.
Valdivia Airbnb Booking Patterns (2026): Available vs. Booked Days
Available Days Distribution
Booked Days Distribution
Booking Pattern Insights for Valdivia
- The most common availability pattern in Valdivia falls within the 271-366 days range, representing 71.6% of listings. This suggests many properties have significant open periods on their calendars.
- Approximately 91.5% of listings show high availability (181+ days open annually), indicating potential for increased bookings or specific owner usage patterns.
- For booked days, the 31-90 days range is most frequent in Valdivia (42.8%), reflecting common guest stay durations or potential owner blocking patterns.
- A notable 9.3% of properties secure long booking periods (181+ days booked per year), highlighting successful long-term rental strategies or significant owner usage.
Valdivia Airbnb Minimum Stay Requirements Analysis
Distribution of Listings by Minimum Night Requirement
1 Night
387 listings
32.8% of total
2 Nights
386 listings
32.7% of total
3 Nights
79 listings
6.7% of total
4-6 Nights
21 listings
1.8% of total
7-29 Nights
2 listings
0.2% of total
30+ Nights
305 listings
25.8% of total
Key Insights
- The most prevalent minimum stay requirement in Valdivia is 1 Night, adopted by 32.8% of listings. This highlights the market's preference for shorter, flexible bookings.
- A strong majority (65.5%) of the Valdivia Airbnb data shows acceptance of very short stays (1-2 nights), indicating a dynamic, high-turnover market.
- A significant segment (25.8%) caters to monthly stays (30+ nights) in Valdivia, pointing to opportunities in the extended-stay market.
Recommendations
- Align with the market by considering a 1 Night minimum stay, as 32.8% of Valdivia hosts use this setting.
- Explore offering discounts for stays of 30+ nights to attract the 25.8% of the market seeking extended stays.
- Adjust minimum nights based on seasonality – potentially shorter during low season and longer during peak demand periods in Valdivia.
Valdivia Airbnb Cancellation Policy Trends Analysis (2026)
Limited
39 listings
3.3% of total
Flexible
588 listings
50% of total
Moderate
347 listings
29.5% of total
Firm
181 listings
15.4% of total
Strict
20 listings
1.7% of total
Cancellation Policy Insights for Valdivia
- The prevailing Airbnb cancellation policy trend in Valdivia is Flexible, used by 50% of listings.
- The market strongly favors guest-friendly terms, with 79.5% of listings offering Flexible or Moderate policies. This suggests guests in Valdivia may expect booking flexibility.
- Strict cancellation policies are quite rare (1.7%), potentially making listings with this policy less competitive unless justified by high demand or property type.
Recommendations for Hosts
- Consider adopting a Flexible policy to align with the 50% market standard in Valdivia.
- Using a Strict policy might deter some guests, as only 1.7% of listings use it. Evaluate if potential revenue protection outweighs possible lower booking rates.
- Regularly review your cancellation policy against competitors and market demand shifts in Valdivia.
Valdivia STR Booking Lead Time Analysis (2026)
Average Booking Lead Time by Month
Booking Lead Time Insights for Valdivia
- The overall average booking lead time for vacation rentals in Valdivia is 29 days.
- Guests book furthest in advance for stays during November (average 73 days), likely coinciding with peak travel demand or local events.
- The shortest booking windows occur for stays in July (average 15 days), indicating more last-minute travel plans during this time.
- Seasonally, Fall (43 days avg.) sees the longest lead times, while Spring (18 days avg.) has the shortest, reflecting typical travel planning cycles.
Recommendations for Hosts
- Use the overall average lead time (29 days) as a baseline for your pricing and availability strategy in Valdivia.
- For November stays, consider implementing length-of-stay discounts or slightly higher rates for bookings made less than 73 days out to capitalize on advance planning.
- Target marketing efforts for the Fall season well in advance (at least 43 days) to capture early planners.
- Monitor your own booking lead times against these Valdivia averages to identify opportunities for dynamic pricing adjustments.
Popular & Essential Airbnb Amenities in Valdivia (2026)
Amenity Prevalence
Amenity Insights for Valdivia
- Popular amenities like Kitchen, Wifi, TV are common but not universal. Offering these can provide a competitive edge.
- Warning: Wifi is not universally provided but is considered essential globally. Ensure reliable Wifi is offered.
Recommendations for Hosts
- Consider adding popular differentiators like Kitchen or Wifi to increase appeal.
- Highlight unique or less common amenities you offer (e.g., hot tub, dedicated workspace, EV charger) in your listing description and photos.
- Regularly check competitor amenities in Valdivia to stay competitive.
Valdivia Airbnb Guest Demographics & Profile Analysis (2026)
Guest Profile Summary for Valdivia
- The typical guest profile for Airbnb in Valdivia consists of primarily domestic travelers (82%), often arriving from nearby Santiago, typically belonging to the Post-2000s (Gen Z/Alpha) group (50%), primarily speaking Spanish or English.
- Domestic travelers account for 82.2% of guests.
- Key international markets include Chile (82.2%) and Argentina (4.7%).
- Top languages spoken are Spanish (53.5%) followed by English (33.6%).
- A significant demographic segment is the Post-2000s (Gen Z/Alpha) group, representing 50% of guests.
Recommendations for Hosts
- Target domestic marketing efforts towards travelers from Santiago and Temuco.
- Tailor amenities and listing descriptions to appeal to the dominant Post-2000s (Gen Z/Alpha) demographic (e.g., highlight fast WiFi, smart home features, local guides).
- Highlight unique local experiences or amenities relevant to the primary guest profile.
- Consider seasonal promotions aligned with peak travel times for key origin markets.
Nearby Short-Term Rental Market Comparison
How does the Valdivia Airbnb market stack up against its neighbors? Compare key performance metrics like average monthly revenue, ADR, and occupancy rates in surrounding areas to understand the broader regional STR landscape.
| Market | Active Properties | Monthly Revenue | Daily Rate | Avg. Occupancy |
|---|---|---|---|---|
| Puyehue | 88 | $570 | $102.90 | 30% |
| Futrono | 177 | $530 | $126.37 | 32% |
| Puerto Octay | 112 | $524 | $133.36 | 28% |
| Los Lagos | 35 | $512 | $111.49 | 28% |
| Panguipulli | 609 | $501 | $99.59 | 33% |
| Vilcún | 13 | $481 | $87.68 | 24% |
| Lago Ranco | 164 | $430 | $106.48 | 32% |
| Río Bueno | 29 | $428 | $73.05 | 35% |
| Villarrica | 1,337 | $389 | $96.70 | 35% |
| Temuco | 433 | $343 | $51.74 | 34% |