Puerto Natales Airbnb Market Analysis 2026: Short Term Rental Data & Vacation Rental Statistics in Magallanes and Chilean Antarctica Region, Chile
Is Airbnb profitable in Puerto Natales in 2026? Explore comprehensive Airbnb analytics for Puerto Natales, Magallanes and Chilean Antarctica Region, Chile to uncover income potential. This 2026 STR market report for Puerto Natales, based on AirROI data from February 2025 to January 2026, reveals key trends in the market of 558 active listings.
Whether you're considering an Airbnb investment in Puerto Natales, optimizing your existing vacation rental, or exploring rental arbitrage opportunities, understanding the Puerto Natales Airbnb data is crucial. Leveraging the low regulation environment is key to maximizing your short term rental income potential. Let's dive into the specifics.
Key Puerto Natales Airbnb Performance Metrics Overview
Monthly Airbnb Revenue Variations & Income Potential in Puerto Natales (2026)
Understanding the monthly revenue variations for Airbnb listings in Puerto Natales is key to maximizing your short term rental income potential. Seasonality significantly impacts earnings. Our analysis, based on data from the past 12 months, shows that the peak revenue month for STRs in Puerto Natales is typically December, while June often presents the lowest earnings, highlighting opportunities for strategic pricing adjustments during shoulder and low seasons. Explore the typical Airbnb income in Puerto Natales across different performance tiers:
- Best-in-class properties (Top 10%) achieve $1,927+ monthly, often utilizing dynamic pricing and superior guest experiences.
- Strong performing properties (Top 25%) earn $1,181 or more, indicating effective management and desirable locations/amenities.
- Typical properties (Median) generate around $729 per month, representing the average market performance.
- Entry-level properties (Bottom 25%) see earnings around $353, often with potential for optimization.
Average Monthly Airbnb Earnings Trend in Puerto Natales
Puerto Natales Airbnb Occupancy Rate Trends (2026)
Maximize your bookings by understanding the Puerto Natales STR occupancy trends. Seasonal demand shifts significantly influence how often properties are booked. Typically, Februarysees the highest demand (peak season occupancy), while June experiences the lowest (low season). Effective strategies, like adjusting minimum stays or offering promotions, can boost occupancy during slower periods. Here's how different property tiers perform in Puerto Natales:
- Best-in-class properties (Top 10%) achieve 75%+ occupancy, indicating high desirability and potentially optimized availability.
- Strong performing properties (Top 25%) maintain 59% or higher occupancy, suggesting good market fit and guest satisfaction.
- Typical properties (Median) have an occupancy rate around 39%.
- Entry-level properties (Bottom 25%) average 20% occupancy, potentially facing higher vacancy.
Average Monthly Occupancy Rate Trend in Puerto Natales
Average Daily Rate (ADR) Airbnb Trends in Puerto Natales (2026)
Effective short term rental pricing strategy in Puerto Natales involves understanding monthly ADR fluctuations. The Average Daily Rate (ADR) for Airbnb in Puerto Natales typically peaks in January and dips lowest during April. Leveraging Airbnb dynamic pricing tools or strategies based on this seasonality can significantly boost revenue. Here's a look at the typical nightly rates achieved:
- Best-in-class properties (Top 10%) command rates of $128+ per night, often due to premium features or locations.
- Strong performing properties (Top 25%) achieve nightly rates of $84 or more.
- Typical properties (Median) charge around $59 per night.
- Entry-level properties (Bottom 25%) earn around $45 per night.
Average Daily Rate (ADR) Trend by Month in Puerto Natales
Get Live Puerto Natales Market Intelligence 👇

Explore Real-time Analytics
Airbnb Seasonality Analysis & Trends in Puerto Natales (2026)
Peak Season (December, February, January)
- Revenue averages $1,373 per month
- Occupancy rates average 57.2%
- Daily rates average $81
Shoulder Season
- Revenue averages $942 per month
- Occupancy maintains around 39.2%
- Daily rates hold near $79
Low Season (May, June, August)
- Revenue drops to average $633 per month
- Occupancy decreases to average 26.8%
- Daily rates adjust to average $77
Seasonality Insights for Puerto Natales
- The Airbnb seasonality in Puerto Natales shows highly seasonal trends requiring careful strategy. While the sections above show seasonal averages, it's also insightful to look at the extremes:
- During the high season, the absolute peak month showcases Puerto Natales's highest earning potential, with monthly revenues capable of climbing to $1,411, occupancy reaching a high of 65.3%, and ADRs peaking at $83.
- Conversely, the slowest single month of the year, typically falling within the low season, marks the market's lowest point. In this month, revenue might dip to $533, occupancy could drop to 24.8%, and ADRs may adjust down to $74.
- Understanding both the seasonal averages and these monthly peaks and troughs in revenue, occupancy, and ADR is crucial for maximizing your Airbnb profit potential in Puerto Natales.
Seasonal Strategies for Maximizing Profit
- Peak Season: Maximize revenue through premium pricing and potentially longer minimum stays. Ensure high availability.
- Low Season: Offer competitive pricing, special promotions (e.g., extended stay discounts), and flexible cancellation policies. Target off-season travelers like remote workers or budget-conscious guests.
- Shoulder Seasons: Implement dynamic pricing that balances peak and low rates. Target weekend travelers or specific events. Offer slightly more flexible terms than peak season.
- Regularly analyze your own performance against these Puerto Natales seasonality benchmarks and adjust your pricing and availability strategy accordingly.
Best Areas for Airbnb Investment in Puerto Natales (2026)
Exploring the top neighborhoods for short-term rentals in Puerto Natales? This section highlights key areas, outlining why they are attractive for hosts and guests, along with notable local attractions. Consider these locations based on your target guest profile and investment strategy.
| Neighborhood / Area | Why Host Here? (Target Guests & Appeal) | Key Attractions & Landmarks |
|---|---|---|
| Torres del Paine | The iconic national park famous for its stunning mountains, glaciers, and lakes. A prime destination for adventure tourists and nature lovers, making it ideal for hosting travelers looking for unique experiences in the wilderness. | Torres del Paine National Park, Base Torres hike, Milodon Cave, Salto Grande, Lago Pehoé, Glaciar Grey |
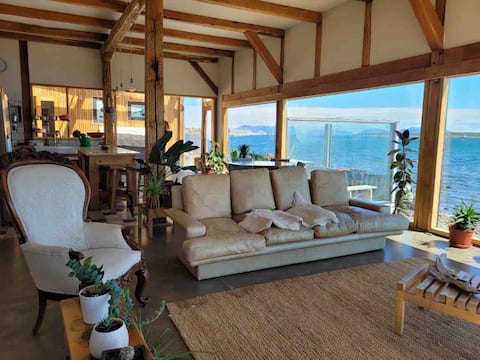
| Puerto Natales Waterfront | The scenic waterfront area of Puerto Natales with picturesque views of the fjords and mountains. This area is popular among tourists for its restaurants, shops, and access to boat tours in the surrounding waters. | Diver's Head, Costanera de Puerto Natales, Local craft shops, Restaurants and cafes, Boat tours to fjords |
| Historic Centre of Puerto Natales | The historic center features charming architecture and is close to key tourist amenities. It attracts visitors looking for cultural experiences, local cuisine, and a sense of community. | Muelle Historico, Plaza de Armas, Museo Histórico, Church of Puerto Natales, Local artisan markets |
| Cueva del Milodón | A natural monument that draws history and nature enthusiasts. Visitors can explore the historical significance of the cave and enjoy nearby hiking trails. | Cueva del Milodón Park, Hiking trails, Scenic viewpoints, Nature photography opportunities |
| Seno de Última Esperanza | A breathtaking fjord area close to Puerto Natales, perfect for those seeking natural beauty and adventure sports such as kayaking and fishing. | Kayaking tours, Fishing tours, Scenic boat rides, Wildlife watching |
| Hiking Trails of Puerto Natales | The surrounding areas of Puerto Natales offer several hiking trails leading to stunning viewpoints, attracting outdoor enthusiasts year-round. | Hiking to Cerro Doroté, Laguna Sofía, Sendero del Río La Cueva |
| Local Craft Markets | Visiting local markets offers tourists a taste of local culture and craftsmanship, making it a great area to experience the local community and shop for unique souvenirs. | Puerto Natales Craft Market, Food stalls, Artisan souvenirs, Local artists showcases |
| Adventure Tourism Base | With its proximity to national parks and fjords, this area serves as a base for adventure tourism activities, attracting both thrill-seekers and nature lovers. | Tour companies, Equipment rentals, Information centers for tours |
Understanding Airbnb License Requirements & STR Laws in Puerto Natales (2026)
While Puerto Natales, Magallanes and Chilean Antarctica Region, Chile currently shows low STR regulations, specific Airbnb license requirements might still exist or change. Always verify the latest short term rental regulations and Airbnb license requirements directly with local government authorities for Puerto Natales to ensure full compliance before hosting.
(Source: AirROI data, 2026, based on 2% licensed listings)
Top Performing Airbnb Properties in Puerto Natales (2026)
Benchmark your potential! Explore examples of top-performing Airbnb properties in Puerto Natalesbased on Trailing Twelve Month (TTM) revenue. Analyze their characteristics, revenue, occupancy rate, and ADR to understand what drives success in this market.

The Fjord House
Entire Place • 4 bedrooms

Water House
Entire Place • 3 bedrooms
My House Facing the Sea
Entire Place • 3 bedrooms
House with an unbeatable view “Mirador del Viento”
Entire Place • 4 bedrooms
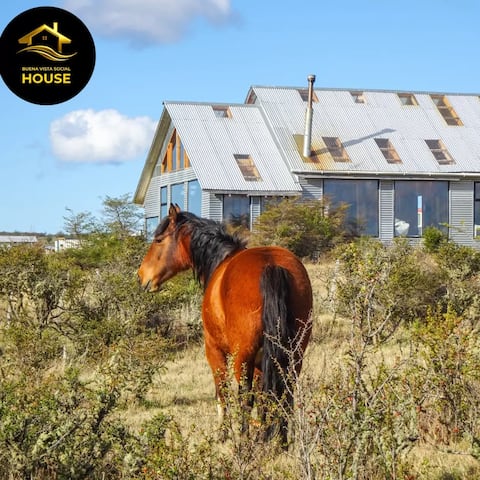
Buenavista Socialhouse, maximum 13 people
Entire Place • 5 bedrooms

Beautiful fully equipped cabins - #2
Entire Place • 2 bedrooms
Note: Performance varies based on location, size, amenities, seasonality, and management quality. Data reflects the past 12 months.
Top Performing Airbnb Hosts in Puerto Natales (2026)
Learn from the best! This table showcases top-performing Airbnb hosts in Puerto Natales based on the number of properties managed and estimated total revenue over the past year. Analyze their scale and performance metrics.
| Host Name | Properties | Grossing Revenue | Stay Reviews | Avg Rating |
|---|---|---|---|---|
| María Pilar | 3 | $133,533 | 195 | 4.89/5.0 |
| Carol | 2 | $119,193 | 255 | 4.91/5.0 |
| Luz | 2 | $107,878 | 316 | 4.94/5.0 |
| Puerto Bories House | 3 | $97,014 | 99 | 4.84/5.0 |
| Jose | 2 | $93,058 | 87 | 4.99/5.0 |
| Hector | 6 | $87,880 | 394 | 4.90/5.0 |
| Javier | 5 | $86,393 | 106 | 4.98/5.0 |
| Erwin | 4 | $85,979 | 741 | 4.93/5.0 |
| Carla | 7 | $82,745 | 470 | 4.89/5.0 |
| Lili | 6 | $74,900 | 1041 | 4.96/5.0 |
Analyzing the strategies of top hosts, such as their property selection, pricing, and guest communication, can offer valuable lessons for optimizing your own Airbnb operations in Puerto Natales.
Dive Deeper: Advanced Puerto Natales STR Market Data (2026)
Ready to unlock more insights? AirROI provides access to advanced metrics and comprehensive Airbnb data for Puerto Natales. Explore detailed analytics beyond this report to refine your investment strategy, optimize pricing, and maximize your vacation rental profits.
Explore Advanced MetricsPuerto Natales Short-Term Rental Market Composition (2026): Property & Room Types
Room Type Distribution
Property Type Distribution
Market Composition Insights for Puerto Natales
- The Puerto Natales Airbnb market composition is heavily skewed towards Entire Home/Apt listings, which make up 75.4% of the 558 active rentals. This indicates strong guest preference for privacy and space.
- Looking at the property type distribution in Puerto Natales, House properties are the most common (37.6%), reflecting the local real estate landscape.
- Houses represent a significant 37.6% portion, catering likely to families or larger groups.
- The presence of 10.6% Hotel/Boutique listings indicates integration with traditional hospitality.
- Smaller segments like others, unique stays (combined 3.6%) offer potential for unique stay experiences.
Puerto Natales Airbnb Room Capacity Analysis (2026): Bedroom Distribution
Distribution of Listings by Number of Bedrooms
Room Capacity Insights for Puerto Natales
- The dominant room capacity in Puerto Natales is 1 bedroom listings, making up 41% of the market. This suggests a strong demand for properties suitable for couples or solo travelers.
- Together, 1 bedroom and 2 bedrooms properties represent 73.4% of the active Airbnb listings in Puerto Natales, indicating a high concentration in these sizes.
Puerto Natales Vacation Rental Guest Capacity Trends (2026)
Distribution of Listings by Guest Capacity
Guest Capacity Insights for Puerto Natales
- The most common guest capacity trend in Puerto Natales vacation rentals is listings accommodating 2 guests (31.7%). This suggests the primary traveler segment is likely couples or solo travelers.
- Properties designed for 2 guests and 4 guests dominate the Puerto Natales STR market, accounting for 52.3% of listings.
- 10.3% of properties accommodate 6+ guests, serving the market segment for larger families or group travel in Puerto Natales.
- On average, properties in Puerto Natales are equipped to host 3.0 guests.
Puerto Natales Airbnb Booking Patterns (2026): Available vs. Booked Days
Available Days Distribution
Booked Days Distribution
Booking Pattern Insights for Puerto Natales
- The most common availability pattern in Puerto Natales falls within the 271-366 days range, representing 47.8% of listings. This suggests many properties have significant open periods on their calendars.
- Approximately 80.4% of listings show high availability (181+ days open annually), indicating potential for increased bookings or specific owner usage patterns.
- For booked days, the 91-180 days range is most frequent in Puerto Natales (33.2%), reflecting common guest stay durations or potential owner blocking patterns.
- A notable 20.8% of properties secure long booking periods (181+ days booked per year), highlighting successful long-term rental strategies or significant owner usage.
Puerto Natales Airbnb Minimum Stay Requirements Analysis
Distribution of Listings by Minimum Night Requirement
1 Night
260 listings
46.6% of total
2 Nights
162 listings
29% of total
3 Nights
3 listings
0.5% of total
4-6 Nights
2 listings
0.4% of total
30+ Nights
131 listings
23.5% of total
Key Insights
- The most prevalent minimum stay requirement in Puerto Natales is 1 Night, adopted by 46.6% of listings. This highlights the market's preference for shorter, flexible bookings.
- A strong majority (75.6%) of the Puerto Natales Airbnb data shows acceptance of very short stays (1-2 nights), indicating a dynamic, high-turnover market.
- A significant segment (23.5%) caters to monthly stays (30+ nights) in Puerto Natales, pointing to opportunities in the extended-stay market.
Recommendations
- Align with the market by considering a 1 Night minimum stay, as 46.6% of Puerto Natales hosts use this setting.
- Explore offering discounts for stays of 30+ nights to attract the 23.5% of the market seeking extended stays.
- Adjust minimum nights based on seasonality – potentially shorter during low season and longer during peak demand periods in Puerto Natales.
Puerto Natales Airbnb Cancellation Policy Trends Analysis (2026)
Limited
25 listings
4.5% of total
Super Strict 30 Days
7 listings
1.3% of total
Flexible
241 listings
43.3% of total
Moderate
152 listings
27.3% of total
Firm
115 listings
20.6% of total
Strict
17 listings
3.1% of total
Cancellation Policy Insights for Puerto Natales
- The prevailing Airbnb cancellation policy trend in Puerto Natales is Flexible, used by 43.3% of listings.
- The market strongly favors guest-friendly terms, with 70.6% of listings offering Flexible or Moderate policies. This suggests guests in Puerto Natales may expect booking flexibility.
- Strict cancellation policies are quite rare (3.1%), potentially making listings with this policy less competitive unless justified by high demand or property type.
Recommendations for Hosts
- Consider adopting a Flexible policy to align with the 43.3% market standard in Puerto Natales.
- Using a Strict policy might deter some guests, as only 3.1% of listings use it. Evaluate if potential revenue protection outweighs possible lower booking rates.
- Regularly review your cancellation policy against competitors and market demand shifts in Puerto Natales.
Puerto Natales STR Booking Lead Time Analysis (2026)
Average Booking Lead Time by Month
Booking Lead Time Insights for Puerto Natales
- The overall average booking lead time for vacation rentals in Puerto Natales is 43 days.
- Guests book furthest in advance for stays during November (average 61 days), likely coinciding with peak travel demand or local events.
- The shortest booking windows occur for stays in June (average 25 days), indicating more last-minute travel plans during this time.
- Seasonally, Winter (51 days avg.) sees the longest lead times, while Spring (31 days avg.) has the shortest, reflecting typical travel planning cycles.
Recommendations for Hosts
- Use the overall average lead time (43 days) as a baseline for your pricing and availability strategy in Puerto Natales.
- For November stays, consider implementing length-of-stay discounts or slightly higher rates for bookings made less than 61 days out to capitalize on advance planning.
- Target marketing efforts for the Winter season well in advance (at least 51 days) to capture early planners.
- Monitor your own booking lead times against these Puerto Natales averages to identify opportunities for dynamic pricing adjustments.
Popular & Essential Airbnb Amenities in Puerto Natales (2026)
Amenity Prevalence
Amenity Insights for Puerto Natales
- Essential amenities in Puerto Natales that guests expect include: Wifi. Lacking these (this) could significantly impact bookings.
- Popular amenities like Heating, Hot water, TV are common but not universal. Offering these can provide a competitive edge.
Recommendations for Hosts
- Ensure your listing includes all essential amenities for Puerto Natales: Wifi.
- Prioritize adding missing essentials: Wifi.
- Consider adding popular differentiators like Heating or Hot water to increase appeal.
- Highlight unique or less common amenities you offer (e.g., hot tub, dedicated workspace, EV charger) in your listing description and photos.
- Regularly check competitor amenities in Puerto Natales to stay competitive.
Puerto Natales Airbnb Guest Demographics & Profile Analysis (2026)
Guest Profile Summary for Puerto Natales
- The typical guest profile for Airbnb in Puerto Natales consists of predominantly international visitors (79%), with top international origins including Chile, typically belonging to the Post-2000s (Gen Z/Alpha) group (50%), primarily speaking English or Spanish.
- Domestic travelers account for 20.7% of guests.
- Key international markets include United States (21.9%) and Chile (20.7%).
- Top languages spoken are English (42.1%) followed by Spanish (27.1%).
- A significant demographic segment is the Post-2000s (Gen Z/Alpha) group, representing 50% of guests.
Recommendations for Hosts
- Focus marketing internationally, particularly towards travelers from Chile.
- Tailor amenities and listing descriptions to appeal to the dominant Post-2000s (Gen Z/Alpha) demographic (e.g., highlight fast WiFi, smart home features, local guides).
- Highlight unique local experiences or amenities relevant to the primary guest profile.
- Consider seasonal promotions aligned with peak travel times for key origin markets.
Nearby Short-Term Rental Market Comparison
How does the Puerto Natales Airbnb market stack up against its neighbors? Compare key performance metrics like average monthly revenue, ADR, and occupancy rates in surrounding areas to understand the broader regional STR landscape.
| Market | Active Properties | Monthly Revenue | Daily Rate | Avg. Occupancy |
|---|---|---|---|---|
| Torres del Paine | 13 | $2,952 | $253.13 | 56% |
| El Calafate | 721 | $620 | $78.20 | 37% |