Linares Airbnb Market Analysis 2026: Short Term Rental Data & Vacation Rental Statistics in Maule Region, Chile
Is Airbnb profitable in Linares in 2026? Explore comprehensive Airbnb analytics for Linares, Maule Region, Chile to uncover income potential. This 2026 STR market report for Linares, based on AirROI data from February 2025 to January 2026, reveals key trends in the niche market of 66 active listings.
Whether you're considering an Airbnb investment in Linares, optimizing your existing vacation rental, or exploring rental arbitrage opportunities, understanding the Linares Airbnb data is crucial. Leveraging the low regulation environment is key to maximizing your short term rental income potential. Let's dive into the specifics.
Key Linares Airbnb Performance Metrics Overview
Monthly Airbnb Revenue Variations & Income Potential in Linares (2026)
Understanding the monthly revenue variations for Airbnb listings in Linares is key to maximizing your short term rental income potential. Seasonality significantly impacts earnings. Our analysis, based on data from the past 12 months, shows that the peak revenue month for STRs in Linares is typically February, while October often presents the lowest earnings, highlighting opportunities for strategic pricing adjustments during shoulder and low seasons. Explore the typical Airbnb income in Linares across different performance tiers:
- Best-in-class properties (Top 10%) achieve $1,078+ monthly, often utilizing dynamic pricing and superior guest experiences.
- Strong performing properties (Top 25%) earn $676 or more, indicating effective management and desirable locations/amenities.
- Typical properties (Median) generate around $368 per month, representing the average market performance.
- Entry-level properties (Bottom 25%) see earnings around $184, often with potential for optimization.
Average Monthly Airbnb Earnings Trend in Linares
Linares Airbnb Occupancy Rate Trends (2026)
Maximize your bookings by understanding the Linares STR occupancy trends. Seasonal demand shifts significantly influence how often properties are booked. Typically, Februarysees the highest demand (peak season occupancy), while May experiences the lowest (low season). Effective strategies, like adjusting minimum stays or offering promotions, can boost occupancy during slower periods. Here's how different property tiers perform in Linares:
- Best-in-class properties (Top 10%) achieve 55%+ occupancy, indicating high desirability and potentially optimized availability.
- Strong performing properties (Top 25%) maintain 36% or higher occupancy, suggesting good market fit and guest satisfaction.
- Typical properties (Median) have an occupancy rate around 20%.
- Entry-level properties (Bottom 25%) average 10% occupancy, potentially facing higher vacancy.
Average Monthly Occupancy Rate Trend in Linares
Average Daily Rate (ADR) Airbnb Trends in Linares (2026)
Effective short term rental pricing strategy in Linares involves understanding monthly ADR fluctuations. The Average Daily Rate (ADR) for Airbnb in Linares typically peaks in January and dips lowest during February. Leveraging Airbnb dynamic pricing tools or strategies based on this seasonality can significantly boost revenue. Here's a look at the typical nightly rates achieved:
- Best-in-class properties (Top 10%) command rates of $94+ per night, often due to premium features or locations.
- Strong performing properties (Top 25%) achieve nightly rates of $75 or more.
- Typical properties (Median) charge around $63 per night.
- Entry-level properties (Bottom 25%) earn around $49 per night.
Average Daily Rate (ADR) Trend by Month in Linares
Get Live Linares Market Intelligence 👇

Explore Real-time Analytics
Airbnb Seasonality Analysis & Trends in Linares (2026)
Peak Season (February, July, January)
- Revenue averages $710 per month
- Occupancy rates average 34.8%
- Daily rates average $69
Shoulder Season
- Revenue averages $484 per month
- Occupancy maintains around 24.2%
- Daily rates hold near $69
Low Season (April, May, October)
- Revenue drops to average $384 per month
- Occupancy decreases to average 20.8%
- Daily rates adjust to average $69
Seasonality Insights for Linares
- The Airbnb seasonality in Linares shows highly seasonal trends requiring careful strategy. While the sections above show seasonal averages, it's also insightful to look at the extremes:
- During the high season, the absolute peak month showcases Linares's highest earning potential, with monthly revenues capable of climbing to $855, occupancy reaching a high of 46.8%, and ADRs peaking at $71.
- Conversely, the slowest single month of the year, typically falling within the low season, marks the market's lowest point. In this month, revenue might dip to $368, occupancy could drop to 19.8%, and ADRs may adjust down to $67.
- Understanding both the seasonal averages and these monthly peaks and troughs in revenue, occupancy, and ADR is crucial for maximizing your Airbnb profit potential in Linares.
Seasonal Strategies for Maximizing Profit
- Peak Season: Maximize revenue through premium pricing and potentially longer minimum stays. Ensure high availability.
- Low Season: Offer competitive pricing, special promotions (e.g., extended stay discounts), and flexible cancellation policies. Target off-season travelers like remote workers or budget-conscious guests.
- Shoulder Seasons: Implement dynamic pricing that balances peak and low rates. Target weekend travelers or specific events. Offer slightly more flexible terms than peak season.
- Regularly analyze your own performance against these Linares seasonality benchmarks and adjust your pricing and availability strategy accordingly.
Best Areas for Airbnb Investment in Linares (2026)
Exploring the top neighborhoods for short-term rentals in Linares? This section highlights key areas, outlining why they are attractive for hosts and guests, along with notable local attractions. Consider these locations based on your target guest profile and investment strategy.
| Neighborhood / Area | Why Host Here? (Target Guests & Appeal) | Key Attractions & Landmarks |
|---|---|---|
| Linares City Center | The vibrant heart of Linares, offering access to shops, restaurants, and cultural sites. Ideal for travelers who want to experience the local culture and enjoy proximity to amenities. | Linares Civic Plaza, Museo de Linares, Iglesia San Francisco, Catedral de Linares |
| Railway Museum Area | A unique historical area featuring the old railway station, attracting visitors interested in Linares' rich heritage and transport history. Perfect for history buffs and families. | Museo Ferroviario, Parque de Linares, Estación Linares |
| Alameda | A picturesque avenue lined with trees and local businesses, providing a charming environment for tourists. Great for those looking to soak in the local lifestyle while staying close to the center. | Plaza de Armas, Teatro Municipal, Cafés and local shops |
| Curicó | Near Linares, this region is known for its wine production, vineyards, and beautiful landscapes. Attracts tourists looking for wine tours and rural experiences. | Vineyards, Curicó Wine Route, Parque O'Higgins |
| Colbún Lake | A stunning natural area perfect for eco-tourism and relaxation. Ideal for visitors who enjoy outdoor activities such as hiking, fishing, and bird watching. | Colbún Lake, Parque Nacional Radal Siete Tazas, Water sports activities |
| San Javier | A nearby town rich in culture and traditional Chilean cuisine. Attracts those looking to experience local gastronomy and craft markets. | Plaza de San Javier, Craft markets, Local dining options |
| Los Queñes | Known for its beautiful landscapes and outdoor activities, this area is perfect for adventure seekers and nature lovers. | Rivers and trekking paths, Natural reserves, Camping sites |
| Putagán | A small community known for its rich traditions and scenic views, offering a peaceful retreat for those looking to escape the city bustle. | Local artisan markets, Scenic viewpoints, Nature trails |
Understanding Airbnb License Requirements & STR Laws in Linares (2026)
While Linares, Maule Region, Chile currently shows low STR regulations, specific Airbnb license requirements might still exist or change. Always verify the latest short term rental regulations and Airbnb license requirements directly with local government authorities for Linares to ensure full compliance before hosting.
(Source: AirROI data, 2026, based on 2% licensed listings)
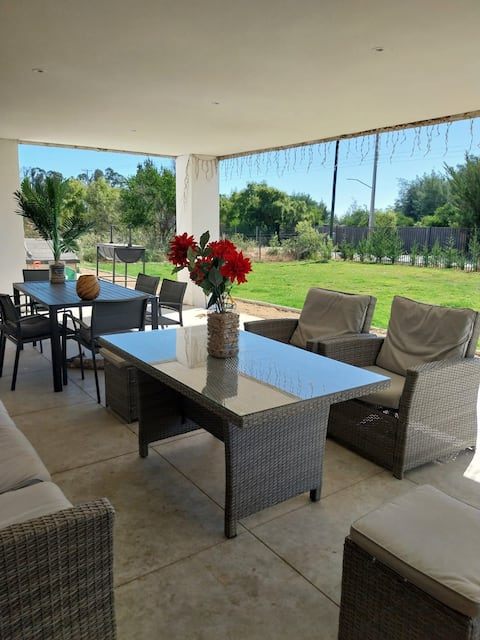
Top Performing Airbnb Properties in Linares (2026)
Benchmark your potential! Explore examples of top-performing Airbnb properties in Linaresbased on Trailing Twelve Month (TTM) revenue. Analyze their characteristics, revenue, occupancy rate, and ADR to understand what drives success in this market.
mediterranean house on plot
Entire Place • 4 bedrooms

Accommodation in Linares
Entire Place • 3 bedrooms

Cabin overlooking the river hot tub in Parque Guaiquivilo
Entire Place • 2 bedrooms

3-bedroom apartment
Entire Place • 3 bedrooms

Nice apartment in Linares
Entire Place • 3 bedrooms

Central apartment with covered parking 3D/1B/1E
Entire Place • 3 bedrooms
Note: Performance varies based on location, size, amenities, seasonality, and management quality. Data reflects the past 12 months.
Top Performing Airbnb Hosts in Linares (2026)
Learn from the best! This table showcases top-performing Airbnb hosts in Linares based on the number of properties managed and estimated total revenue over the past year. Analyze their scale and performance metrics.
| Host Name | Properties | Grossing Revenue | Stay Reviews | Avg Rating |
|---|---|---|---|---|
| Andrés | 1 | $18,013 | 26 | 4.92/5.0 |
| Elisa | 2 | $15,240 | 17 | 5.00/5.0 |
| Nicol | 2 | $13,022 | 151 | 4.83/5.0 |
| Jeniffer | 1 | $12,849 | 84 | 4.98/5.0 |
| Beatriz | 3 | $10,450 | 141 | 4.97/5.0 |
| Filipo | 2 | $8,838 | 92 | 4.95/5.0 |
| Claudio | 1 | $8,533 | 89 | 4.83/5.0 |
| Icha Alejandra | 1 | $7,298 | 80 | 4.93/5.0 |
| Maritza | 1 | $7,296 | 74 | 4.93/5.0 |
| Jacqueline | 3 | $7,165 | 14 | 4.70/5.0 |
Analyzing the strategies of top hosts, such as their property selection, pricing, and guest communication, can offer valuable lessons for optimizing your own Airbnb operations in Linares.
Dive Deeper: Advanced Linares STR Market Data (2026)
Ready to unlock more insights? AirROI provides access to advanced metrics and comprehensive Airbnb data for Linares. Explore detailed analytics beyond this report to refine your investment strategy, optimize pricing, and maximize your vacation rental profits.
Explore Advanced MetricsLinares Short-Term Rental Market Composition (2026): Property & Room Types
Room Type Distribution
Property Type Distribution
Market Composition Insights for Linares
- The Linares Airbnb market composition is heavily skewed towards Entire Home/Apt listings, which make up 83.3% of the 66 active rentals. This indicates strong guest preference for privacy and space.
- Looking at the property type distribution in Linares, Outdoor/Unique properties are the most common (53%), reflecting the local real estate landscape.
- Houses represent a significant 25.8% portion, catering likely to families or larger groups.
- Smaller segments like hotel/boutique, others (combined 7.5%) offer potential for unique stay experiences.
Linares Airbnb Room Capacity Analysis (2026): Bedroom Distribution
Distribution of Listings by Number of Bedrooms
Room Capacity Insights for Linares
- The dominant room capacity in Linares is 2 bedrooms listings, making up 36.4% of the market. This suggests a strong demand for properties suitable for couples or solo travelers.
- Together, 2 bedrooms and 3 bedrooms properties represent 66.7% of the active Airbnb listings in Linares, indicating a high concentration in these sizes.
- A significant 39.4% of listings offer 3+ bedrooms, catering to larger groups and families seeking more space in Linares.
Linares Vacation Rental Guest Capacity Trends (2026)
Distribution of Listings by Guest Capacity
Guest Capacity Insights for Linares
- The most common guest capacity trend in Linares vacation rentals is listings accommodating 4 guests (27.3%). This suggests the primary traveler segment is likely small families or groups.
- Properties designed for 4 guests and 5 guests dominate the Linares STR market, accounting for 48.5% of listings.
- 33.3% of properties accommodate 6+ guests, serving the market segment for larger families or group travel in Linares.
- On average, properties in Linares are equipped to host 4.6 guests.
Linares Airbnb Booking Patterns (2026): Available vs. Booked Days
Available Days Distribution
Booked Days Distribution
Booking Pattern Insights for Linares
- The most common availability pattern in Linares falls within the 271-366 days range, representing 89.4% of listings. This suggests many properties have significant open periods on their calendars.
- Approximately 98.5% of listings show high availability (181+ days open annually), indicating potential for increased bookings or specific owner usage patterns.
- For booked days, the 1-30 days range is most frequent in Linares (48.5%), reflecting common guest stay durations or potential owner blocking patterns.
- A notable 1.5% of properties secure long booking periods (181+ days booked per year), highlighting successful long-term rental strategies or significant owner usage.
Linares Airbnb Minimum Stay Requirements Analysis
Distribution of Listings by Minimum Night Requirement
1 Night
33 listings
50% of total
2 Nights
20 listings
30.3% of total
3 Nights
3 listings
4.5% of total
4-6 Nights
1 listings
1.5% of total
30+ Nights
9 listings
13.6% of total
Key Insights
- The most prevalent minimum stay requirement in Linares is 1 Night, adopted by 50% of listings. This highlights the market's preference for shorter, flexible bookings.
- A strong majority (80.3%) of the Linares Airbnb data shows acceptance of very short stays (1-2 nights), indicating a dynamic, high-turnover market.
- A significant segment (13.6%) caters to monthly stays (30+ nights) in Linares, pointing to opportunities in the extended-stay market.
Recommendations
- Align with the market by considering a 1 Night minimum stay, as 50% of Linares hosts use this setting.
- Explore offering discounts for stays of 30+ nights to attract the 13.6% of the market seeking extended stays.
- Adjust minimum nights based on seasonality – potentially shorter during low season and longer during peak demand periods in Linares.
Linares Airbnb Cancellation Policy Trends Analysis (2026)
Limited
1 listings
1.5% of total
Flexible
35 listings
53% of total
Moderate
22 listings
33.3% of total
Firm
8 listings
12.1% of total
Cancellation Policy Insights for Linares
- The prevailing Airbnb cancellation policy trend in Linares is Flexible, used by 53% of listings.
- The market strongly favors guest-friendly terms, with 86.3% of listings offering Flexible or Moderate policies. This suggests guests in Linares may expect booking flexibility.
Recommendations for Hosts
- Consider adopting a Flexible policy to align with the 53% market standard in Linares.
- Given the high prevalence of Flexible policies (53%), offering this can enhance booking appeal, especially during shoulder seasons.
- Regularly review your cancellation policy against competitors and market demand shifts in Linares.
Linares STR Booking Lead Time Analysis (2026)
Average Booking Lead Time by Month
Booking Lead Time Insights for Linares
- The overall average booking lead time for vacation rentals in Linares is 12 days.
- Guests book furthest in advance for stays during September (average 25 days), likely coinciding with peak travel demand or local events.
- The shortest booking windows occur for stays in March (average 6 days), indicating more last-minute travel plans during this time.
- Seasonally, Winter (15 days avg.) sees the longest lead times, while Spring (10 days avg.) has the shortest, reflecting typical travel planning cycles.
Recommendations for Hosts
- Use the overall average lead time (12 days) as a baseline for your pricing and availability strategy in Linares.
- For September stays, consider implementing length-of-stay discounts or slightly higher rates for bookings made less than 25 days out to capitalize on advance planning.
- Target marketing efforts for the Winter season well in advance (at least 15 days) to capture early planners.
- Monitor your own booking lead times against these Linares averages to identify opportunities for dynamic pricing adjustments.
Popular & Essential Airbnb Amenities in Linares (2026)
Amenity Prevalence
Amenity Insights for Linares
- Essential amenities in Linares that guests expect include: Free parking on premises. Lacking these (this) could significantly impact bookings.
- Popular amenities like TV, Kitchen, Hot water are common but not universal. Offering these can provide a competitive edge.
- Warning: Wifi is not universally provided but is considered essential globally. Ensure reliable Wifi is offered.
Recommendations for Hosts
- Ensure your listing includes all essential amenities for Linares: Free parking on premises.
- Prioritize adding missing essentials: Free parking on premises.
- Consider adding popular differentiators like TV or Kitchen to increase appeal.
- Highlight unique or less common amenities you offer (e.g., hot tub, dedicated workspace, EV charger) in your listing description and photos.
- Regularly check competitor amenities in Linares to stay competitive.
Linares Airbnb Guest Demographics & Profile Analysis (2026)
Guest Profile Summary for Linares
- The typical guest profile for Airbnb in Linares consists of primarily domestic travelers (87%), often arriving from nearby Santiago, typically belonging to the Post-2000s (Gen Z/Alpha) group (50%), primarily speaking Spanish or English.
- Domestic travelers account for 87.1% of guests.
- Key international markets include Chile (87.1%) and Colombia (2.4%).
- Top languages spoken are Spanish (58.2%) followed by English (32.8%).
- A significant demographic segment is the Post-2000s (Gen Z/Alpha) group, representing 50% of guests.
Recommendations for Hosts
- Target domestic marketing efforts towards travelers from Santiago and Valparaíso.
- Tailor amenities and listing descriptions to appeal to the dominant Post-2000s (Gen Z/Alpha) demographic (e.g., highlight fast WiFi, smart home features, local guides).
- Highlight unique local experiences or amenities relevant to the primary guest profile.
- Consider seasonal promotions aligned with peak travel times for key origin markets.
Nearby Short-Term Rental Market Comparison
How does the Linares Airbnb market stack up against its neighbors? Compare key performance metrics like average monthly revenue, ADR, and occupancy rates in surrounding areas to understand the broader regional STR landscape.
| Market | Active Properties | Monthly Revenue | Daily Rate | Avg. Occupancy |
|---|---|---|---|---|
| Litueche | 68 | $1,254 | $224.62 | 26% |
| Las Cabras | 179 | $1,137 | $219.49 | 27% |
| La Estrella | 21 | $1,078 | $288.44 | 24% |
| Las Leñas | 69 | $884 | $223.69 | 38% |
| Pinto | 424 | $816 | $145.46 | 28% |
| Las Trancas | 18 | $816 | $159.21 | 34% |
| Santa Cruz | 106 | $764 | $120.04 | 22% |
| Rengo | 13 | $753 | $145.00 | 22% |
| Palmilla | 13 | $697 | $112.08 | 25% |
| Pichilemu | 1,158 | $648 | $122.60 | 26% |