Parral Airbnb Market Analysis 2026: Short Term Rental Data & Vacation Rental Statistics in Maule Region, Chile
Is Airbnb profitable in Parral in 2026? Explore comprehensive Airbnb analytics for Parral, Maule Region, Chile to uncover income potential. This 2026 STR market report for Parral, based on AirROI data from December 2024 to November 2025, reveals key trends in the niche market of 18 active listings.
Whether you're considering an Airbnb investment in Parral, optimizing your existing vacation rental, or exploring rental arbitrage opportunities, understanding the Parral Airbnb data is crucial. Leveraging the low regulation environment is key to maximizing your short term rental income potential. Let's dive into the specifics.
Key Parral Airbnb Performance Metrics Overview
Monthly Airbnb Revenue Variations & Income Potential in Parral (2026)
Understanding the monthly revenue variations for Airbnb listings in Parral is key to maximizing your short term rental income potential. Seasonality significantly impacts earnings. Our analysis, based on data from the past 12 months, shows that the peak revenue month for STRs in Parral is typically February, while August often presents the lowest earnings, highlighting opportunities for strategic pricing adjustments during shoulder and low seasons. Explore the typical Airbnb income in Parral across different performance tiers:
- Best-in-class properties (Top 10%) achieve $1,128+ monthly, often utilizing dynamic pricing and superior guest experiences.
- Strong performing properties (Top 25%) earn $462 or more, indicating effective management and desirable locations/amenities.
- Typical properties (Median) generate around $311 per month, representing the average market performance.
- Entry-level properties (Bottom 25%) see earnings around $209, often with potential for optimization.
Average Monthly Airbnb Earnings Trend in Parral
Parral Airbnb Occupancy Rate Trends (2026)
Maximize your bookings by understanding the Parral STR occupancy trends. Seasonal demand shifts significantly influence how often properties are booked. Typically, Februarysees the highest demand (peak season occupancy), while August experiences the lowest (low season). Effective strategies, like adjusting minimum stays or offering promotions, can boost occupancy during slower periods. Here's how different property tiers perform in Parral:
- Best-in-class properties (Top 10%) achieve 33%+ occupancy, indicating high desirability and potentially optimized availability.
- Strong performing properties (Top 25%) maintain 22% or higher occupancy, suggesting good market fit and guest satisfaction.
- Typical properties (Median) have an occupancy rate around 14%.
- Entry-level properties (Bottom 25%) average 9% occupancy, potentially facing higher vacancy.
Average Monthly Occupancy Rate Trend in Parral
Average Daily Rate (ADR) Airbnb Trends in Parral (2026)
Effective short term rental pricing strategy in Parral involves understanding monthly ADR fluctuations. The Average Daily Rate (ADR) for Airbnb in Parral typically peaks in July and dips lowest during January. Leveraging Airbnb dynamic pricing tools or strategies based on this seasonality can significantly boost revenue. Here's a look at the typical nightly rates achieved:
- Best-in-class properties (Top 10%) command rates of $127+ per night, often due to premium features or locations.
- Strong performing properties (Top 25%) achieve nightly rates of $96 or more.
- Typical properties (Median) charge around $70 per night.
- Entry-level properties (Bottom 25%) earn around $61 per night.
Average Daily Rate (ADR) Trend by Month in Parral
Get Live Parral Market Intelligence 👇

Explore Real-time Analytics
Airbnb Seasonality Analysis & Trends in Parral (2025)
Peak Season (February, January, May)
- Revenue averages $867 per month
- Occupancy rates average 29.5%
- Daily rates average $81
Shoulder Season
- Revenue averages $389 per month
- Occupancy maintains around 15.4%
- Daily rates hold near $83
Low Season (July, August, October)
- Revenue drops to average $136 per month
- Occupancy decreases to average 6.6%
- Daily rates adjust to average $85
Seasonality Insights for Parral
- The Airbnb seasonality in Parral shows highly seasonal trends requiring careful strategy. While the sections above show seasonal averages, it's also insightful to look at the extremes:
- During the high season, the absolute peak month showcases Parral's highest earning potential, with monthly revenues capable of climbing to $962, occupancy reaching a high of 42.6%, and ADRs peaking at $86.
- Conversely, the slowest single month of the year, typically falling within the low season, marks the market's lowest point. In this month, revenue might dip to $94, occupancy could drop to 4.9%, and ADRs may adjust down to $79.
- Understanding both the seasonal averages and these monthly peaks and troughs in revenue, occupancy, and ADR is crucial for maximizing your Airbnb profit potential in Parral.
Seasonal Strategies for Maximizing Profit
- Peak Season: Maximize revenue through premium pricing and potentially longer minimum stays. Ensure high availability.
- Low Season: Offer competitive pricing, special promotions (e.g., extended stay discounts), and flexible cancellation policies. Target off-season travelers like remote workers or budget-conscious guests.
- Shoulder Seasons: Implement dynamic pricing that balances peak and low rates. Target weekend travelers or specific events. Offer slightly more flexible terms than peak season.
- Regularly analyze your own performance against these Parral seasonality benchmarks and adjust your pricing and availability strategy accordingly.
Best Areas for Airbnb Investment in Parral (2026)
Exploring the top neighborhoods for short-term rentals in Parral? This section highlights key areas, outlining why they are attractive for hosts and guests, along with notable local attractions. Consider these locations based on your target guest profile and investment strategy.
| Neighborhood / Area | Why Host Here? (Target Guests & Appeal) | Key Attractions & Landmarks |
|---|---|---|
| Parral City Center | The heart of Parral, offering easy access to restaurants, shops, and cultural attractions. Ideal for tourists looking to explore the local life and enjoy the city's amenities. | Plaza de Armas, Museo Histórico de Parral, Teatro de Parral, Catedral de Parral, local markets |
| Surrounding Wine Regions | Parral is close to renowned wine regions, making it attractive for wine enthusiasts. Visitors can enjoy wine tours and tastings, enhancing the appeal for tourists. | Wine tours, Local vineyards, Wine tastings, Cajón del Maipo, Cultural events |
| Cerro La Virgen | A scenic area that offers outdoor activities and stunning views. Perfect for nature lovers and those looking to escape the city for hiking and relaxation. | Hiking trails, Natural viewpoints, Biking routes, Picnic areas |
| Las Delicias | A tranquil residential area with green spaces, appealing to families and travelers seeking a quieter stay, yet still close to the city attractions. | Parks, Family-friendly spaces, Local restaurants, Community events |
| El Maqui | An emerging neighborhood that is attracting more visitors due to its affordable lodging and proximity to nature adventures. Great for adventurous tourists. | Outdoor activities, Recreation areas, Proximity to the river, Cultural sites |
| Parral's Riverside | A picturesque area along the river, providing scenic views and a relaxing atmosphere. Ideal for tourists looking for peaceful surroundings with easy access to the city. | Riverside parks, Walking paths, Fishing spots, Scenic views |
| Cultural District | Home to historical sites and cultural landmarks, this district attracts tourists interested in discovering the history and culture of Parral. | Historical museums, Cultural festivals, Art galleries, Local heritage sites |
| Nearby Recreational Areas | Locations just outside of Parral, perfect for outdoor enthusiasts with opportunities for camping, hiking, and exploring nature. | National parks, Camping sites, Wildlife observation, Nature trails |
Understanding Airbnb License Requirements & STR Laws in Parral (2026)
While Parral, Maule Region, Chile currently shows low STR regulations, specific Airbnb license requirements might still exist or change. Always verify the latest short term rental regulations and Airbnb license requirements directly with local government authorities for Parral to ensure full compliance before hosting.
(Source: AirROI data, 2026, finding no licensed listings among those analyzed)
Top Performing Airbnb Properties in Parral (2026)
Benchmark your potential! Explore examples of top-performing Airbnb properties in Parralbased on Trailing Twelve Month (TTM) revenue. Analyze their characteristics, revenue, occupancy rate, and ADR to understand what drives success in this market.
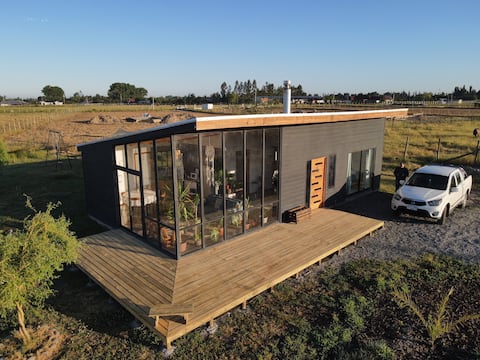
Grand and Spectacular House in Parral
Entire Place • 4 bedrooms
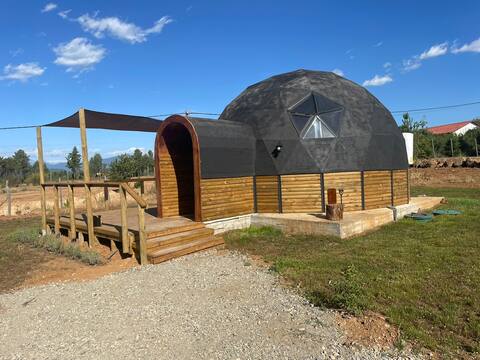
domo afrodita
Entire Place • 1 bedroom
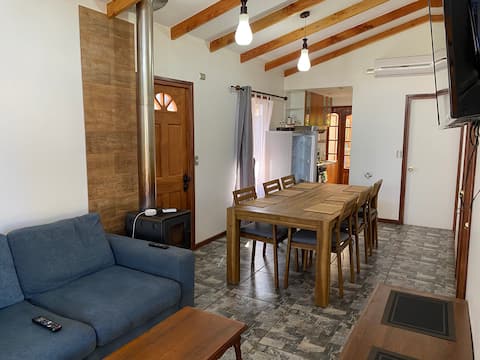
Vigas del Bosque
Entire Place • 3 bedrooms
House plot 4 minutes from Parral, with a water tank (extra)
Entire Place • 2 bedrooms
El Zorro Cabin
Entire Place • 2 bedrooms
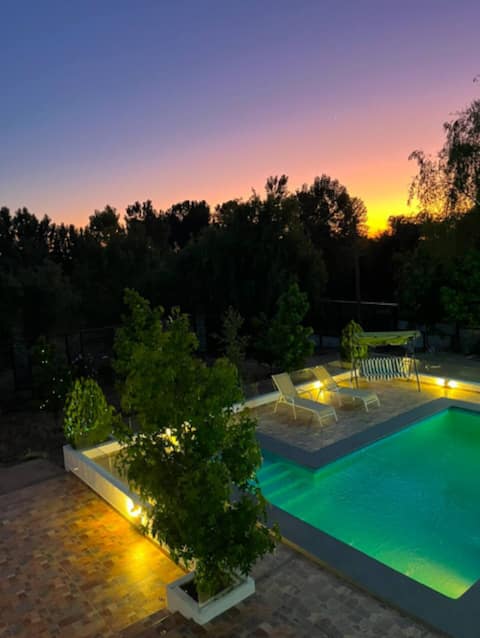
Parral Cottage and Pool
Entire Place • 3 bedrooms
Note: Performance varies based on location, size, amenities, seasonality, and management quality. Data reflects the past 12 months.
Top Performing Airbnb Hosts in Parral (2026)
Learn from the best! This table showcases top-performing Airbnb hosts in Parral based on the number of properties managed and estimated total revenue over the past year. Analyze their scale and performance metrics.
| Host Name | Properties | Grossing Revenue | Stay Reviews | Avg Rating |
|---|---|---|---|---|
| Nicolaas | 1 | $17,239 | 14 | 5.00/5.0 |
| Claudia | 4 | $12,408 | 38 | 4.97/5.0 |
| Juan Pablo | 3 | $11,032 | 63 | 4.84/5.0 |
| Carmen Gloria | 3 | $6,610 | 14 | 4.89/5.0 |
| Estefano | 1 | $4,065 | 21 | 4.95/5.0 |
| Maria | 1 | $3,598 | 1 | Not Rated |
| Filipo | 2 | $2,177 | 15 | 4.50/5.0 |
| Daniel | 1 | $1,127 | 2 | Not Rated |
| Adolfo | 1 | $886 | 7 | 4.43/5.0 |
| Rodrigo | 1 | $619 | 5 | 5.00/5.0 |
Analyzing the strategies of top hosts, such as their property selection, pricing, and guest communication, can offer valuable lessons for optimizing your own Airbnb operations in Parral.
Dive Deeper: Advanced Parral STR Market Data (2026)
Ready to unlock more insights? AirROI provides access to advanced metrics and comprehensive Airbnb data for Parral. Explore detailed analytics beyond this report to refine your investment strategy, optimize pricing, and maximize your vacation rental profits.
Explore Advanced MetricsParral Short-Term Rental Market Composition (2026): Property & Room Types
Room Type Distribution
Property Type Distribution
Market Composition Insights for Parral
- The Parral Airbnb market composition is heavily skewed towards Entire Home/Apt listings, which make up 100% of the 18 active rentals. This indicates strong guest preference for privacy and space.
- Looking at the property type distribution in Parral, Outdoor/Unique properties are the most common (38.9%), reflecting the local real estate landscape.
- Houses represent a significant 27.8% portion, catering likely to families or larger groups.
Parral Airbnb Room Capacity Analysis (2026): Bedroom Distribution
Distribution of Listings by Number of Bedrooms
Room Capacity Insights for Parral
- The dominant room capacity in Parral is 2 bedrooms listings, making up 50% of the market. This suggests a strong demand for properties suitable for couples or solo travelers.
- Together, 2 bedrooms and 3 bedrooms properties represent 77.8% of the active Airbnb listings in Parral, indicating a high concentration in these sizes.
- A significant 33.4% of listings offer 3+ bedrooms, catering to larger groups and families seeking more space in Parral.
Parral Vacation Rental Guest Capacity Trends (2026)
Distribution of Listings by Guest Capacity
Guest Capacity Insights for Parral
- The most common guest capacity trend in Parral vacation rentals is listings accommodating 5 guests (22.2%). This suggests the primary traveler segment is likely larger groups.
- Properties designed for 5 guests and 6 guests dominate the Parral STR market, accounting for 38.9% of listings.
- 33.4% of properties accommodate 6+ guests, serving the market segment for larger families or group travel in Parral.
- On average, properties in Parral are equipped to host 4.8 guests.
Parral Airbnb Booking Patterns (2026): Available vs. Booked Days
Available Days Distribution
Booked Days Distribution
Booking Pattern Insights for Parral
- The most common availability pattern in Parral falls within the 271-366 days range, representing 94.4% of listings. This suggests many properties have significant open periods on their calendars.
- Approximately 100.0% of listings show high availability (181+ days open annually), indicating potential for increased bookings or specific owner usage patterns.
- For booked days, the 31-90 days range is most frequent in Parral (55.6%), reflecting common guest stay durations or potential owner blocking patterns.
Parral Airbnb Minimum Stay Requirements Analysis
Distribution of Listings by Minimum Night Requirement
1 Night
7 listings
38.9% of total
2 Nights
4 listings
22.2% of total
30+ Nights
7 listings
38.9% of total
Key Insights
- The most prevalent minimum stay requirement in Parral is 1 Night, adopted by 38.9% of listings. This highlights the market's preference for shorter, flexible bookings.
- A strong majority (61.1%) of the Parral Airbnb data shows acceptance of very short stays (1-2 nights), indicating a dynamic, high-turnover market.
- A significant segment (38.9%) caters to monthly stays (30+ nights) in Parral, pointing to opportunities in the extended-stay market.
Recommendations
- Align with the market by considering a 1 Night minimum stay, as 38.9% of Parral hosts use this setting.
- Explore offering discounts for stays of 30+ nights to attract the 38.9% of the market seeking extended stays.
- Adjust minimum nights based on seasonality – potentially shorter during low season and longer during peak demand periods in Parral.
Parral Airbnb Cancellation Policy Trends Analysis (2026)
Flexible
8 listings
44.4% of total
Moderate
9 listings
50% of total
Strict
1 listings
5.6% of total
Cancellation Policy Insights for Parral
- The prevailing Airbnb cancellation policy trend in Parral is Moderate, used by 50% of listings.
- The market strongly favors guest-friendly terms, with 94.4% of listings offering Flexible or Moderate policies. This suggests guests in Parral may expect booking flexibility.
- Strict cancellation policies are quite rare (5.6%), potentially making listings with this policy less competitive unless justified by high demand or property type.
Recommendations for Hosts
- Consider adopting a Moderate policy to align with the 50% market standard in Parral.
- Using a Strict policy might deter some guests, as only 5.6% of listings use it. Evaluate if potential revenue protection outweighs possible lower booking rates.
- Regularly review your cancellation policy against competitors and market demand shifts in Parral.
Parral STR Booking Lead Time Analysis (2026)
Average Booking Lead Time by Month
Booking Lead Time Insights for Parral
- The overall average booking lead time for vacation rentals in Parral is 10 days.
- Guests book furthest in advance for stays during April (average 18 days), likely coinciding with peak travel demand or local events.
- The shortest booking windows occur for stays in July (average 5 days), indicating more last-minute travel plans during this time.
- Seasonally, Fall (14 days avg.) sees the longest lead times, while Summer (7 days avg.) has the shortest, reflecting typical travel planning cycles.
Recommendations for Hosts
- Use the overall average lead time (10 days) as a baseline for your pricing and availability strategy in Parral.
- Target marketing efforts for the Fall season well in advance (at least 14 days) to capture early planners.
- Monitor your own booking lead times against these Parral averages to identify opportunities for dynamic pricing adjustments.
Popular & Essential Airbnb Amenities in Parral (2026)
Amenity Prevalence
Amenity Insights for Parral
- Essential amenities in Parral that guests expect include: Kitchen, Free parking on premises. Lacking these (any) could significantly impact bookings.
- Popular amenities like BBQ grill, TV, Pool are common but not universal. Offering these can provide a competitive edge.
- A pool is a highly desired but not standard amenity, making it a key feature for attracting guests seeking leisure in Parral.
Recommendations for Hosts
- Ensure your listing includes all essential amenities for Parral: Kitchen, Free parking on premises.
- Consider adding popular differentiators like BBQ grill or TV to increase appeal.
- Highlight unique or less common amenities you offer (e.g., hot tub, dedicated workspace, EV charger) in your listing description and photos.
- Regularly check competitor amenities in Parral to stay competitive.
Parral Airbnb Guest Demographics & Profile Analysis (2026)
Guest Profile Summary for Parral
- The typical guest profile for Airbnb in Parral consists of primarily domestic travelers (79%), often arriving from nearby Santiago, typically belonging to the Post-2000s (Gen Z/Alpha) group (50%), primarily speaking English or Spanish.
- Domestic travelers account for 78.6% of guests.
- Key international markets include Chile (78.6%) and United States (7.1%).
- Top languages spoken are English (39.1%) followed by Spanish (39.1%).
- A significant demographic segment is the Post-2000s (Gen Z/Alpha) group, representing 50% of guests.
Recommendations for Hosts
- Target domestic marketing efforts towards travelers from Santiago and Rengo.
- Tailor amenities and listing descriptions to appeal to the dominant Post-2000s (Gen Z/Alpha) demographic (e.g., highlight fast WiFi, smart home features, local guides).
- Highlight unique local experiences or amenities relevant to the primary guest profile.
- Consider seasonal promotions aligned with peak travel times for key origin markets.
Nearby Short-Term Rental Market Comparison
How does the Parral Airbnb market stack up against its neighbors? Compare key performance metrics like average monthly revenue, ADR, and occupancy rates in surrounding areas to understand the broader regional STR landscape.
| Market | Active Properties | Monthly Revenue | Daily Rate | Avg. Occupancy |
|---|---|---|---|---|
| Las Leñas | 65 | $896 | $218.61 | 36% |
| Pinto | 418 | $859 | $148.59 | 28% |
| Las Trancas | 13 | $701 | $140.83 | 38% |
| Longaví | 11 | $578 | $167.89 | 21% |
| Municipio de Caviahue - Copahue | 22 | $578 | $116.31 | 24% |
| Tomé | 215 | $577 | $103.07 | 29% |
| Santa Bárbara | 24 | $576 | $102.38 | 31% |
| Colbún | 90 | $563 | $105.27 | 27% |
| San Clemente | 92 | $547 | $95.71 | 29% |
| Cabrero | 22 | $521 | $83.48 | 31% |