Pinto Airbnb Market Analysis 2026: Short Term Rental Data & Vacation Rental Statistics in Nuble Region, Chile
Is Airbnb profitable in Pinto in 2026? Explore comprehensive Airbnb analytics for Pinto, Nuble Region, Chile to uncover income potential. This 2026 STR market report for Pinto, based on AirROI data from February 2025 to January 2026, reveals key trends in the market of 424 active listings.
Whether you're considering an Airbnb investment in Pinto, optimizing your existing vacation rental, or exploring rental arbitrage opportunities, understanding the Pinto Airbnb data is crucial. Leveraging the low regulation environment is key to maximizing your short term rental income potential. Let's dive into the specifics.
Key Pinto Airbnb Performance Metrics Overview
Monthly Airbnb Revenue Variations & Income Potential in Pinto (2026)
Understanding the monthly revenue variations for Airbnb listings in Pinto is key to maximizing your short term rental income potential. Seasonality significantly impacts earnings. Our analysis, based on data from the past 12 months, shows that the peak revenue month for STRs in Pinto is typically July, while November often presents the lowest earnings, highlighting opportunities for strategic pricing adjustments during shoulder and low seasons. Explore the typical Airbnb income in Pinto across different performance tiers:
- Best-in-class properties (Top 10%) achieve $2,551+ monthly, often utilizing dynamic pricing and superior guest experiences.
- Strong performing properties (Top 25%) earn $1,605 or more, indicating effective management and desirable locations/amenities.
- Typical properties (Median) generate around $846 per month, representing the average market performance.
- Entry-level properties (Bottom 25%) see earnings around $411, often with potential for optimization.
Average Monthly Airbnb Earnings Trend in Pinto
Pinto Airbnb Occupancy Rate Trends (2026)
Maximize your bookings by understanding the Pinto STR occupancy trends. Seasonal demand shifts significantly influence how often properties are booked. Typically, Julysees the highest demand (peak season occupancy), while November experiences the lowest (low season). Effective strategies, like adjusting minimum stays or offering promotions, can boost occupancy during slower periods. Here's how different property tiers perform in Pinto:
- Best-in-class properties (Top 10%) achieve 55%+ occupancy, indicating high desirability and potentially optimized availability.
- Strong performing properties (Top 25%) maintain 39% or higher occupancy, suggesting good market fit and guest satisfaction.
- Typical properties (Median) have an occupancy rate around 22%.
- Entry-level properties (Bottom 25%) average 11% occupancy, potentially facing higher vacancy.
Average Monthly Occupancy Rate Trend in Pinto
Average Daily Rate (ADR) Airbnb Trends in Pinto (2026)
Effective short term rental pricing strategy in Pinto involves understanding monthly ADR fluctuations. The Average Daily Rate (ADR) for Airbnb in Pinto typically peaks in July and dips lowest during March. Leveraging Airbnb dynamic pricing tools or strategies based on this seasonality can significantly boost revenue. Here's a look at the typical nightly rates achieved:
- Best-in-class properties (Top 10%) command rates of $251+ per night, often due to premium features or locations.
- Strong performing properties (Top 25%) achieve nightly rates of $175 or more.
- Typical properties (Median) charge around $120 per night.
- Entry-level properties (Bottom 25%) earn around $89 per night.
Average Daily Rate (ADR) Trend by Month in Pinto
Get Live Pinto Market Intelligence 👇

Explore Real-time Analytics
Airbnb Seasonality Analysis & Trends in Pinto (2026)
Peak Season (July, August, June)
- Revenue averages $2,279 per month
- Occupancy rates average 41.1%
- Daily rates average $163
Shoulder Season
- Revenue averages $960 per month
- Occupancy maintains around 25.2%
- Daily rates hold near $140
Low Season (April, November, December)
- Revenue drops to average $617 per month
- Occupancy decreases to average 17.8%
- Daily rates adjust to average $137
Seasonality Insights for Pinto
- The Airbnb seasonality in Pinto shows highly seasonal trends requiring careful strategy. While the sections above show seasonal averages, it's also insightful to look at the extremes:
- During the high season, the absolute peak month showcases Pinto's highest earning potential, with monthly revenues capable of climbing to $3,139, occupancy reaching a high of 53.8%, and ADRs peaking at $167.
- Conversely, the slowest single month of the year, typically falling within the low season, marks the market's lowest point. In this month, revenue might dip to $535, occupancy could drop to 16.6%, and ADRs may adjust down to $130.
- Understanding both the seasonal averages and these monthly peaks and troughs in revenue, occupancy, and ADR is crucial for maximizing your Airbnb profit potential in Pinto.
Seasonal Strategies for Maximizing Profit
- Peak Season: Maximize revenue through premium pricing and potentially longer minimum stays. Ensure high availability.
- Low Season: Offer competitive pricing, special promotions (e.g., extended stay discounts), and flexible cancellation policies. Target off-season travelers like remote workers or budget-conscious guests.
- Shoulder Seasons: Implement dynamic pricing that balances peak and low rates. Target weekend travelers or specific events. Offer slightly more flexible terms than peak season.
- Regularly analyze your own performance against these Pinto seasonality benchmarks and adjust your pricing and availability strategy accordingly.
Best Areas for Airbnb Investment in Pinto (2026)
Exploring the top neighborhoods for short-term rentals in Pinto? This section highlights key areas, outlining why they are attractive for hosts and guests, along with notable local attractions. Consider these locations based on your target guest profile and investment strategy.
| Neighborhood / Area | Why Host Here? (Target Guests & Appeal) | Key Attractions & Landmarks |
|---|---|---|
| Pinto Centro | Pinto Centro is the heart of the town, offering a charming atmosphere with local shops, cafes, and easy access to essential services. It's a great spot for travelers looking for a cozy, authentic experience in southern Chile. | Plaza de Pinto, Chilean cuisine restaurants, Local artisan shops, Nearby hiking trails, Cultural festivals |
| Las Trancas | A picturesque area known for its stunning natural landscapes, Las Trancas is popular among outdoor enthusiasts and those seeking solitude in nature. It offers opportunities for skiing in winter and hiking in summer. | Nevados de Chillán ski resort, Hot springs, Hiking trails in the Andes, Scenic views of the mountains |
| Estación Pinto | This area serves as a transit hub and attracts visitors traveling to the surrounding rural attractions. It has various eateries and local commerce, making it convenient for guests. | Local markets, Train station for rural tours, Restaurants with local food, Nearby farms for tours |
| Termas de Chillán | Known for its thermal baths and spa resorts, this location is perfect for guests looking to relax and rejuvenate. The area is popular for wellness retreats and adventure tourism. | Thermal baths, Spas and wellness centers, Nature trails, Adventure sports |
| Río Claro | A stunning natural reserve known for its clear waters and scenic beauty. Great for eco-tourism and attracting guests who love outdoor activities like rafting and kayaking. | Río Claro river activities, Hiking in the natural park, Wildlife watching, Camping sites |
| Nuble River Valley | Renowned for its beautiful vineyards and agricultural landscapes, this area offers a taste of rural life in Chile and appeals to wine tourism enthusiasts. | Vineyard tours, Wine tasting experiences, Local produce markets, Scenic drives |
| Chillán | The closest city with significant amenities and historical sites, Chillán attracts visitors interested in conquering both city and heritage in their travels. | Chillán market, Historical architecture, Museums, Cultural events |
| Cerro Negro | A nature lover's paradise, Cerro Negro offers spectacular views and outdoor activities. It's perfect for travelers seeking adventure and breathtaking scenery. | Hiking trails, Bird watching, Photography spots, Scenic overlooks |
Understanding Airbnb License Requirements & STR Laws in Pinto (2026)
While Pinto, Nuble Region, Chile currently shows low STR regulations, specific Airbnb license requirements might still exist or change. Always verify the latest short term rental regulations and Airbnb license requirements directly with local government authorities for Pinto to ensure full compliance before hosting.
(Source: AirROI data, 2026, based on 1% licensed listings)
Top Performing Airbnb Properties in Pinto (2026)
Benchmark your potential! Explore examples of top-performing Airbnb properties in Pintobased on Trailing Twelve Month (TTM) revenue. Analyze their characteristics, revenue, occupancy rate, and ADR to understand what drives success in this market.
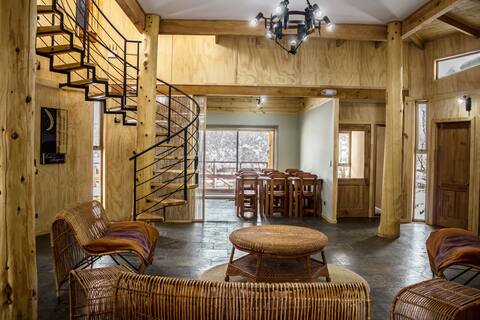
Casa Hotel Refuge of the Moon
Entire Place • 7 bedrooms
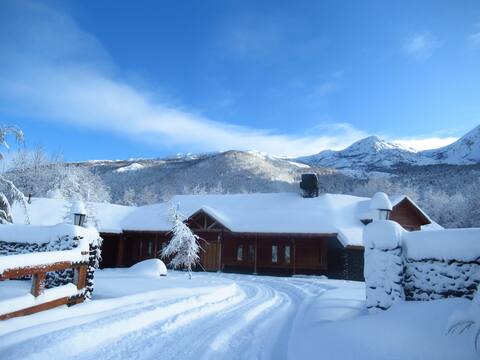
Large Mountain House in Termas de Chillan
Entire Place • 7 bedrooms

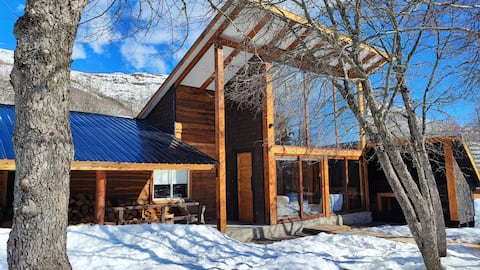
House surrounded by forest, Termas de Chillán
Entire Place • 2 bedrooms
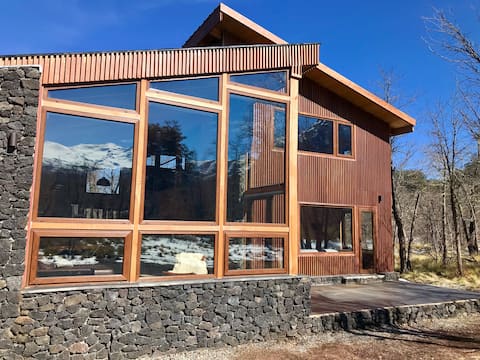
Ski/Bike Mountain Cabin
Entire Place • 3 bedrooms
Chalet Ciprés
Entire Place • 4 bedrooms
Nice house near the Chillan hot springs
Entire Place • 4 bedrooms
Note: Performance varies based on location, size, amenities, seasonality, and management quality. Data reflects the past 12 months.
Top Performing Airbnb Hosts in Pinto (2026)
Learn from the best! This table showcases top-performing Airbnb hosts in Pinto based on the number of properties managed and estimated total revenue over the past year. Analyze their scale and performance metrics.
| Host Name | Properties | Grossing Revenue | Stay Reviews | Avg Rating |
|---|---|---|---|---|
| Rosa Maria | 5 | $113,096 | 21 | 4.86/5.0 |
| Rodrigo | 8 | $100,915 | 479 | 4.75/5.0 |
| Walter | 3 | $91,720 | 79 | 4.88/5.0 |
| Ingrid | 4 | $72,110 | 72 | 4.78/5.0 |
| Sergio | 5 | $71,563 | 150 | 4.91/5.0 |
| Alén | 5 | $65,712 | 286 | 4.95/5.0 |
| Alejandro | 1 | $63,539 | 21 | 5.00/5.0 |
| Cristóbal Agustín | 4 | $60,779 | 73 | 4.64/5.0 |
| Francisco | 3 | $58,201 | 41 | 4.93/5.0 |
| Valeria | 1 | $52,579 | 31 | 4.90/5.0 |
Analyzing the strategies of top hosts, such as their property selection, pricing, and guest communication, can offer valuable lessons for optimizing your own Airbnb operations in Pinto.
Dive Deeper: Advanced Pinto STR Market Data (2026)
Ready to unlock more insights? AirROI provides access to advanced metrics and comprehensive Airbnb data for Pinto. Explore detailed analytics beyond this report to refine your investment strategy, optimize pricing, and maximize your vacation rental profits.
Explore Advanced MetricsPinto Short-Term Rental Market Composition (2026): Property & Room Types
Room Type Distribution
Property Type Distribution
Market Composition Insights for Pinto
- The Pinto Airbnb market composition is heavily skewed towards Entire Home/Apt listings, which make up 93.4% of the 424 active rentals. This indicates strong guest preference for privacy and space.
- Looking at the property type distribution in Pinto, Outdoor/Unique properties are the most common (59.9%), reflecting the local real estate landscape.
- Houses represent a significant 19.6% portion, catering likely to families or larger groups.
- The presence of 5.2% Hotel/Boutique listings indicates integration with traditional hospitality.
- Smaller segments like unique stays, others (combined 4.9%) offer potential for unique stay experiences.
Pinto Airbnb Room Capacity Analysis (2026): Bedroom Distribution
Distribution of Listings by Number of Bedrooms
Room Capacity Insights for Pinto
- The dominant room capacity in Pinto is 2 bedrooms listings, making up 34.2% of the market. This suggests a strong demand for properties suitable for couples or solo travelers.
- Together, 2 bedrooms and 3 bedrooms properties represent 63.2% of the active Airbnb listings in Pinto, indicating a high concentration in these sizes.
- A significant 42.6% of listings offer 3+ bedrooms, catering to larger groups and families seeking more space in Pinto.
Pinto Vacation Rental Guest Capacity Trends (2026)
Distribution of Listings by Guest Capacity
Guest Capacity Insights for Pinto
- The most common guest capacity trend in Pinto vacation rentals is listings accommodating 8+ guests (26.9%). This suggests the primary traveler segment is likely larger groups.
- Properties designed for 8+ guests and 6 guests dominate the Pinto STR market, accounting for 52.6% of listings.
- 59.7% of properties accommodate 6+ guests, serving the market segment for larger families or group travel in Pinto.
- On average, properties in Pinto are equipped to host 5.6 guests.
Pinto Airbnb Booking Patterns (2026): Available vs. Booked Days
Available Days Distribution
Booked Days Distribution
Booking Pattern Insights for Pinto
- The most common availability pattern in Pinto falls within the 271-366 days range, representing 75.5% of listings. This suggests many properties have significant open periods on their calendars.
- Approximately 97.0% of listings show high availability (181+ days open annually), indicating potential for increased bookings or specific owner usage patterns.
- For booked days, the 31-90 days range is most frequent in Pinto (41.3%), reflecting common guest stay durations or potential owner blocking patterns.
- A notable 3.3% of properties secure long booking periods (181+ days booked per year), highlighting successful long-term rental strategies or significant owner usage.
Pinto Airbnb Minimum Stay Requirements Analysis
Distribution of Listings by Minimum Night Requirement
1 Night
84 listings
19.8% of total
2 Nights
167 listings
39.4% of total
3 Nights
21 listings
5% of total
4-6 Nights
11 listings
2.6% of total
7-29 Nights
2 listings
0.5% of total
30+ Nights
139 listings
32.8% of total
Key Insights
- The most prevalent minimum stay requirement in Pinto is 2 Nights, adopted by 39.4% of listings. This highlights the market's preference for shorter, flexible bookings.
- A significant segment (32.8%) caters to monthly stays (30+ nights) in Pinto, pointing to opportunities in the extended-stay market.
Recommendations
- Align with the market by considering a 2 Nights minimum stay, as 39.4% of Pinto hosts use this setting.
- If feasible, allowing 1-night stays, especially midweek or during low season, could capture last-minute bookings, as only 19.8% currently do.
- A 2-night minimum appears standard (39.4%). Consider this for weekends or peak periods.
- Explore offering discounts for stays of 30+ nights to attract the 32.8% of the market seeking extended stays.
- Adjust minimum nights based on seasonality – potentially shorter during low season and longer during peak demand periods in Pinto.
Pinto Airbnb Cancellation Policy Trends Analysis (2026)
Limited
28 listings
6.6% of total
Flexible
122 listings
28.9% of total
Moderate
128 listings
30.3% of total
Firm
129 listings
30.6% of total
Strict
15 listings
3.6% of total
Cancellation Policy Insights for Pinto
- The prevailing Airbnb cancellation policy trend in Pinto is Firm, used by 30.6% of listings.
- There's a relatively balanced mix between guest-friendly (59.2%) and stricter (34.2%) policies, offering choices for different guest needs.
- Strict cancellation policies are quite rare (3.6%), potentially making listings with this policy less competitive unless justified by high demand or property type.
Recommendations for Hosts
- Consider adopting a Firm policy to align with the 30.6% market standard in Pinto.
- Using a Strict policy might deter some guests, as only 3.6% of listings use it. Evaluate if potential revenue protection outweighs possible lower booking rates.
- Regularly review your cancellation policy against competitors and market demand shifts in Pinto.
Pinto STR Booking Lead Time Analysis (2026)
Average Booking Lead Time by Month
Booking Lead Time Insights for Pinto
- The overall average booking lead time for vacation rentals in Pinto is 28 days.
- Guests book furthest in advance for stays during August (average 47 days), likely coinciding with peak travel demand or local events.
- The shortest booking windows occur for stays in April (average 13 days), indicating more last-minute travel plans during this time.
- Seasonally, Summer (37 days avg.) sees the longest lead times, while Spring (14 days avg.) has the shortest, reflecting typical travel planning cycles.
Recommendations for Hosts
- Use the overall average lead time (28 days) as a baseline for your pricing and availability strategy in Pinto.
- For August stays, consider implementing length-of-stay discounts or slightly higher rates for bookings made less than 47 days out to capitalize on advance planning.
- During April, focus on last-minute booking availability and promotions, as guests book with very short notice (13 days avg.).
- Target marketing efforts for the Summer season well in advance (at least 37 days) to capture early planners.
- Monitor your own booking lead times against these Pinto averages to identify opportunities for dynamic pricing adjustments.
Popular & Essential Airbnb Amenities in Pinto (2026)
Amenity Prevalence
Amenity Insights for Pinto
- Essential amenities in Pinto that guests expect include: Free parking on premises. Lacking these (this) could significantly impact bookings.
- Popular amenities like Kitchen, TV, BBQ grill are common but not universal. Offering these can provide a competitive edge.
Recommendations for Hosts
- Ensure your listing includes all essential amenities for Pinto: Free parking on premises.
- Prioritize adding missing essentials: Free parking on premises.
- Consider adding popular differentiators like Kitchen or TV to increase appeal.
- Highlight unique or less common amenities you offer (e.g., hot tub, dedicated workspace, EV charger) in your listing description and photos.
- Regularly check competitor amenities in Pinto to stay competitive.
Pinto Airbnb Guest Demographics & Profile Analysis (2026)
Guest Profile Summary for Pinto
- The typical guest profile for Airbnb in Pinto consists of primarily domestic travelers (75%), often arriving from nearby Santiago, typically belonging to the Post-2000s (Gen Z/Alpha) group (50%), primarily speaking Spanish or English.
- Domestic travelers account for 75.0% of guests.
- Key international markets include Chile (75%) and Brazil (11.3%).
- Top languages spoken are Spanish (47.6%) followed by English (34%).
- A significant demographic segment is the Post-2000s (Gen Z/Alpha) group, representing 50% of guests.
Recommendations for Hosts
- Target domestic marketing efforts towards travelers from Santiago and Concepción.
- Tailor amenities and listing descriptions to appeal to the dominant Post-2000s (Gen Z/Alpha) demographic (e.g., highlight fast WiFi, smart home features, local guides).
- Highlight unique local experiences or amenities relevant to the primary guest profile.
- Consider seasonal promotions aligned with peak travel times for key origin markets.
Nearby Short-Term Rental Market Comparison
How does the Pinto Airbnb market stack up against its neighbors? Compare key performance metrics like average monthly revenue, ADR, and occupancy rates in surrounding areas to understand the broader regional STR landscape.
| Market | Active Properties | Monthly Revenue | Daily Rate | Avg. Occupancy |
|---|---|---|---|---|
| Las Leñas | 69 | $884 | $223.69 | 38% |
| Las Trancas | 18 | $816 | $159.21 | 34% |
| Municipio de Caviahue - Copahue | 23 | $557 | $114.00 | 24% |
| San Clemente | 87 | $529 | $90.44 | 29% |
| Santa Bárbara | 24 | $509 | $102.67 | 29% |
| Cabrero | 19 | $498 | $73.98 | 31% |
| Tomé | 211 | $496 | $100.25 | 28% |
| Colbún | 94 | $473 | $103.72 | 25% |
| Molina | 39 | $408 | $82.92 | 25% |
| Quillón | 78 | $397 | $118.27 | 23% |