Quillón Airbnb Market Analysis 2026: Short Term Rental Data & Vacation Rental Statistics in Nuble Region, Chile
Is Airbnb profitable in Quillón in 2026? Explore comprehensive Airbnb analytics for Quillón, Nuble Region, Chile to uncover income potential. This 2026 STR market report for Quillón, based on AirROI data from February 2025 to January 2026, reveals key trends in the niche market of 78 active listings.
Whether you're considering an Airbnb investment in Quillón, optimizing your existing vacation rental, or exploring rental arbitrage opportunities, understanding the Quillón Airbnb data is crucial. Leveraging the low regulation environment is key to maximizing your short term rental income potential. Let's dive into the specifics.
Key Quillón Airbnb Performance Metrics Overview
Monthly Airbnb Revenue Variations & Income Potential in Quillón (2026)
Understanding the monthly revenue variations for Airbnb listings in Quillón is key to maximizing your short term rental income potential. Seasonality significantly impacts earnings. Our analysis, based on data from the past 12 months, shows that the peak revenue month for STRs in Quillón is typically February, while August often presents the lowest earnings, highlighting opportunities for strategic pricing adjustments during shoulder and low seasons. Explore the typical Airbnb income in Quillón across different performance tiers:
- Best-in-class properties (Top 10%) achieve $1,507+ monthly, often utilizing dynamic pricing and superior guest experiences.
- Strong performing properties (Top 25%) earn $937 or more, indicating effective management and desirable locations/amenities.
- Typical properties (Median) generate around $522 per month, representing the average market performance.
- Entry-level properties (Bottom 25%) see earnings around $237, often with potential for optimization.
Average Monthly Airbnb Earnings Trend in Quillón
Quillón Airbnb Occupancy Rate Trends (2026)
Maximize your bookings by understanding the Quillón STR occupancy trends. Seasonal demand shifts significantly influence how often properties are booked. Typically, Februarysees the highest demand (peak season occupancy), while July experiences the lowest (low season). Effective strategies, like adjusting minimum stays or offering promotions, can boost occupancy during slower periods. Here's how different property tiers perform in Quillón:
- Best-in-class properties (Top 10%) achieve 39%+ occupancy, indicating high desirability and potentially optimized availability.
- Strong performing properties (Top 25%) maintain 26% or higher occupancy, suggesting good market fit and guest satisfaction.
- Typical properties (Median) have an occupancy rate around 15%.
- Entry-level properties (Bottom 25%) average 8% occupancy, potentially facing higher vacancy.
Average Monthly Occupancy Rate Trend in Quillón
Average Daily Rate (ADR) Airbnb Trends in Quillón (2026)
Effective short term rental pricing strategy in Quillón involves understanding monthly ADR fluctuations. The Average Daily Rate (ADR) for Airbnb in Quillón typically peaks in February and dips lowest during April. Leveraging Airbnb dynamic pricing tools or strategies based on this seasonality can significantly boost revenue. Here's a look at the typical nightly rates achieved:
- Best-in-class properties (Top 10%) command rates of $181+ per night, often due to premium features or locations.
- Strong performing properties (Top 25%) achieve nightly rates of $143 or more.
- Typical properties (Median) charge around $101 per night.
- Entry-level properties (Bottom 25%) earn around $79 per night.
Average Daily Rate (ADR) Trend by Month in Quillón
Get Live Quillón Market Intelligence 👇
Explore Real-time Analytics
Airbnb Seasonality Analysis & Trends in Quillón (2026)
Peak Season (February, January, October)
- Revenue averages $1,225 per month
- Occupancy rates average 32.5%
- Daily rates average $118
Shoulder Season
- Revenue averages $577 per month
- Occupancy maintains around 16.4%
- Daily rates hold near $113
Low Season (May, July, August)
- Revenue drops to average $386 per month
- Occupancy decreases to average 12.7%
- Daily rates adjust to average $113
Seasonality Insights for Quillón
- The Airbnb seasonality in Quillón shows highly seasonal trends requiring careful strategy. While the sections above show seasonal averages, it's also insightful to look at the extremes:
- During the high season, the absolute peak month showcases Quillón's highest earning potential, with monthly revenues capable of climbing to $1,794, occupancy reaching a high of 49.5%, and ADRs peaking at $121.
- Conversely, the slowest single month of the year, typically falling within the low season, marks the market's lowest point. In this month, revenue might dip to $312, occupancy could drop to 10.8%, and ADRs may adjust down to $109.
- Understanding both the seasonal averages and these monthly peaks and troughs in revenue, occupancy, and ADR is crucial for maximizing your Airbnb profit potential in Quillón.
Seasonal Strategies for Maximizing Profit
- Peak Season: Maximize revenue through premium pricing and potentially longer minimum stays. Ensure high availability.
- Low Season: Offer competitive pricing, special promotions (e.g., extended stay discounts), and flexible cancellation policies. Target off-season travelers like remote workers or budget-conscious guests.
- Shoulder Seasons: Implement dynamic pricing that balances peak and low rates. Target weekend travelers or specific events. Offer slightly more flexible terms than peak season.
- Regularly analyze your own performance against these Quillón seasonality benchmarks and adjust your pricing and availability strategy accordingly.
Best Areas for Airbnb Investment in Quillón (2026)
Exploring the top neighborhoods for short-term rentals in Quillón? This section highlights key areas, outlining why they are attractive for hosts and guests, along with notable local attractions. Consider these locations based on your target guest profile and investment strategy.
| Neighborhood / Area | Why Host Here? (Target Guests & Appeal) | Key Attractions & Landmarks |
|---|---|---|
| Quillón Lake | A beautiful area known for its stunning lake and surrounding nature. Ideal for tourists seeking relaxation, outdoor activities, and water sports. | Quillón Lake, Cerro Negro, Los Copihues de Quillón, Cañón del río Ñuble |
| Quillón City Center | The bustling heart of Quillón with shops, restaurants, and local culture. Perfect for visitors wanting to experience the local lifestyle and amenities. | Plaza de Armas, Quillón Market, Local restaurants, Cultural events, Quillón Church |
| Las Trancas | A scenic valley with access to hiking, nature, and winter sports in the nearby mountains. Attracts adventure seekers and nature lovers year-round. | Nevados de Chillán, Cascadas de Las Trancas, Hot springs, Ski resorts |
| Pinto | A quaint town close to natural parks and hiking trails, appealing to families and nature enthusiasts looking for a getaway. | Parque Nacional Ñuble, Reserva Biológica Huilo Huilo, Local crafts shops |
| San Ignacio | A charming small town near Quillón with rich cultural heritage and scenic landscapes. Suitable for those looking for a peaceful retreat. | San Ignacio Plaza, Historical sites, Local vineyards |
| Coihueco | Located near the Ñuble River, offers beautiful natural settings and outdoor activities, perfect for eco-tourists and adventure lovers. | Ñuble River, Hiking trails, Bird watching |
| Yungay | A picturesque town surrounded by mountains and nature, ideal for visitors who enjoy peace and tranquility away from city life. | Yungay History Museum, Scenic parks, Mountain hiking |
| Chillán | While a bit farther, it’s a larger city with many attractions and amenities, popular for tourists visiting the nearby thermal baths and ski areas. | Termas de Chillán, Chillán Market, Catedral de Chillán, Local cultural festivals |
Understanding Airbnb License Requirements & STR Laws in Quillón (2026)
While Quillón, Nuble Region, Chile currently shows low STR regulations, specific Airbnb license requirements might still exist or change. Always verify the latest short term rental regulations and Airbnb license requirements directly with local government authorities for Quillón to ensure full compliance before hosting.
(Source: AirROI data, 2026, based on 1% licensed listings)
Top Performing Airbnb Properties in Quillón (2026)
Benchmark your potential! Explore examples of top-performing Airbnb properties in Quillónbased on Trailing Twelve Month (TTM) revenue. Analyze their characteristics, revenue, occupancy rate, and ADR to understand what drives success in this market.
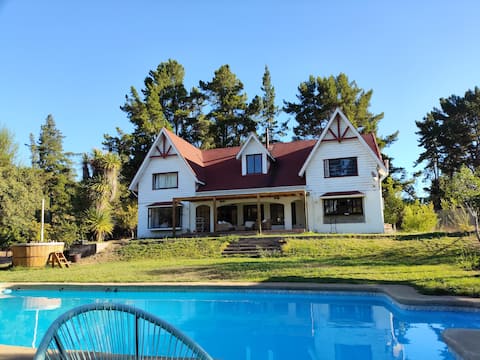
Casa Blanca Quillon
Entire Place • 6 bedrooms
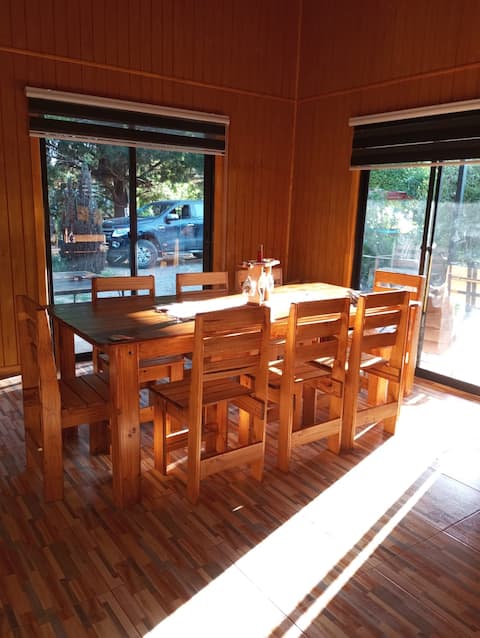
Cabin for 10 people with a tub
Entire Place • 4 bedrooms
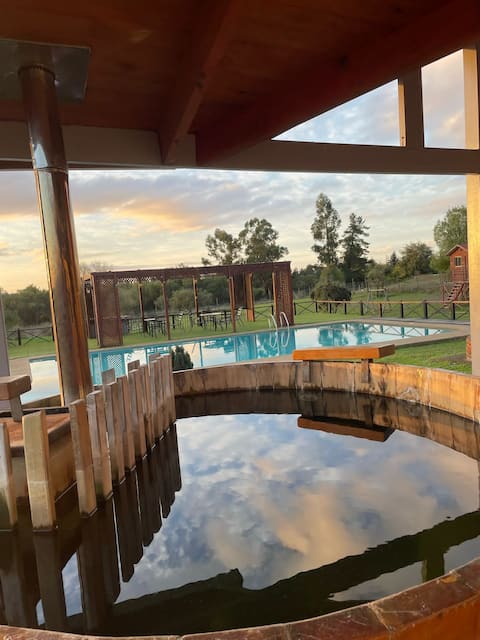
Beautiful plot in Quillón, swimming pool, gazebo, and hot tub
Entire Place • 4 bedrooms

Quillón Valley Meadows, Private and Exclusive
Entire Place • 3 bedrooms

Excellent country house
Entire Place • 2 bedrooms

Beautiful plot cabin pool hot tub
Entire Place • 5 bedrooms
Note: Performance varies based on location, size, amenities, seasonality, and management quality. Data reflects the past 12 months.
Top Performing Airbnb Hosts in Quillón (2026)
Learn from the best! This table showcases top-performing Airbnb hosts in Quillón based on the number of properties managed and estimated total revenue over the past year. Analyze their scale and performance metrics.
| Host Name | Properties | Grossing Revenue | Stay Reviews | Avg Rating |
|---|---|---|---|---|
| Valle Del Sol | 11 | $37,044 | 38 | 4.67/5.0 |
| Tamara | 2 | $27,970 | 44 | 4.89/5.0 |
| Lilian | 2 | $19,924 | 34 | 4.88/5.0 |
| Leonardo | 1 | $17,755 | 14 | 5.00/5.0 |
| Miguel | 1 | $16,794 | 16 | 4.94/5.0 |
| Carlos | 3 | $14,368 | 217 | 4.54/5.0 |
| Claudio Alberto | 1 | $12,187 | 21 | 5.00/5.0 |
| Hector | 1 | $11,949 | 39 | 4.92/5.0 |
| Mario | 1 | $11,464 | 6 | 4.83/5.0 |
| Katiuska | 1 | $11,071 | 13 | 4.85/5.0 |
Analyzing the strategies of top hosts, such as their property selection, pricing, and guest communication, can offer valuable lessons for optimizing your own Airbnb operations in Quillón.
Dive Deeper: Advanced Quillón STR Market Data (2026)
Ready to unlock more insights? AirROI provides access to advanced metrics and comprehensive Airbnb data for Quillón. Explore detailed analytics beyond this report to refine your investment strategy, optimize pricing, and maximize your vacation rental profits.
Explore Advanced MetricsQuillón Short-Term Rental Market Composition (2026): Property & Room Types
Room Type Distribution
Property Type Distribution
Market Composition Insights for Quillón
- The Quillón Airbnb market composition is heavily skewed towards Entire Home/Apt listings, which make up 100% of the 78 active rentals. This indicates strong guest preference for privacy and space.
- Looking at the property type distribution in Quillón, Outdoor/Unique properties are the most common (67.9%), reflecting the local real estate landscape.
- Houses represent a significant 28.2% portion, catering likely to families or larger groups.
- Smaller segments like hotel/boutique, apartment/condo (combined 3.9%) offer potential for unique stay experiences.
Quillón Airbnb Room Capacity Analysis (2026): Bedroom Distribution
Distribution of Listings by Number of Bedrooms
Room Capacity Insights for Quillón
- The dominant room capacity in Quillón is 3 bedrooms listings, making up 29.5% of the market. This suggests a strong demand for properties suitable for families or small groups.
- Together, 3 bedrooms and 2 bedrooms properties represent 55.1% of the active Airbnb listings in Quillón, indicating a high concentration in these sizes.
- A significant 59.0% of listings offer 3+ bedrooms, catering to larger groups and families seeking more space in Quillón.
Quillón Vacation Rental Guest Capacity Trends (2026)
Distribution of Listings by Guest Capacity
Guest Capacity Insights for Quillón
- The most common guest capacity trend in Quillón vacation rentals is listings accommodating 8+ guests (41%). This suggests the primary traveler segment is likely larger groups.
- Properties designed for 8+ guests and 6 guests dominate the Quillón STR market, accounting for 62.8% of listings.
- 66.6% of properties accommodate 6+ guests, serving the market segment for larger families or group travel in Quillón.
- On average, properties in Quillón are equipped to host 6.1 guests.
Quillón Airbnb Booking Patterns (2026): Available vs. Booked Days
Available Days Distribution
Booked Days Distribution
Booking Pattern Insights for Quillón
- The most common availability pattern in Quillón falls within the 271-366 days range, representing 94.9% of listings. This suggests many properties have significant open periods on their calendars.
- Approximately 100.0% of listings show high availability (181+ days open annually), indicating potential for increased bookings or specific owner usage patterns.
- For booked days, the 1-30 days range is most frequent in Quillón (50%), reflecting common guest stay durations or potential owner blocking patterns.
Quillón Airbnb Minimum Stay Requirements Analysis
Distribution of Listings by Minimum Night Requirement
1 Night
27 listings
34.6% of total
2 Nights
20 listings
25.6% of total
3 Nights
4 listings
5.1% of total
30+ Nights
27 listings
34.6% of total
Key Insights
- The most prevalent minimum stay requirement in Quillón is 1 Night, adopted by 34.6% of listings. This highlights the market's preference for shorter, flexible bookings.
- A strong majority (60.2%) of the Quillón Airbnb data shows acceptance of very short stays (1-2 nights), indicating a dynamic, high-turnover market.
- A significant segment (34.6%) caters to monthly stays (30+ nights) in Quillón, pointing to opportunities in the extended-stay market.
Recommendations
- Align with the market by considering a 1 Night minimum stay, as 34.6% of Quillón hosts use this setting.
- Explore offering discounts for stays of 30+ nights to attract the 34.6% of the market seeking extended stays.
- Adjust minimum nights based on seasonality – potentially shorter during low season and longer during peak demand periods in Quillón.
Quillón Airbnb Cancellation Policy Trends Analysis (2026)
Limited
2 listings
2.6% of total
Flexible
32 listings
41% of total
Moderate
23 listings
29.5% of total
Firm
19 listings
24.4% of total
Strict
2 listings
2.6% of total
Cancellation Policy Insights for Quillón
- The prevailing Airbnb cancellation policy trend in Quillón is Flexible, used by 41% of listings.
- The market strongly favors guest-friendly terms, with 70.5% of listings offering Flexible or Moderate policies. This suggests guests in Quillón may expect booking flexibility.
- Strict cancellation policies are quite rare (2.6%), potentially making listings with this policy less competitive unless justified by high demand or property type.
Recommendations for Hosts
- Consider adopting a Flexible policy to align with the 41% market standard in Quillón.
- Using a Strict policy might deter some guests, as only 2.6% of listings use it. Evaluate if potential revenue protection outweighs possible lower booking rates.
- Regularly review your cancellation policy against competitors and market demand shifts in Quillón.
Quillón STR Booking Lead Time Analysis (2026)
Average Booking Lead Time by Month
Booking Lead Time Insights for Quillón
- The overall average booking lead time for vacation rentals in Quillón is 22 days.
- Guests book furthest in advance for stays during June (average 32 days), likely coinciding with peak travel demand or local events.
- The shortest booking windows occur for stays in August (average 8 days), indicating more last-minute travel plans during this time.
- Seasonally, Spring (24 days avg.) sees the longest lead times, while Summer (19 days avg.) has the shortest, reflecting typical travel planning cycles.
Recommendations for Hosts
- Use the overall average lead time (22 days) as a baseline for your pricing and availability strategy in Quillón.
- During August, focus on last-minute booking availability and promotions, as guests book with very short notice (8 days avg.).
- Target marketing efforts for the Spring season well in advance (at least 24 days) to capture early planners.
- Monitor your own booking lead times against these Quillón averages to identify opportunities for dynamic pricing adjustments.
Popular & Essential Airbnb Amenities in Quillón (2026)
Amenity Prevalence
Amenity Insights for Quillón
- Essential amenities in Quillón that guests expect include: Free parking on premises. Lacking these (this) could significantly impact bookings.
- Popular amenities like Kitchen, BBQ grill, TV are common but not universal. Offering these can provide a competitive edge.
- A pool is a highly desired but not standard amenity, making it a key feature for attracting guests seeking leisure in Quillón.
Recommendations for Hosts
- Ensure your listing includes all essential amenities for Quillón: Free parking on premises.
- Consider adding popular differentiators like Kitchen or BBQ grill to increase appeal.
- Highlight unique or less common amenities you offer (e.g., hot tub, dedicated workspace, EV charger) in your listing description and photos.
- Regularly check competitor amenities in Quillón to stay competitive.
Quillón Airbnb Guest Demographics & Profile Analysis (2026)
Guest Profile Summary for Quillón
- The typical guest profile for Airbnb in Quillón consists of primarily domestic travelers (93%), often arriving from nearby Concepción, typically belonging to the Post-2000s (Gen Z/Alpha) group (50%), primarily speaking Spanish or English.
- Domestic travelers account for 93.4% of guests.
- Key international markets include Chile (93.4%) and Uruguay (2.2%).
- Top languages spoken are Spanish (67.7%) followed by English (24.6%).
- A significant demographic segment is the Post-2000s (Gen Z/Alpha) group, representing 50% of guests.
Recommendations for Hosts
- Target domestic marketing efforts towards travelers from Concepción and Santiago.
- Tailor amenities and listing descriptions to appeal to the dominant Post-2000s (Gen Z/Alpha) demographic (e.g., highlight fast WiFi, smart home features, local guides).
- Highlight unique local experiences or amenities relevant to the primary guest profile.
- Consider seasonal promotions aligned with peak travel times for key origin markets.
Nearby Short-Term Rental Market Comparison
How does the Quillón Airbnb market stack up against its neighbors? Compare key performance metrics like average monthly revenue, ADR, and occupancy rates in surrounding areas to understand the broader regional STR landscape.
| Market | Active Properties | Monthly Revenue | Daily Rate | Avg. Occupancy |
|---|---|---|---|---|
| Pinto | 424 | $816 | $145.46 | 28% |
| Las Trancas | 18 | $816 | $159.21 | 34% |
| Municipio de Caviahue - Copahue | 23 | $557 | $114.00 | 24% |
| San Clemente | 87 | $529 | $90.44 | 29% |
| Santa Bárbara | 24 | $509 | $102.67 | 29% |
| Cabrero | 19 | $498 | $73.98 | 31% |
| Tomé | 211 | $496 | $100.25 | 28% |
| Colbún | 94 | $473 | $103.72 | 25% |
| Talcahuano | 57 | $458 | $54.78 | 39% |
| Concepcion | 611 | $421 | $52.55 | 35% |