Pucon Airbnb Market Analysis 2026: Short Term Rental Data & Vacation Rental Statistics in Región de la Araucanía, Chile
Is Airbnb profitable in Pucon in 2026? Explore comprehensive Airbnb analytics for Pucon, Región de la Araucanía, Chile to uncover income potential. This 2026 STR market report for Pucon, based on AirROI data from June 2024 to May 2025, reveals key trends in the niche market of 43 active listings.
Whether you're considering an Airbnb investment in Pucon, optimizing your existing vacation rental, or exploring rental arbitrage opportunities, understanding the Pucon Airbnb data is crucial. Leveraging the low regulation environment is key to maximizing your short term rental income potential. Let's dive into the specifics.
Key Pucon Airbnb Performance Metrics Overview
Monthly Airbnb Revenue Variations & Income Potential in Pucon (2026)
Understanding the monthly revenue variations for Airbnb listings in Pucon is key to maximizing your short term rental income potential. Seasonality significantly impacts earnings. Our analysis, based on data from the past 12 months, shows that the peak revenue month for STRs in Pucon is typically February, while April often presents the lowest earnings, highlighting opportunities for strategic pricing adjustments during shoulder and low seasons. Explore the typical Airbnb income in Pucon across different performance tiers:
- Best-in-class properties (Top 10%) achieve $2,261+ monthly, often utilizing dynamic pricing and superior guest experiences.
- Strong performing properties (Top 25%) earn $1,283 or more, indicating effective management and desirable locations/amenities.
- Typical properties (Median) generate around $686 per month, representing the average market performance.
- Entry-level properties (Bottom 25%) see earnings around $332, often with potential for optimization.
Average Monthly Airbnb Earnings Trend in Pucon
Pucon Airbnb Occupancy Rate Trends (2026)
Maximize your bookings by understanding the Pucon STR occupancy trends. Seasonal demand shifts significantly influence how often properties are booked. Typically, Februarysees the highest demand (peak season occupancy), while April experiences the lowest (low season). Effective strategies, like adjusting minimum stays or offering promotions, can boost occupancy during slower periods. Here's how different property tiers perform in Pucon:
- Best-in-class properties (Top 10%) achieve 61%+ occupancy, indicating high desirability and potentially optimized availability.
- Strong performing properties (Top 25%) maintain 46% or higher occupancy, suggesting good market fit and guest satisfaction.
- Typical properties (Median) have an occupancy rate around 28%.
- Entry-level properties (Bottom 25%) average 14% occupancy, potentially facing higher vacancy.
Average Monthly Occupancy Rate Trend in Pucon
Average Daily Rate (ADR) Airbnb Trends in Pucon (2026)
Effective short term rental pricing strategy in Pucon involves understanding monthly ADR fluctuations. The Average Daily Rate (ADR) for Airbnb in Pucon typically peaks in February and dips lowest during April. Leveraging Airbnb dynamic pricing tools or strategies based on this seasonality can significantly boost revenue. Here's a look at the typical nightly rates achieved:
- Best-in-class properties (Top 10%) command rates of $196+ per night, often due to premium features or locations.
- Strong performing properties (Top 25%) achieve nightly rates of $122 or more.
- Typical properties (Median) charge around $79 per night.
- Entry-level properties (Bottom 25%) earn around $60 per night.
Average Daily Rate (ADR) Trend by Month in Pucon
Get Live Pucon Market Intelligence 👇

Explore Real-time Analytics
Airbnb Seasonality Analysis & Trends in Pucon (2025)
Peak Season (February, January, December)
- Revenue averages $1,803 per month
- Occupancy rates average 48.8%
- Daily rates average $113
Shoulder Season
- Revenue averages $841 per month
- Occupancy maintains around 26.5%
- Daily rates hold near $108
Low Season (April, September, November)
- Revenue drops to average $615 per month
- Occupancy decreases to average 24.7%
- Daily rates adjust to average $108
Seasonality Insights for Pucon
- The Airbnb seasonality in Pucon shows highly seasonal trends requiring careful strategy. While the sections above show seasonal averages, it's also insightful to look at the extremes:
- During the high season, the absolute peak month showcases Pucon's highest earning potential, with monthly revenues capable of climbing to $2,349, occupancy reaching a high of 67.5%, and ADRs peaking at $113.
- Conversely, the slowest single month of the year, typically falling within the low season, marks the market's lowest point. In this month, revenue might dip to $527, occupancy could drop to 20.0%, and ADRs may adjust down to $103.
- Understanding both the seasonal averages and these monthly peaks and troughs in revenue, occupancy, and ADR is crucial for maximizing your Airbnb profit potential in Pucon.
Seasonal Strategies for Maximizing Profit
- Peak Season: Maximize revenue through premium pricing and potentially longer minimum stays. Ensure high availability.
- Low Season: Offer competitive pricing, special promotions (e.g., extended stay discounts), and flexible cancellation policies. Target off-season travelers like remote workers or budget-conscious guests.
- Shoulder Seasons: Implement dynamic pricing that balances peak and low rates. Target weekend travelers or specific events. Offer slightly more flexible terms than peak season.
- Regularly analyze your own performance against these Pucon seasonality benchmarks and adjust your pricing and availability strategy accordingly.
Best Areas for Airbnb Investment in Pucon (2026)
Exploring the top neighborhoods for short-term rentals in Pucon? This section highlights key areas, outlining why they are attractive for hosts and guests, along with notable local attractions. Consider these locations based on your target guest profile and investment strategy.
| Neighborhood / Area | Why Host Here? (Target Guests & Appeal) | Key Attractions & Landmarks |
|---|---|---|
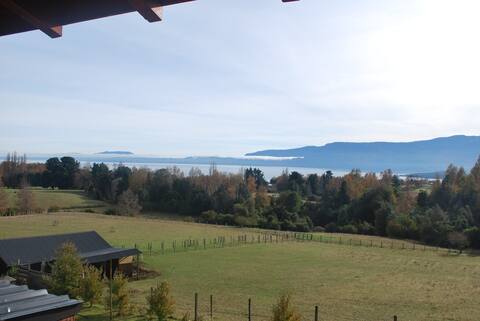
| Lake Villarrica | A stunning natural setting with beautiful views of the lake and the volcano. Ideal for tourists looking for relaxation and outdoor activities like water sports, fishing, and hiking. | Lake Villarrica, Villarrica Volcano, Water sports activities, Pucón beach, Hiking trails |
| Pucón Downtown | The vibrant heart of Pucón, filled with restaurants, shops, and easy access to local attractions. Perfect for those who want the convenience of city life close to nature. | Casino de Pucón, Plaza de Armas, Local artisan markets, Restaurants and cafes |
| Termas Geometricas | Known for its natural hot springs and breathtaking landscapes, a unique destination for wellness tourists seeking relaxation and rejuvenation. | Termas Geometricas, Hiking trails, Natural hot springs, Scenic viewpoints |
| Villarrica National Park | A nature enthusiast's paradise with lush landscapes, mountains, and wildlife. Great for adventure seekers and those looking to explore the outdoors. | Hiking, Wildlife watching, Scenic views, Villarrica Volcano |
| Cascadas de Huife | A beautiful area known for its waterfalls and scenic beauty, attracting nature lovers and those seeking tranquility away from the town. | Huife Waterfalls, Nature trails, Picnic areas |
| Caburgua Lake | A picturesque lake known for its clear waters and surrounded by forests, perfect for families and those looking to enjoy lakeside activities. | Caburgua Beach, Lago Caburgua, Cascadas de los Ojos del Caburgua, Outdoor picnic areas |
| Huilo Huilo Biological Reserve | A unique ecological reserve offering diverse flora and fauna, along with adventure activities like canopy tours and trekking. | Canopy tours, Ecological trails, Wildlife observation, Natural scenery |
| Lago Ranco | Another beautiful lake location with a tranquil environment, popular with tourists looking for peaceful retreats and outdoor activities such as fishing and kayaking. | Lago Ranco, Kayaking, Fishing, Scenic viewpoints |
Understanding Airbnb License Requirements & STR Laws in Pucon (2026)
While Pucon, Región de la Araucanía, Chile currently shows low STR regulations, specific Airbnb license requirements might still exist or change. Always verify the latest short term rental regulations and Airbnb license requirements directly with local government authorities for Pucon to ensure full compliance before hosting.
(Source: AirROI data, 2026, based on 5% licensed listings)
Top Performing Airbnb Properties in Pucon (2026)
Benchmark your potential! Explore examples of top-performing Airbnb properties in Puconbased on Trailing Twelve Month (TTM) revenue. Analyze their characteristics, revenue, occupancy rate, and ADR to understand what drives success in this market.
Amazing Country House 5kms from Pucon
Entire Place • 4 bedrooms
Country house in Pucón
Entire Place • 5 bedrooms
Beautiful Plot House in Pucon bella jardin !
Entire Place • 5 bedrooms

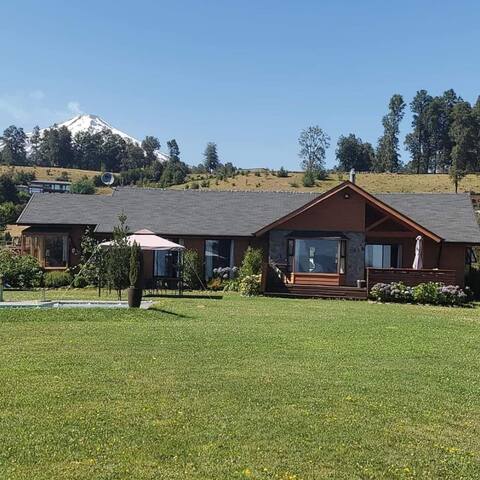
Spectacular House in Pucon
Entire Place • 3 bedrooms
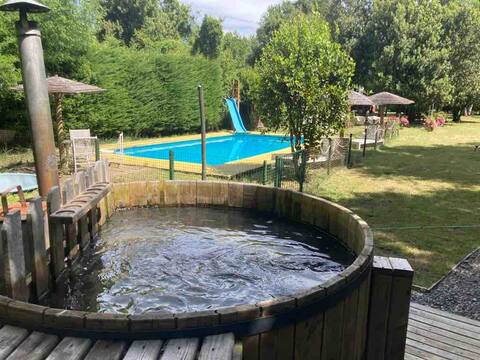
Cabin with its own bathtub 10 min from downtown. MA1
Entire Place • 3 bedrooms

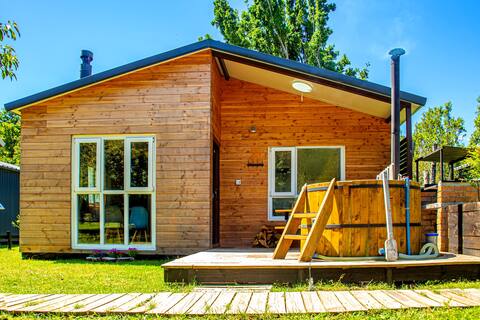
Tiny House 1 Tinaja Privada and Air Conditioning
Entire Place • 1 bedroom
Note: Performance varies based on location, size, amenities, seasonality, and management quality. Data reflects the past 12 months.
Top Performing Airbnb Hosts in Pucon (2026)
Learn from the best! This table showcases top-performing Airbnb hosts in Pucon based on the number of properties managed and estimated total revenue over the past year. Analyze their scale and performance metrics.
| Host Name | Properties | Grossing Revenue | Stay Reviews | Avg Rating |
|---|---|---|---|---|
| Ricardo | 5 | $57,015 | 659 | 4.72/5.0 |
| Gustavo | 1 | $44,579 | 38 | 4.92/5.0 |
| Hugo | 1 | $29,363 | 28 | 4.86/5.0 |
| Marcel | 1 | $22,388 | 21 | 5.00/5.0 |
| Andres Ignacio | 1 | $22,185 | 56 | 4.84/5.0 |
| Jaime | 1 | $15,418 | 159 | 4.96/5.0 |
| Nitza | 1 | $11,949 | 107 | 4.92/5.0 |
| Ruka | 1 | $11,495 | 137 | 4.80/5.0 |
| Patricia | 1 | $11,233 | 15 | 4.80/5.0 |
| María | 1 | $8,677 | 20 | 4.90/5.0 |
Analyzing the strategies of top hosts, such as their property selection, pricing, and guest communication, can offer valuable lessons for optimizing your own Airbnb operations in Pucon.
Dive Deeper: Advanced Pucon STR Market Data (2026)
Ready to unlock more insights? AirROI provides access to advanced metrics and comprehensive Airbnb data for Pucon. Explore detailed analytics beyond this report to refine your investment strategy, optimize pricing, and maximize your vacation rental profits.
Explore Advanced MetricsPucon Short-Term Rental Market Composition (2026): Property & Room Types
Room Type Distribution
Property Type Distribution
Market Composition Insights for Pucon
- The Pucon Airbnb market composition is heavily skewed towards Entire Home/Apt listings, which make up 97.7% of the 43 active rentals. This indicates strong guest preference for privacy and space.
- Looking at the property type distribution in Pucon, Outdoor/Unique properties are the most common (65.1%), reflecting the local real estate landscape.
- Houses represent a significant 34.9% portion, catering likely to families or larger groups.
Pucon Airbnb Room Capacity Analysis (2026): Bedroom Distribution
Distribution of Listings by Number of Bedrooms
Room Capacity Insights for Pucon
- The dominant room capacity in Pucon is 3 bedrooms listings, making up 37.2% of the market. This suggests a strong demand for properties suitable for families or small groups.
- Together, 3 bedrooms and 2 bedrooms properties represent 62.8% of the active Airbnb listings in Pucon, indicating a high concentration in these sizes.
- A significant 60.4% of listings offer 3+ bedrooms, catering to larger groups and families seeking more space in Pucon.
Pucon Vacation Rental Guest Capacity Trends (2026)
Distribution of Listings by Guest Capacity
Guest Capacity Insights for Pucon
- The most common guest capacity trend in Pucon vacation rentals is listings accommodating 8+ guests (34.9%). This suggests the primary traveler segment is likely larger groups.
- Properties designed for 8+ guests and 6 guests dominate the Pucon STR market, accounting for 51.2% of listings.
- 60.5% of properties accommodate 6+ guests, serving the market segment for larger families or group travel in Pucon.
- On average, properties in Pucon are equipped to host 5.8 guests.
Pucon Airbnb Booking Patterns (2026): Available vs. Booked Days
Available Days Distribution
Booked Days Distribution
Booking Pattern Insights for Pucon
- The most common availability pattern in Pucon falls within the 271-366 days range, representing 72.1% of listings. This suggests many properties have significant open periods on their calendars.
- Approximately 95.4% of listings show high availability (181+ days open annually), indicating potential for increased bookings or specific owner usage patterns.
- For booked days, the 31-90 days range is most frequent in Pucon (37.2%), reflecting common guest stay durations or potential owner blocking patterns.
- A notable 4.7% of properties secure long booking periods (181+ days booked per year), highlighting successful long-term rental strategies or significant owner usage.
Pucon Airbnb Minimum Stay Requirements Analysis
Distribution of Listings by Minimum Night Requirement
1 Night
5 listings
11.6% of total
2 Nights
10 listings
23.3% of total
3 Nights
7 listings
16.3% of total
4-6 Nights
8 listings
18.6% of total
30+ Nights
13 listings
30.2% of total
Key Insights
- The most prevalent minimum stay requirement in Pucon is 30+ Nights, adopted by 30.2% of listings. This highlights the market's preference for longer commitments.
- A significant segment (30.2%) caters to monthly stays (30+ nights) in Pucon, pointing to opportunities in the extended-stay market.
Recommendations
- Align with the market by considering a 30+ Nights minimum stay, as 30.2% of Pucon hosts use this setting.
- If feasible, allowing 1-night stays, especially midweek or during low season, could capture last-minute bookings, as only 11.6% currently do.
- Explore offering discounts for stays of 30+ nights to attract the 30.2% of the market seeking extended stays.
- Adjust minimum nights based on seasonality – potentially shorter during low season and longer during peak demand periods in Pucon.
Pucon Airbnb Cancellation Policy Trends Analysis (2026)
Flexible
10 listings
23.8% of total
Moderate
16 listings
38.1% of total
Firm
10 listings
23.8% of total
Strict
6 listings
14.3% of total
Cancellation Policy Insights for Pucon
- The prevailing Airbnb cancellation policy trend in Pucon is Moderate, used by 38.1% of listings.
- There's a relatively balanced mix between guest-friendly (61.9%) and stricter (38.1%) policies, offering choices for different guest needs.
Recommendations for Hosts
- Consider adopting a Moderate policy to align with the 38.1% market standard in Pucon.
- Using a Strict policy might deter some guests, as only 14.3% of listings use it. Evaluate if potential revenue protection outweighs possible lower booking rates.
- Regularly review your cancellation policy against competitors and market demand shifts in Pucon.
Pucon STR Booking Lead Time Analysis (2026)
Average Booking Lead Time by Month
Booking Lead Time Insights for Pucon
- The overall average booking lead time for vacation rentals in Pucon is 28 days.
- Guests book furthest in advance for stays during February (average 44 days), likely coinciding with peak travel demand or local events.
- The shortest booking windows occur for stays in May (average 10 days), indicating more last-minute travel plans during this time.
- Seasonally, Winter (38 days avg.) sees the longest lead times, while Summer (17 days avg.) has the shortest, reflecting typical travel planning cycles.
Recommendations for Hosts
- Use the overall average lead time (28 days) as a baseline for your pricing and availability strategy in Pucon.
- For February stays, consider implementing length-of-stay discounts or slightly higher rates for bookings made less than 44 days out to capitalize on advance planning.
- During May, focus on last-minute booking availability and promotions, as guests book with very short notice (10 days avg.).
- Target marketing efforts for the Winter season well in advance (at least 38 days) to capture early planners.
- Monitor your own booking lead times against these Pucon averages to identify opportunities for dynamic pricing adjustments.
Popular & Essential Airbnb Amenities in Pucon (2026)
Amenity Prevalence
Amenity Insights for Pucon
- Essential amenities in Pucon that guests expect include: Free parking on premises, Kitchen, Dishes and silverware, Hot water. Lacking these (any) could significantly impact bookings.
- Popular amenities like Backyard, Refrigerator, Stove are common but not universal. Offering these can provide a competitive edge.
Recommendations for Hosts
- Ensure your listing includes all essential amenities for Pucon: Free parking on premises, Kitchen, Dishes and silverware, Hot water.
- Prioritize adding missing essentials: Kitchen, Dishes and silverware, Hot water.
- Consider adding popular differentiators like Backyard or Refrigerator to increase appeal.
- Highlight unique or less common amenities you offer (e.g., hot tub, dedicated workspace, EV charger) in your listing description and photos.
- Regularly check competitor amenities in Pucon to stay competitive.
Pucon Airbnb Guest Demographics & Profile Analysis (2026)
Guest Profile Summary for Pucon
- The typical guest profile for Airbnb in Pucon consists of primarily domestic travelers (71%), often arriving from nearby Santiago, typically belonging to the Post-2000s (Gen Z/Alpha) group (50%), primarily speaking Spanish or English.
- Domestic travelers account for 70.8% of guests.
- Key international markets include Chile (70.8%) and United States (8.1%).
- Top languages spoken are Spanish (53.3%) followed by English (31.1%).
- A significant demographic segment is the Post-2000s (Gen Z/Alpha) group, representing 50% of guests.
Recommendations for Hosts
- Target domestic marketing efforts towards travelers from Santiago and Temuco.
- Tailor amenities and listing descriptions to appeal to the dominant Post-2000s (Gen Z/Alpha) demographic (e.g., highlight fast WiFi, smart home features, local guides).
- Highlight unique local experiences or amenities relevant to the primary guest profile.
- Consider seasonal promotions aligned with peak travel times for key origin markets.
Nearby Short-Term Rental Market Comparison
How does the Pucon Airbnb market stack up against its neighbors? Compare key performance metrics like average monthly revenue, ADR, and occupancy rates in surrounding areas to understand the broader regional STR landscape.
| Market | Active Properties | Monthly Revenue | Daily Rate | Avg. Occupancy |
|---|---|---|---|---|
| Lácar Department | 11 | $1,166 | $109.30 | 43% |
| Municipio de San Martín de los Andes | 71 | $1,161 | $225.66 | 33% |
| San Martín de los Andes | 39 | $1,034 | $175.76 | 34% |
| Municipio de Villa La Angostura | 491 | $993 | $145.50 | 35% |
| Villa Pehuenia | 19 | $822 | $109.84 | 36% |
| Vilcún | 12 | $791 | $137.73 | 24% |
| San Martín de los Andes | 880 | $779 | $116.34 | 37% |
| Villa La Angostura | 62 | $721 | $174.10 | 38% |
| Candelaria | 15 | $685 | $118.88 | 39% |
| Puerto Octay | 106 | $632 | $115.82 | 30% |