San Joaquín Airbnb Market Analysis 2026: Short Term Rental Data & Vacation Rental Statistics in Santiago Metropolitan Region, Chile
Is Airbnb profitable in San Joaquín in 2026? Explore comprehensive Airbnb analytics for San Joaquín, Santiago Metropolitan Region, Chile to uncover income potential. This 2026 STR market report for San Joaquín, based on AirROI data from February 2025 to January 2026, reveals key trends in the niche market of 54 active listings.
Whether you're considering an Airbnb investment in San Joaquín, optimizing your existing vacation rental, or exploring rental arbitrage opportunities, understanding the San Joaquín Airbnb data is crucial. Leveraging the low regulation environment is key to maximizing your short term rental income potential. Let's dive into the specifics.
Key San Joaquín Airbnb Performance Metrics Overview
Monthly Airbnb Revenue Variations & Income Potential in San Joaquín (2026)
Understanding the monthly revenue variations for Airbnb listings in San Joaquín is key to maximizing your short term rental income potential. Seasonality significantly impacts earnings. Our analysis, based on data from the past 12 months, shows that the peak revenue month for STRs in San Joaquín is typically December, while May often presents the lowest earnings, highlighting opportunities for strategic pricing adjustments during shoulder and low seasons. Explore the typical Airbnb income in San Joaquín across different performance tiers:
- Best-in-class properties (Top 10%) achieve $960+ monthly, often utilizing dynamic pricing and superior guest experiences.
- Strong performing properties (Top 25%) earn $601 or more, indicating effective management and desirable locations/amenities.
- Typical properties (Median) generate around $325 per month, representing the average market performance.
- Entry-level properties (Bottom 25%) see earnings around $173, often with potential for optimization.
Average Monthly Airbnb Earnings Trend in San Joaquín
San Joaquín Airbnb Occupancy Rate Trends (2026)
Maximize your bookings by understanding the San Joaquín STR occupancy trends. Seasonal demand shifts significantly influence how often properties are booked. Typically, Februarysees the highest demand (peak season occupancy), while May experiences the lowest (low season). Effective strategies, like adjusting minimum stays or offering promotions, can boost occupancy during slower periods. Here's how different property tiers perform in San Joaquín:
- Best-in-class properties (Top 10%) achieve 77%+ occupancy, indicating high desirability and potentially optimized availability.
- Strong performing properties (Top 25%) maintain 51% or higher occupancy, suggesting good market fit and guest satisfaction.
- Typical properties (Median) have an occupancy rate around 29%.
- Entry-level properties (Bottom 25%) average 15% occupancy, potentially facing higher vacancy.
Average Monthly Occupancy Rate Trend in San Joaquín
Average Daily Rate (ADR) Airbnb Trends in San Joaquín (2026)
Effective short term rental pricing strategy in San Joaquín involves understanding monthly ADR fluctuations. The Average Daily Rate (ADR) for Airbnb in San Joaquín typically peaks in January and dips lowest during September. Leveraging Airbnb dynamic pricing tools or strategies based on this seasonality can significantly boost revenue. Here's a look at the typical nightly rates achieved:
- Best-in-class properties (Top 10%) command rates of $66+ per night, often due to premium features or locations.
- Strong performing properties (Top 25%) achieve nightly rates of $52 or more.
- Typical properties (Median) charge around $39 per night.
- Entry-level properties (Bottom 25%) earn around $31 per night.
Average Daily Rate (ADR) Trend by Month in San Joaquín
Get Live San Joaquín Market Intelligence 👇
Explore Real-time Analytics
Airbnb Seasonality Analysis & Trends in San Joaquín (2026)
Peak Season (December, July, February)
- Revenue averages $538 per month
- Occupancy rates average 41.4%
- Daily rates average $43
Shoulder Season
- Revenue averages $446 per month
- Occupancy maintains around 35.6%
- Daily rates hold near $42
Low Season (January, April, May)
- Revenue drops to average $351 per month
- Occupancy decreases to average 30.0%
- Daily rates adjust to average $42
Seasonality Insights for San Joaquín
- The Airbnb seasonality in San Joaquín shows moderate seasonality with distinct peak and low periods. While the sections above show seasonal averages, it's also insightful to look at the extremes:
- During the high season, the absolute peak month showcases San Joaquín's highest earning potential, with monthly revenues capable of climbing to $593, occupancy reaching a high of 43.3%, and ADRs peaking at $44.
- Conversely, the slowest single month of the year, typically falling within the low season, marks the market's lowest point. In this month, revenue might dip to $329, occupancy could drop to 27.9%, and ADRs may adjust down to $40.
- Understanding both the seasonal averages and these monthly peaks and troughs in revenue, occupancy, and ADR is crucial for maximizing your Airbnb profit potential in San Joaquín.
Seasonal Strategies for Maximizing Profit
- Peak Season: Maximize revenue through premium pricing and potentially longer minimum stays. Ensure high availability.
- Low Season: Offer competitive pricing, special promotions (e.g., extended stay discounts), and flexible cancellation policies. Target off-season travelers like remote workers or budget-conscious guests.
- Shoulder Seasons: Implement dynamic pricing that balances peak and low rates. Target weekend travelers or specific events. Offer slightly more flexible terms than peak season.
- Regularly analyze your own performance against these San Joaquín seasonality benchmarks and adjust your pricing and availability strategy accordingly.
Best Areas for Airbnb Investment in San Joaquín (2026)
Exploring the top neighborhoods for short-term rentals in San Joaquín? This section highlights key areas, outlining why they are attractive for hosts and guests, along with notable local attractions. Consider these locations based on your target guest profile and investment strategy.
| Neighborhood / Area | Why Host Here? (Target Guests & Appeal) | Key Attractions & Landmarks |
|---|---|---|
| Providencia | A central and vibrant neighborhood with restaurants, shops, and parks. It is popular among both tourists and locals for its accessibility and urban lifestyle. | Los Dominicos Park, Costanera Center, Parque Bustamante, Plaza de la Aviación, La Gran Torre Santiago |
| Las Condes | An upscale district known for its business centers and luxurious accommodations. It attracts both business and leisure travelers with its modern amenities and proximity to attractions. | Parque Araucano, Shopping Parque Arauco, Sky Costanera, Cerro San Cristóbal, Hotel Ritz-Carlton |
| Vitacura | A high-end residential area with a mix of upscale dining, shopping, and culture. It is appealing to visitors looking for a more sophisticated experience in Santiago. | Casa Costanera, Parque Bicentenario, Museo Ralli, La Pastelería |
| Ñuñoa | A culturally rich neighborhood with theaters, parks, and a local feel. It's gaining popularity among younger travelers and artists looking for a more authentic Santiago experience. | Estadio Nacional, Plaza Ñuñoa, Parque San Francisco, Cine Hoyts, Teatro Municipal de Ñuñoa |
| Santiago Centro | The historical and cultural heart of Santiago, offering a variety of attractions and easy access to public transport. Perfect for tourists wanting to explore the city. | Plaza de Armas, La Moneda Palace, Metropolitan Cathedral, Museo Chileno de Arte Precolombino, Cerro Santa Lucía |
| Barrio Lastarria | A bohemian neighborhood known for its artistic vibe, cafes, and cultural events. Popular among tourists looking for local art and cuisine. | Museo de Artes Visuales, Parque Forestal, Cine El Biógrafo, ferias de arte, restaurants and bars |
| Pajaritos | An emerging area with potential for developments. It's close to the airport and offers connectivity, making it attractive for short-term rentals. | Estación Pajaritos, Cerro Manquehue, local markets, shopping centers |
| El Golf | A Commercial and upscale residential area that is popular with tourists looking for luxury and business services. Close to financial institutions and dining options. | Cerro San Cristóbal, Parque El Golf, local restaurants, Luxury shopping options |
Understanding Airbnb License Requirements & STR Laws in San Joaquín (2026)
While San Joaquín, Santiago Metropolitan Region, Chile currently shows low STR regulations, specific Airbnb license requirements might still exist or change. Always verify the latest short term rental regulations and Airbnb license requirements directly with local government authorities for San Joaquín to ensure full compliance before hosting.
(Source: AirROI data, 2026, finding no licensed listings among those analyzed)
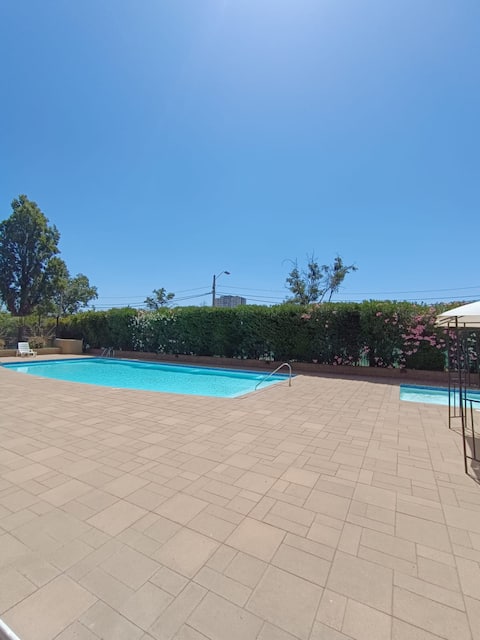
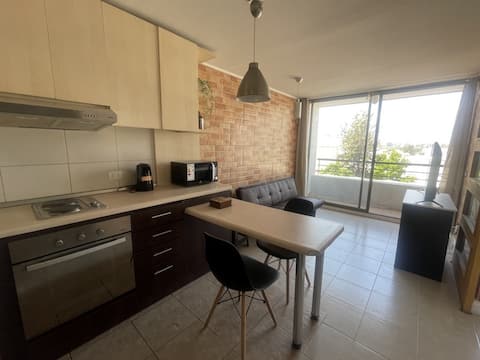
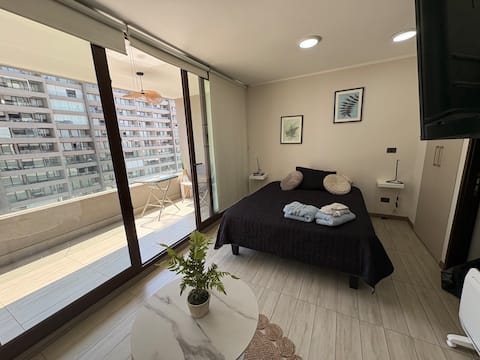
Top Performing Airbnb Properties in San Joaquín (2026)
Benchmark your potential! Explore examples of top-performing Airbnb properties in San Joaquínbased on Trailing Twelve Month (TTM) revenue. Analyze their characteristics, revenue, occupancy rate, and ADR to understand what drives success in this market.
mountain range view next to the subway
Entire Place • 2 bedrooms
Apartment a few steps away from the Metro.
Entire Place • 1 bedroom

Furnished Apartment, Central, Cordillera View / METRO
Entire Place • 2 bedrooms
Apartment Macul HomeStudio
Entire Place • 1 bedroom
Incredible value for money in Santiago!
Entire Place • 2 bedrooms

National Stadium / Universities
Entire Place • 2 bedrooms
Note: Performance varies based on location, size, amenities, seasonality, and management quality. Data reflects the past 12 months.
Top Performing Airbnb Hosts in San Joaquín (2026)
Learn from the best! This table showcases top-performing Airbnb hosts in San Joaquín based on the number of properties managed and estimated total revenue over the past year. Analyze their scale and performance metrics.
| Host Name | Properties | Grossing Revenue | Stay Reviews | Avg Rating |
|---|---|---|---|---|
| MVP Housing | 5 | $23,180 | 307 | 4.61/5.0 |
| Loica Host | 8 | $22,944 | 231 | 3.96/5.0 |
| Fernando | 1 | $15,776 | 13 | 4.77/5.0 |
| Maite | 5 | $10,385 | 35 | 3.57/5.0 |
| Cristian | 1 | $9,106 | 84 | 4.83/5.0 |
| Mauricio | 1 | $8,712 | 231 | 4.93/5.0 |
| Bryan | 1 | $8,690 | 60 | 4.70/5.0 |
| Felipe | 4 | $8,471 | 54 | 4.30/5.0 |
| Travel Home Chile | 2 | $5,545 | 21 | 4.68/5.0 |
| Loreto | 1 | $5,152 | 30 | 4.87/5.0 |
Analyzing the strategies of top hosts, such as their property selection, pricing, and guest communication, can offer valuable lessons for optimizing your own Airbnb operations in San Joaquín.
Dive Deeper: Advanced San Joaquín STR Market Data (2026)
Ready to unlock more insights? AirROI provides access to advanced metrics and comprehensive Airbnb data for San Joaquín. Explore detailed analytics beyond this report to refine your investment strategy, optimize pricing, and maximize your vacation rental profits.
Explore Advanced MetricsSan Joaquín Short-Term Rental Market Composition (2026): Property & Room Types
Room Type Distribution
Property Type Distribution
Market Composition Insights for San Joaquín
- The San Joaquín Airbnb market composition is heavily skewed towards Entire Home/Apt listings, which make up 81.5% of the 54 active rentals. This indicates strong guest preference for privacy and space.
- Looking at the property type distribution in San Joaquín, Apartment/Condo properties are the most common (87%), reflecting the local real estate landscape.
San Joaquín Airbnb Room Capacity Analysis (2026): Bedroom Distribution
Distribution of Listings by Number of Bedrooms
Room Capacity Insights for San Joaquín
- The dominant room capacity in San Joaquín is 1 bedroom listings, making up 44.4% of the market. This suggests a strong demand for properties suitable for couples or solo travelers.
- Together, 1 bedroom and 2 bedrooms properties represent 83.3% of the active Airbnb listings in San Joaquín, indicating a high concentration in these sizes.
- Listings with 3+ bedrooms (1.9%) represent a smaller niche, potentially indicating an underserved market for larger group accommodations in San Joaquín.
San Joaquín Vacation Rental Guest Capacity Trends (2026)
Distribution of Listings by Guest Capacity
Guest Capacity Insights for San Joaquín
- The most common guest capacity trend in San Joaquín vacation rentals is listings accommodating 2 guests (29.6%). This suggests the primary traveler segment is likely couples or solo travelers.
- Properties designed for 2 guests and 4 guests dominate the San Joaquín STR market, accounting for 51.8% of listings.
- On average, properties in San Joaquín are equipped to host 2.7 guests.
San Joaquín Airbnb Booking Patterns (2026): Available vs. Booked Days
Available Days Distribution
Booked Days Distribution
Booking Pattern Insights for San Joaquín
- The most common availability pattern in San Joaquín falls within the 271-366 days range, representing 70.4% of listings. This suggests many properties have significant open periods on their calendars.
- Approximately 90.8% of listings show high availability (181+ days open annually), indicating potential for increased bookings or specific owner usage patterns.
- For booked days, the 31-90 days range is most frequent in San Joaquín (50%), reflecting common guest stay durations or potential owner blocking patterns.
- A notable 9.3% of properties secure long booking periods (181+ days booked per year), highlighting successful long-term rental strategies or significant owner usage.
San Joaquín Airbnb Minimum Stay Requirements Analysis
Distribution of Listings by Minimum Night Requirement
1 Night
17 listings
31.5% of total
2 Nights
12 listings
22.2% of total
3 Nights
1 listings
1.9% of total
4-6 Nights
3 listings
5.6% of total
7-29 Nights
1 listings
1.9% of total
30+ Nights
20 listings
37% of total
Key Insights
- The most prevalent minimum stay requirement in San Joaquín is 30+ Nights, adopted by 37% of listings. This highlights the market's preference for longer commitments.
- A significant segment (37%) caters to monthly stays (30+ nights) in San Joaquín, pointing to opportunities in the extended-stay market.
Recommendations
- Align with the market by considering a 30+ Nights minimum stay, as 37% of San Joaquín hosts use this setting.
- Explore offering discounts for stays of 30+ nights to attract the 37% of the market seeking extended stays.
- Adjust minimum nights based on seasonality – potentially shorter during low season and longer during peak demand periods in San Joaquín.
San Joaquín Airbnb Cancellation Policy Trends Analysis (2026)
Limited
1 listings
1.9% of total
Flexible
22 listings
40.7% of total
Moderate
15 listings
27.8% of total
Firm
16 listings
29.6% of total
Cancellation Policy Insights for San Joaquín
- The prevailing Airbnb cancellation policy trend in San Joaquín is Flexible, used by 40.7% of listings.
- There's a relatively balanced mix between guest-friendly (68.5%) and stricter (29.6%) policies, offering choices for different guest needs.
Recommendations for Hosts
- Consider adopting a Flexible policy to align with the 40.7% market standard in San Joaquín.
- Regularly review your cancellation policy against competitors and market demand shifts in San Joaquín.
San Joaquín STR Booking Lead Time Analysis (2026)
Average Booking Lead Time by Month
Booking Lead Time Insights for San Joaquín
- The overall average booking lead time for vacation rentals in San Joaquín is 19 days.
- Guests book furthest in advance for stays during January (average 35 days), likely coinciding with peak travel demand or local events.
- The shortest booking windows occur for stays in February (average 13 days), indicating more last-minute travel plans during this time.
- Seasonally, Winter (23 days avg.) sees the longest lead times, while Summer (20 days avg.) has the shortest, reflecting typical travel planning cycles.
Recommendations for Hosts
- Use the overall average lead time (19 days) as a baseline for your pricing and availability strategy in San Joaquín.
- For January stays, consider implementing length-of-stay discounts or slightly higher rates for bookings made less than 35 days out to capitalize on advance planning.
- Target marketing efforts for the Winter season well in advance (at least 23 days) to capture early planners.
- Monitor your own booking lead times against these San Joaquín averages to identify opportunities for dynamic pricing adjustments.
Popular & Essential Airbnb Amenities in San Joaquín (2026)
Amenity Prevalence
Amenity Insights for San Joaquín
- Essential amenities in San Joaquín that guests expect include: Kitchen, Wifi. Lacking these (any) could significantly impact bookings.
- Popular amenities like Hot water, TV, Washer are common but not universal. Offering these can provide a competitive edge.
Recommendations for Hosts
- Ensure your listing includes all essential amenities for San Joaquín: Kitchen, Wifi.
- Prioritize adding missing essentials: Kitchen, Wifi.
- Consider adding popular differentiators like Hot water or TV to increase appeal.
- Highlight unique or less common amenities you offer (e.g., hot tub, dedicated workspace, EV charger) in your listing description and photos.
- Regularly check competitor amenities in San Joaquín to stay competitive.
San Joaquín Airbnb Guest Demographics & Profile Analysis (2026)
Guest Profile Summary for San Joaquín
- The typical guest profile for Airbnb in San Joaquín consists of primarily domestic travelers (70%), often arriving from nearby Santiago, typically belonging to the Post-2000s (Gen Z/Alpha) group (50%), primarily speaking Spanish or English.
- Domestic travelers account for 69.6% of guests.
- Key international markets include Chile (69.6%) and Brazil (8%).
- Top languages spoken are Spanish (59.1%) followed by English (29.9%).
- A significant demographic segment is the Post-2000s (Gen Z/Alpha) group, representing 50% of guests.
Recommendations for Hosts
- Target domestic marketing efforts towards travelers from Santiago and Concepción.
- Tailor amenities and listing descriptions to appeal to the dominant Post-2000s (Gen Z/Alpha) demographic (e.g., highlight fast WiFi, smart home features, local guides).
- Highlight unique local experiences or amenities relevant to the primary guest profile.
- Consider seasonal promotions aligned with peak travel times for key origin markets.
Nearby Short-Term Rental Market Comparison
How does the San Joaquín Airbnb market stack up against its neighbors? Compare key performance metrics like average monthly revenue, ADR, and occupancy rates in surrounding areas to understand the broader regional STR landscape.
| Market | Active Properties | Monthly Revenue | Daily Rate | Avg. Occupancy |
|---|---|---|---|---|
| Lo Barnechea | 483 | $2,018 | $372.13 | 42% |
| Estancia Atamisque | 11 | $1,496 | $433.35 | 19% |
| Potrerillos | 12 | $1,492 | $152.06 | 33% |
| Zapallar | 534 | $1,323 | $258.51 | 28% |
| Litueche | 68 | $1,254 | $224.62 | 26% |
| Peñaflor | 12 | $1,232 | $164.71 | 30% |
| Las Cabras | 179 | $1,137 | $219.49 | 27% |
| Casablanca | 241 | $1,095 | $165.43 | 30% |
| La Estrella | 21 | $1,078 | $288.44 | 24% |
| Vitacura | 257 | $1,062 | $128.87 | 42% |