Santo Domingo Airbnb Market Analysis 2026: Short Term Rental Data & Vacation Rental Statistics in Valparaiso Region, Chile
Is Airbnb profitable in Santo Domingo in 2026? Explore comprehensive Airbnb analytics for Santo Domingo, Valparaiso Region, Chile to uncover income potential. This 2026 STR market report for Santo Domingo, based on AirROI data from February 2025 to January 2026, reveals key trends in the market of 228 active listings.
Whether you're considering an Airbnb investment in Santo Domingo, optimizing your existing vacation rental, or exploring rental arbitrage opportunities, understanding the Santo Domingo Airbnb data is crucial. Leveraging the low regulation environment is key to maximizing your short term rental income potential. Let's dive into the specifics.
Key Santo Domingo Airbnb Performance Metrics Overview
Monthly Airbnb Revenue Variations & Income Potential in Santo Domingo (2026)
Understanding the monthly revenue variations for Airbnb listings in Santo Domingo is key to maximizing your short term rental income potential. Seasonality significantly impacts earnings. Our analysis, based on data from the past 12 months, shows that the peak revenue month for STRs in Santo Domingo is typically February, while June often presents the lowest earnings, highlighting opportunities for strategic pricing adjustments during shoulder and low seasons. Explore the typical Airbnb income in Santo Domingo across different performance tiers:
- Best-in-class properties (Top 10%) achieve $3,234+ monthly, often utilizing dynamic pricing and superior guest experiences.
- Strong performing properties (Top 25%) earn $1,862 or more, indicating effective management and desirable locations/amenities.
- Typical properties (Median) generate around $1,041 per month, representing the average market performance.
- Entry-level properties (Bottom 25%) see earnings around $496, often with potential for optimization.
Average Monthly Airbnb Earnings Trend in Santo Domingo
Santo Domingo Airbnb Occupancy Rate Trends (2026)
Maximize your bookings by understanding the Santo Domingo STR occupancy trends. Seasonal demand shifts significantly influence how often properties are booked. Typically, Februarysees the highest demand (peak season occupancy), while October experiences the lowest (low season). Effective strategies, like adjusting minimum stays or offering promotions, can boost occupancy during slower periods. Here's how different property tiers perform in Santo Domingo:
- Best-in-class properties (Top 10%) achieve 51%+ occupancy, indicating high desirability and potentially optimized availability.
- Strong performing properties (Top 25%) maintain 35% or higher occupancy, suggesting good market fit and guest satisfaction.
- Typical properties (Median) have an occupancy rate around 21%.
- Entry-level properties (Bottom 25%) average 12% occupancy, potentially facing higher vacancy.
Average Monthly Occupancy Rate Trend in Santo Domingo
Average Daily Rate (ADR) Airbnb Trends in Santo Domingo (2026)
Effective short term rental pricing strategy in Santo Domingo involves understanding monthly ADR fluctuations. The Average Daily Rate (ADR) for Airbnb in Santo Domingo typically peaks in January and dips lowest during March. Leveraging Airbnb dynamic pricing tools or strategies based on this seasonality can significantly boost revenue. Here's a look at the typical nightly rates achieved:
- Best-in-class properties (Top 10%) command rates of $318+ per night, often due to premium features or locations.
- Strong performing properties (Top 25%) achieve nightly rates of $249 or more.
- Typical properties (Median) charge around $171 per night.
- Entry-level properties (Bottom 25%) earn around $119 per night.
Average Daily Rate (ADR) Trend by Month in Santo Domingo
Get Live Santo Domingo Market Intelligence 👇

Explore Real-time Analytics
Airbnb Seasonality Analysis & Trends in Santo Domingo (2026)
Peak Season (February, January, March)
- Revenue averages $2,473 per month
- Occupancy rates average 42.9%
- Daily rates average $192
Shoulder Season
- Revenue averages $1,265 per month
- Occupancy maintains around 21.6%
- Daily rates hold near $192
Low Season (June, October, November)
- Revenue drops to average $876 per month
- Occupancy decreases to average 15.5%
- Daily rates adjust to average $193
Seasonality Insights for Santo Domingo
- The Airbnb seasonality in Santo Domingo shows highly seasonal trends requiring careful strategy. While the sections above show seasonal averages, it's also insightful to look at the extremes:
- During the high season, the absolute peak month showcases Santo Domingo's highest earning potential, with monthly revenues capable of climbing to $3,684, occupancy reaching a high of 65.5%, and ADRs peaking at $200.
- Conversely, the slowest single month of the year, typically falling within the low season, marks the market's lowest point. In this month, revenue might dip to $853, occupancy could drop to 14.1%, and ADRs may adjust down to $184.
- Understanding both the seasonal averages and these monthly peaks and troughs in revenue, occupancy, and ADR is crucial for maximizing your Airbnb profit potential in Santo Domingo.
Seasonal Strategies for Maximizing Profit
- Peak Season: Maximize revenue through premium pricing and potentially longer minimum stays. Ensure high availability.
- Low Season: Offer competitive pricing, special promotions (e.g., extended stay discounts), and flexible cancellation policies. Target off-season travelers like remote workers or budget-conscious guests.
- Shoulder Seasons: Implement dynamic pricing that balances peak and low rates. Target weekend travelers or specific events. Offer slightly more flexible terms than peak season.
- Regularly analyze your own performance against these Santo Domingo seasonality benchmarks and adjust your pricing and availability strategy accordingly.
Best Areas for Airbnb Investment in Santo Domingo (2026)
Exploring the top neighborhoods for short-term rentals in Santo Domingo? This section highlights key areas, outlining why they are attractive for hosts and guests, along with notable local attractions. Consider these locations based on your target guest profile and investment strategy.
| Neighborhood / Area | Why Host Here? (Target Guests & Appeal) | Key Attractions & Landmarks |
|---|---|---|
| Zona Colonial | Historical heart of Santo Domingo with colonial architecture and rich cultural heritage. A must-visit for tourists interested in history and museums. | Colonial Zone, Alcázar de Colón, Catedral Primada de América, Museo de las Casas Reales, Plaza de España |
| Piantini | A modern and upscale district known for its business centers and luxury shopping. Popular among professionals and business travelers. | Blue Mall, Acropolis Center, Plaza La Francisco, Cafeterías y restaurantes de lujo |
| Los Tres Ojos | A natural park featuring beautiful caves and lakes, it's a great spot for nature lovers. Attracts tourists looking for unique outdoor activities. | Los Tres Ojos National Park, Cueva de las Maravillas, Parque Nacional del Este |
| Boca Chica | Famous for its beautiful beaches and vibrant atmosphere. Great for tourists seeking sun, sand, and relaxation. | Boca Chica Beach, Maimón Beach, restaurants and beach bars |
| Gazcue | An eclectic neighborhood known for its artistic vibe and proximity to the historic center. Attractive for those looking for a local experience. | Museo Bellapart, Plaza Juan Baron, Calle José Enrique García |
| Naco | A residential area with a mix of commercial activities. Popular among locals and expatriates seeking a suburban feel. | Torre Empresarial, Centro Naco, parks and local markets |
| Los Jardines | A tranquil residential area with green spaces and family-friendly amenities. Ideal for longer stays and families. | Parque Mirador Sur, Centro Olímpico Juan Pablo Duarte |
| Santo Domingo Este | A growing area with developing tourism potential, showcasing local culture, ideal for affordable lodging. | Parque del Este, Laguna de los Martires |
Understanding Airbnb License Requirements & STR Laws in Santo Domingo (2026)
While Santo Domingo, Valparaiso Region, Chile currently shows low STR regulations, specific Airbnb license requirements might still exist or change. Always verify the latest short term rental regulations and Airbnb license requirements directly with local government authorities for Santo Domingo to ensure full compliance before hosting.
(Source: AirROI data, 2026, based on 3% licensed listings)
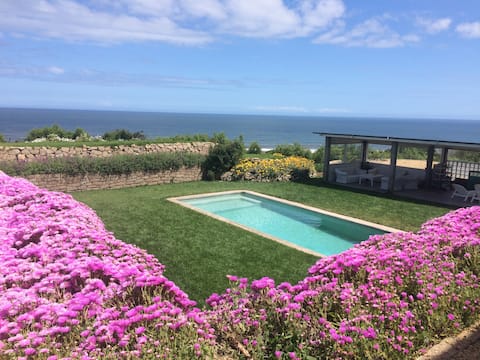
Top Performing Airbnb Properties in Santo Domingo (2026)
Benchmark your potential! Explore examples of top-performing Airbnb properties in Santo Domingobased on Trailing Twelve Month (TTM) revenue. Analyze their characteristics, revenue, occupancy rate, and ADR to understand what drives success in this market.
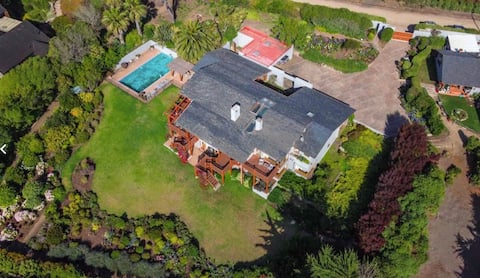
Large house on the first line, park facing the sea.
Entire Place • 6 bedrooms
"The eye of the sea", Las Rocas de Santo Domingo
Entire Place • 6 bedrooms

House in Santo Domingo for 15 ppl.
Entire Place • 6 bedrooms

Modern house with ocean views and a large garden.
Entire Place • 5 bedrooms

House with large quincho and wood-fired cuba.
Entire Place • 6 bedrooms

Modern House in Santo Domingo
Entire Place • 4 bedrooms
Note: Performance varies based on location, size, amenities, seasonality, and management quality. Data reflects the past 12 months.
Top Performing Airbnb Hosts in Santo Domingo (2026)
Learn from the best! This table showcases top-performing Airbnb hosts in Santo Domingo based on the number of properties managed and estimated total revenue over the past year. Analyze their scale and performance metrics.
| Host Name | Properties | Grossing Revenue | Stay Reviews | Avg Rating |
|---|---|---|---|---|
| Magdalena | 9 | $67,177 | 76 | 4.78/5.0 |
| M Soledad | 1 | $64,543 | 3 | 5.00/5.0 |
| Catalina | 1 | $62,984 | 84 | 4.83/5.0 |
| María Paulina | 2 | $57,521 | 24 | 4.96/5.0 |
| Antonia | 1 | $56,239 | 26 | 4.85/5.0 |
| Cristian | 1 | $54,124 | 55 | 4.95/5.0 |
| Adriana | 2 | $42,967 | 21 | 4.91/5.0 |
| Alberto | 1 | $40,861 | 12 | 5.00/5.0 |
| Claudia | 1 | $40,438 | 122 | 4.95/5.0 |
| Alicia | 1 | $39,232 | 29 | 5.00/5.0 |
Analyzing the strategies of top hosts, such as their property selection, pricing, and guest communication, can offer valuable lessons for optimizing your own Airbnb operations in Santo Domingo.
Dive Deeper: Advanced Santo Domingo STR Market Data (2026)
Ready to unlock more insights? AirROI provides access to advanced metrics and comprehensive Airbnb data for Santo Domingo. Explore detailed analytics beyond this report to refine your investment strategy, optimize pricing, and maximize your vacation rental profits.
Explore Advanced MetricsSanto Domingo Short-Term Rental Market Composition (2026): Property & Room Types
Room Type Distribution
Property Type Distribution
Market Composition Insights for Santo Domingo
- The Santo Domingo Airbnb market composition is heavily skewed towards Entire Home/Apt listings, which make up 95.2% of the 228 active rentals. This indicates strong guest preference for privacy and space.
- Looking at the property type distribution in Santo Domingo, House properties are the most common (57%), reflecting the local real estate landscape.
- Houses represent a significant 57% portion, catering likely to families or larger groups.
- Smaller segments like hotel/boutique, unique stays, others (combined 5.2%) offer potential for unique stay experiences.
Santo Domingo Airbnb Room Capacity Analysis (2026): Bedroom Distribution
Distribution of Listings by Number of Bedrooms
Room Capacity Insights for Santo Domingo
- The dominant room capacity in Santo Domingo is 3 bedrooms listings, making up 30.3% of the market. This suggests a strong demand for properties suitable for families or small groups.
- Together, 3 bedrooms and 5+ bedrooms properties represent 59.7% of the active Airbnb listings in Santo Domingo, indicating a high concentration in these sizes.
- A significant 83.8% of listings offer 3+ bedrooms, catering to larger groups and families seeking more space in Santo Domingo.
Santo Domingo Vacation Rental Guest Capacity Trends (2026)
Distribution of Listings by Guest Capacity
Guest Capacity Insights for Santo Domingo
- The most common guest capacity trend in Santo Domingo vacation rentals is listings accommodating 8+ guests (60.5%). This suggests the primary traveler segment is likely larger groups.
- Properties designed for 8+ guests and 6 guests dominate the Santo Domingo STR market, accounting for 79.4% of listings.
- 85.5% of properties accommodate 6+ guests, serving the market segment for larger families or group travel in Santo Domingo.
- On average, properties in Santo Domingo are equipped to host 6.8 guests.
Santo Domingo Airbnb Booking Patterns (2026): Available vs. Booked Days
Available Days Distribution
Booked Days Distribution
Booking Pattern Insights for Santo Domingo
- The most common availability pattern in Santo Domingo falls within the 271-366 days range, representing 78.1% of listings. This suggests many properties have significant open periods on their calendars.
- Approximately 98.7% of listings show high availability (181+ days open annually), indicating potential for increased bookings or specific owner usage patterns.
- For booked days, the 31-90 days range is most frequent in Santo Domingo (43.4%), reflecting common guest stay durations or potential owner blocking patterns.
- A notable 1.8% of properties secure long booking periods (181+ days booked per year), highlighting successful long-term rental strategies or significant owner usage.
Santo Domingo Airbnb Minimum Stay Requirements Analysis
Distribution of Listings by Minimum Night Requirement
1 Night
26 listings
11.4% of total
2 Nights
57 listings
25% of total
3 Nights
20 listings
8.8% of total
4-6 Nights
41 listings
18% of total
7-29 Nights
12 listings
5.3% of total
30+ Nights
72 listings
31.6% of total
Key Insights
- The most prevalent minimum stay requirement in Santo Domingo is 30+ Nights, adopted by 31.6% of listings. This highlights the market's preference for longer commitments.
- A significant segment (31.6%) caters to monthly stays (30+ nights) in Santo Domingo, pointing to opportunities in the extended-stay market.
Recommendations
- Align with the market by considering a 30+ Nights minimum stay, as 31.6% of Santo Domingo hosts use this setting.
- If feasible, allowing 1-night stays, especially midweek or during low season, could capture last-minute bookings, as only 11.4% currently do.
- Explore offering discounts for stays of 30+ nights to attract the 31.6% of the market seeking extended stays.
- Adjust minimum nights based on seasonality – potentially shorter during low season and longer during peak demand periods in Santo Domingo.
Santo Domingo Airbnb Cancellation Policy Trends Analysis (2026)
Limited
6 listings
2.6% of total
Flexible
53 listings
23.2% of total
Moderate
74 listings
32.5% of total
Firm
83 listings
36.4% of total
Strict
12 listings
5.3% of total
Cancellation Policy Insights for Santo Domingo
- The prevailing Airbnb cancellation policy trend in Santo Domingo is Firm, used by 36.4% of listings.
- There's a relatively balanced mix between guest-friendly (55.7%) and stricter (41.7%) policies, offering choices for different guest needs.
- Strict cancellation policies are quite rare (5.3%), potentially making listings with this policy less competitive unless justified by high demand or property type.
Recommendations for Hosts
- Consider adopting a Firm policy to align with the 36.4% market standard in Santo Domingo.
- Using a Strict policy might deter some guests, as only 5.3% of listings use it. Evaluate if potential revenue protection outweighs possible lower booking rates.
- Regularly review your cancellation policy against competitors and market demand shifts in Santo Domingo.
Santo Domingo STR Booking Lead Time Analysis (2026)
Average Booking Lead Time by Month
Booking Lead Time Insights for Santo Domingo
- The overall average booking lead time for vacation rentals in Santo Domingo is 26 days.
- Guests book furthest in advance for stays during February (average 52 days), likely coinciding with peak travel demand or local events.
- The shortest booking windows occur for stays in July (average 10 days), indicating more last-minute travel plans during this time.
- Seasonally, Winter (38 days avg.) sees the longest lead times, while Summer (14 days avg.) has the shortest, reflecting typical travel planning cycles.
Recommendations for Hosts
- Use the overall average lead time (26 days) as a baseline for your pricing and availability strategy in Santo Domingo.
- For February stays, consider implementing length-of-stay discounts or slightly higher rates for bookings made less than 52 days out to capitalize on advance planning.
- During July, focus on last-minute booking availability and promotions, as guests book with very short notice (10 days avg.).
- Target marketing efforts for the Winter season well in advance (at least 38 days) to capture early planners.
- Monitor your own booking lead times against these Santo Domingo averages to identify opportunities for dynamic pricing adjustments.
Popular & Essential Airbnb Amenities in Santo Domingo (2026)
Amenity Prevalence
Amenity Insights for Santo Domingo
- Essential amenities in Santo Domingo that guests expect include: Kitchen, Free parking on premises. Lacking these (any) could significantly impact bookings.
- Popular amenities like TV, Dishes and silverware, BBQ grill are common but not universal. Offering these can provide a competitive edge.
Recommendations for Hosts
- Ensure your listing includes all essential amenities for Santo Domingo: Kitchen, Free parking on premises.
- Prioritize adding missing essentials: Kitchen, Free parking on premises.
- Consider adding popular differentiators like TV or Dishes and silverware to increase appeal.
- Highlight unique or less common amenities you offer (e.g., hot tub, dedicated workspace, EV charger) in your listing description and photos.
- Regularly check competitor amenities in Santo Domingo to stay competitive.
Santo Domingo Airbnb Guest Demographics & Profile Analysis (2026)
Guest Profile Summary for Santo Domingo
- The typical guest profile for Airbnb in Santo Domingo consists of primarily domestic travelers (91%), often arriving from nearby Santiago, typically belonging to the Post-2000s (Gen Z/Alpha) group (50%), primarily speaking Spanish or English.
- Domestic travelers account for 91.2% of guests.
- Key international markets include Chile (91.2%) and United States (2.4%).
- Top languages spoken are Spanish (50%) followed by English (37.9%).
- A significant demographic segment is the Post-2000s (Gen Z/Alpha) group, representing 50% of guests.
Recommendations for Hosts
- Target domestic marketing efforts towards travelers from Santiago and Santiago Metropolitan Region.
- Tailor amenities and listing descriptions to appeal to the dominant Post-2000s (Gen Z/Alpha) demographic (e.g., highlight fast WiFi, smart home features, local guides).
- Highlight unique local experiences or amenities relevant to the primary guest profile.
- Consider seasonal promotions aligned with peak travel times for key origin markets.
Nearby Short-Term Rental Market Comparison
How does the Santo Domingo Airbnb market stack up against its neighbors? Compare key performance metrics like average monthly revenue, ADR, and occupancy rates in surrounding areas to understand the broader regional STR landscape.
| Market | Active Properties | Monthly Revenue | Daily Rate | Avg. Occupancy |
|---|---|---|---|---|
| Lo Barnechea | 483 | $2,018 | $372.13 | 42% |
| Zapallar | 534 | $1,323 | $258.51 | 28% |
| Litueche | 68 | $1,254 | $224.62 | 26% |
| Peñaflor | 12 | $1,232 | $164.71 | 30% |
| Las Cabras | 179 | $1,137 | $219.49 | 27% |
| Casablanca | 241 | $1,095 | $165.43 | 30% |
| La Estrella | 21 | $1,078 | $288.44 | 24% |
| Vitacura | 257 | $1,062 | $128.87 | 42% |
| Las Condes | 1,652 | $1,007 | $87.62 | 48% |
| Puchuncaví | 1,114 | $941 | $170.29 | 29% |