Sabanilla, Atlántico Airbnb Market Data 2025: STR Report & Statistics
How much can you earn on Airbnb in Sabanilla, Atlántico? Based on AirROI's 2025 dataset (December 2024 – November 2025), the short answer is $10,719 per year — at a $176 nightly rate, 20.6% occupancy, and a N/A RevPAR.
With just 19 active listings, Sabanilla is a micro-market where selective demand that rewards strong listing quality and pricing strategy. Supply grew 90.0% over the past year, yet revenue and nightly rates both trended upward — a signal that traveler demand is outpacing new inventory rather than being diluted by it. For hosts, pricing power remains intact even as competition increases.
Regulation is high and 89% of listings show active registration — compliance is the cost of entry. In a market this size, differentiated listings with strong reviews can capture outsized returns relative to the competition.

Table of Contents [hide] [show]
What Are the Key Airbnb Metrics in Sabanilla?
In Sabanilla, the headline Airbnb metrics are $10,719 in average annual revenue,20.6% occupancy, $176 ADR, and $0 in RevPAR, and guests book about 25 days in advance.
How Much Do Airbnb Hosts Earn Monthly in Sabanilla?
Understanding the monthly revenue variations for Airbnb listings in Sabanilla is key to maximizing your short term rental income potential. Seasonality significantly impacts earnings. Our analysis, based on data from the past 12 months, shows that the peak revenue month for STRs in Sabanilla is typically December, while August often presents the lowest earnings, highlighting opportunities for strategic pricing adjustments during shoulder and low seasons. Explore the typical Airbnb income in Sabanilla across different performance tiers:
- Best-in-class properties (Top 10%) achieve $3,745+ monthly, often utilizing dynamic pricing and superior guest experiences.
- Strong performing properties (Top 25%) earn $1,841 or more, indicating effective management and desirable locations/amenities.
- Typical properties (Median) generate around $956 per month, representing the average market performance.
- Entry-level properties (Bottom 25%) see earnings around $369, often with potential for optimization.
Average Monthly Airbnb Earnings Trend in Sabanilla
What Is the Monthly Airbnb Occupancy Rate in Sabanilla?
Maximize your bookings by understanding the Sabanilla STR occupancy trends. Seasonal demand shifts significantly influence how often properties are booked. Typically, Decembersees the highest demand (peak season occupancy), while May experiences the lowest (low season). Effective strategies, like adjusting minimum stays or offering promotions, can boost occupancy during slower periods. Here's how different property tiers perform in Sabanilla:
- Best-in-class properties (Top 10%) achieve 50%+ occupancy, indicating high desirability and potentially optimized availability.
- Strong performing properties (Top 25%) maintain 30% or higher occupancy, suggesting good market fit and guest satisfaction.
- Typical properties (Median) have an occupancy rate around 19%.
- Entry-level properties (Bottom 25%) average 8% occupancy, potentially facing higher vacancy.
Average Monthly Occupancy Rate Trend in Sabanilla
What Is the Average Airbnb Nightly Rate in Sabanilla?
Effective short term rental pricing strategy in Sabanilla involves understanding monthly ADR fluctuations. The Average Daily Rate (ADR) for Airbnb in Sabanilla typically peaks in December and dips lowest during September. Leveraging Airbnb dynamic pricing tools or strategies based on this seasonality can significantly boost revenue. Here's a look at the typical nightly rates achieved:
- Best-in-class properties (Top 10%) command rates of $293+ per night, often due to premium features or locations.
- Strong performing properties (Top 25%) achieve nightly rates of $220 or more.
- Typical properties (Median) charge around $147 per night.
- Entry-level properties (Bottom 25%) earn around $68 per night.
Average Daily Rate (ADR) Trend by Month in Sabanilla
What Is the RevPAR for Airbnb in Sabanilla?
RevPAR in Sabanilla is currently N/A. Because RevPAR combines nightly rates with realized occupancy, it is one of the cleanest ways to compare how efficiently listings turn demand into revenue across the market.
- Entry-level properties (Bottom 25%) see N/A RevPAR.
- Typical properties (Median) generate N/A RevPAR.
- Strong performers (Top 25%) earn N/A RevPAR.
- Best-in-class (Top 10%) achieve N/A RevPAR.
Average Monthly RevPAR Trend in Sabanilla
RevPAR Insights for Sabanilla
- RevPAR peaks in Jan and bottoms out in Jan, mirroring the broader seasonal demand pattern and suggesting opportunities for dynamic pricing.
Recommendations for Hosts
- Track your own RevPAR monthly against these Sabanilla benchmarks. If your RevPAR falls below the median of N/A, examine whether low occupancy or low ADR is the primary drag.
- Use RevPAR rather than revenue alone when comparing properties of different sizes — it normalizes for available nights and gives a more accurate picture of performance.
Get Live Sabanilla Market Intelligence 👇
Explore Real-time Analytics
When Is the Peak Season for Airbnb in Sabanilla?
Sabanilla's peak Airbnb season falls in December, January, March, while the softest stretch is May, August, November. Overall, the market shows highly seasonal trends requiring careful strategy, which should guide pricing, minimum stays, and cash-flow planning.
Peak Season (December, January, March)
- Revenue averages $1,953 per month
- Occupancy rates average 25.9%
- Daily rates average $176
Shoulder Season
- Revenue averages $1,410 per month
- Occupancy maintains around 23.9%
- Daily rates hold near $164
Low Season (May, August, November)
- Revenue drops to average $1,007 per month
- Occupancy decreases to average 17.6%
- Daily rates adjust to average $165
Seasonality Insights for Sabanilla
- Airbnb seasonality in Sabanilla is pronounced. Revenue swings sharply between peak and low months, which means pricing strategy, minimum-stay settings, and cash reserves all need to account for extended slower periods.
- During the high season, the absolute peak month showcases Sabanilla's highest earning potential, with monthly revenues climbing to $2,284, occupancy reaching 28.2%, and ADRs peaking at $181.
- Conversely, the slowest single month marks the market's lowest point — revenue may dip to $913, occupancy could drop to 16.1%, and ADRs may adjust to $162.
- Lower occupancy paired with meaningful seasonality means hosts in Sabanilla need to maximize every peak-season booking and seriously consider whether off-season pricing adjustments or minimum-stay changes can capture incremental revenue.
Seasonal Strategies for Maximizing Profit
- Peak Season: Maximize revenue through premium pricing. In a high-regulation market like Sabanilla, ensure your permit covers the number of nights you plan to book — some jurisdictions cap annual rental days.
- Low Season: Offer competitive pricing, extended-stay discounts, and flexible cancellation policies. Target off-season travelers like remote workers, budget-conscious guests, and travelers with flexible schedules.
- Shoulder Seasons: Implement dynamic pricing that bridges peak and low rates. Target weekend travelers, local events, and business visitors. Slightly more flexible terms than peak season can help maintain occupancy without deep discounting.
- In a highly seasonal market like Sabanilla, building a cash reserve during the top months is essential for covering fixed costs during the slow period. Automated pricing tools can help capture demand shifts in real time.
Do You Need a License for Airbnb in Sabanilla?
Yes, Sabanilla, Atlántico, Colombia enforces high STR regulations and 89% of active listings show registration evidence — indicating that enforcement is active and compliance is a prerequisite for operating legally. Hosts entering this market should budget for permit fees, inspections, and potential occupancy tax obligations as part of their startup costs. Always verify the latest short-term rental regulations and Airbnb license requirements directly with local government authorities for Sabanilla to ensure full compliance before hosting.
(Source: AirROI data, 2026, based on 89% licensed listings)
What Are the Best Neighborhoods for Airbnb in Sabanilla?
With a compact short-term rental market, Sabanilla gives early-mover hosts an advantage in the right neighborhoods. The areas listed below are where guest demand and local attractions converge — a useful lens for investors evaluating whether to enter this market and where to position their listing.
| Neighborhood / Area | Why Host Here? (Target Guests & Appeal) | Key Attractions & Landmarks |
|---|---|---|
| Barranquilla | The nearest major city with a vibrant culture and a growing tourism sector. It's known for its Carnival, making it a popular spot for visitors during festival season. | Barranquilla Carnival, Museo del Caribe, Malecón del Río, Bocas de Ceniza, Metropolitano Stadium |
| Puerto Colombia | A coastal town that offers beautiful beaches and a relaxed atmosphere, ideal for visitors looking to escape the city. | Puerto Colombia Beach, Zoológico de Barranquilla, Historical Pier of Puerto Colombia, Restaurants with local seafood, Tropical gardens |
| Sabanilla Centro | The central hub of Sabanilla with easy access to amenities, shops, and local eateries, popular among travelers wanting a local experience. | Local markets, Sabanilla Park, Cultural events, Restaurants and cafes |
| Soledad | A nearby municipality with affordable housing options and rapidly growing infrastructure. A great place for budget-conscious travelers and long-term stays. | Soledad Plaza, Parque de la Vida, Cultural squares |
| Santander | A neighborhood known for its residential charm and proximity to local attractions, making it convenient for families and groups. | Local parks, Shopping centers, Dining options |
| La Loma | A scenic area that offers views and tranquility away from the hustle and bustle, appealing to eco-tourists and nature lovers. | Nature trails, Rural landscapes, Local wildlife |
| Malibú | Close to the beach with a laid-back vibe, perfect for relaxing holidays and attracting beachgoers. | Malibú Beach, Beachfront restaurants, Water sports activities |
| Los Andes | An upscale neighborhood with a mix of modern and traditional Colombian architecture, drawing in tourists looking for comfort and luxury. | Shopping malls, Cafés and bars, Cultural centers |
Because Sabanilla has a high regulation profile, confirming that short-term rental permits are available in your target neighborhood is a critical first step before committing to a property purchase. Regulation can vary at the neighborhood or district level even within the same city.
What Types of Properties Are on Airbnb in Sabanilla?
Room Type Distribution
Property Type Distribution
Market Composition Insights for Sabanilla
- The Sabanilla Airbnb market composition is heavily skewed towards Entire Home/Apt listings, which make up 100% of the 19 active rentals. This indicates strong guest preference for privacy and space.
- Looking at the property type distribution in Sabanilla, Apartment/Condo properties are the most common (57.9%), reflecting the local real estate landscape.
- Houses represent a significant 21.1% portion, catering likely to families or larger groups.
Sabanilla Airbnb Room Capacity Analysis (2026): Bedroom Distribution
Distribution of Listings by Number of Bedrooms
Room Capacity Insights for Sabanilla
- The dominant room capacity in Sabanilla is 2 bedrooms listings, making up 31.6% of the market. This suggests a strong demand for properties suitable for couples or solo travelers.
- Together, 2 bedrooms and 4 bedrooms properties represent 57.9% of the active Airbnb listings in Sabanilla, indicating a high concentration in these sizes.
- A significant 52.6% of listings offer 3+ bedrooms, catering to larger groups and families seeking more space in Sabanilla.
Sabanilla Vacation Rental Guest Capacity Trends (2026)
Distribution of Listings by Guest Capacity
Guest Capacity Insights for Sabanilla
- The most common guest capacity trend in Sabanilla vacation rentals is listings accommodating 8+ guests (47.4%). This suggests the primary traveler segment is likely larger groups.
- Properties designed for 8+ guests and 2 guests dominate the Sabanilla STR market, accounting for 68.5% of listings.
- 63.2% of properties accommodate 6+ guests, serving the market segment for larger families or group travel in Sabanilla.
- On average, properties in Sabanilla are equipped to host 5.8 guests.
What Amenities Do Airbnb Guests Expect in Sabanilla?
Amenity Prevalence
Amenity Insights for Sabanilla
- Essential amenities in Sabanilla that guests expect include: Kitchen, Air conditioning, Free parking on premises. Lacking these (any) could significantly impact bookings.
- Popular amenities like Wifi, TV, Refrigerator are common but not universal. Offering these can provide a competitive edge.
- Warning: Wifi is not universally provided but is considered essential globally. Ensure reliable Wifi is offered.
Recommendations for Hosts
- Ensure your listing includes all essential amenities for Sabanilla: Kitchen, Air conditioning, Free parking on premises.
- Consider adding popular differentiators like Wifi or TV to increase appeal.
- Highlight unique or less common amenities you offer (e.g., hot tub, dedicated workspace, EV charger) in your listing description and photos.
- Regularly check competitor amenities in Sabanilla to stay competitive.
Dive Deeper: Advanced Sabanilla STR Market Data (2026)
Ready to unlock more insights? AirROI provides access to advanced metrics and comprehensive Airbnb data for Sabanilla. Explore detailed analytics beyond this report to refine your investment strategy, optimize pricing, and maximize your vacation rental profits.
Explore Advanced MetricsSabanilla Airbnb Guest Demographics & Profile Analysis (2026)
Guest Profile Summary for Sabanilla
- The typical guest profile for Airbnb in Sabanilla consists of a mix of domestic (37%) and international guests, with top international origins including United States, typically belonging to the Post-2000s (Gen Z/Alpha) group (50%), primarily speaking English or Spanish.
- Domestic travelers account for 37.1% of guests.
- Key international markets include Colombia (37.1%) and United States (31.4%).
- Top languages spoken are English (46.2%) followed by Spanish (38.5%).
- A significant demographic segment is the Post-2000s (Gen Z/Alpha) group, representing 50% of guests.
Recommendations for Hosts
- Focus marketing internationally, particularly towards travelers from United States.
- Tailor amenities and listing descriptions to appeal to the dominant Post-2000s (Gen Z/Alpha) demographic (e.g., highlight fast WiFi, smart home features, local guides).
- Highlight unique local experiences or amenities relevant to the primary guest profile.
- Consider seasonal promotions aligned with peak travel times for key origin markets.
Sabanilla Airbnb Booking Patterns (2026): Available vs. Booked Days
Available Days Distribution
Booked Days Distribution
Booking Pattern Insights for Sabanilla
- The most common availability pattern in Sabanilla falls within the 271-366 days range, representing 89.5% of listings. This suggests many properties have significant open periods on their calendars.
- Approximately 100.0% of listings show high availability (181+ days open annually), indicating potential for increased bookings or specific owner usage patterns.
- For booked days, the 1-30 days range is most frequent in Sabanilla (47.4%), reflecting common guest stay durations or potential owner blocking patterns.
How Far in Advance Do Guests Book Airbnb in Sabanilla?
Average Booking Lead Time by Month
Booking Lead Time Insights for Sabanilla
- The overall average booking lead time for vacation rentals in Sabanilla is 25 days.
- Guests book furthest in advance for stays during October (average 68 days), likely coinciding with peak travel demand or local events.
- The shortest booking windows occur for stays in June (average 11 days), indicating more last-minute travel plans during this time.
- Seasonally, Fall (50 days avg.) sees the longest lead times, while Summer (21 days avg.) has the shortest, reflecting typical travel planning cycles.
Recommendations for Hosts
- Use the overall average lead time (25 days) as a baseline for your pricing and availability strategy in Sabanilla.
- For October stays, consider implementing length-of-stay discounts or slightly higher rates for bookings made less than 68 days out to capitalize on advance planning.
- During June, focus on last-minute booking availability and promotions, as guests book with very short notice (11 days avg.).
- Target marketing efforts for the Fall season well in advance (at least 50 days) to capture early planners.
- Monitor your own booking lead times against these Sabanilla averages to identify opportunities for dynamic pricing adjustments.
Sabanilla Airbnb Minimum Stay Requirements Analysis
Distribution of Listings by Minimum Night Requirement
1 Night
12 listings
63.2% of total
2 Nights
2 listings
10.5% of total
7-29 Nights
3 listings
15.8% of total
30+ Nights
2 listings
10.5% of total
Key Insights
- The most prevalent minimum stay requirement in Sabanilla is 1 Night, adopted by 63.2% of listings. This highlights the market's preference for shorter, flexible bookings.
- A strong majority (73.7%) of the Sabanilla Airbnb data shows acceptance of very short stays (1-2 nights), indicating a dynamic, high-turnover market.
- A significant segment (10.5%) caters to monthly stays (30+ nights) in Sabanilla, pointing to opportunities in the extended-stay market.
Recommendations
- Align with the market by considering a 1 Night minimum stay, as 63.2% of Sabanilla hosts use this setting.
- Explore offering discounts for stays of 30+ nights to attract the 10.5% of the market seeking extended stays.
- Adjust minimum nights based on seasonality – potentially shorter during low season and longer during peak demand periods in Sabanilla.
Sabanilla Airbnb Cancellation Policy Trends Analysis (2026)
Limited
1 listings
5.3% of total
Flexible
6 listings
31.6% of total
Moderate
7 listings
36.8% of total
Firm
4 listings
21.1% of total
Strict
1 listings
5.3% of total
Cancellation Policy Insights for Sabanilla
- The prevailing Airbnb cancellation policy trend in Sabanilla is Moderate, used by 36.8% of listings.
- There's a relatively balanced mix between guest-friendly (68.4%) and stricter (26.4%) policies, offering choices for different guest needs.
- Strict cancellation policies are quite rare (5.3%), potentially making listings with this policy less competitive unless justified by high demand or property type.
Recommendations for Hosts
- Consider adopting a Moderate policy to align with the 36.8% market standard in Sabanilla.
- Using a Strict policy might deter some guests, as only 5.3% of listings use it. Evaluate if potential revenue protection outweighs possible lower booking rates.
- Regularly review your cancellation policy against competitors and market demand shifts in Sabanilla.
What Do the Top Airbnb Listings in Sabanilla Look Like?
Benchmark your potential! Explore examples of top-performing Airbnb properties in Sabanillabased on Trailing Twelve Month (TTM) revenue. Analyze their characteristics, revenue, occupancy rate, and ADR to understand what drives success in this market.
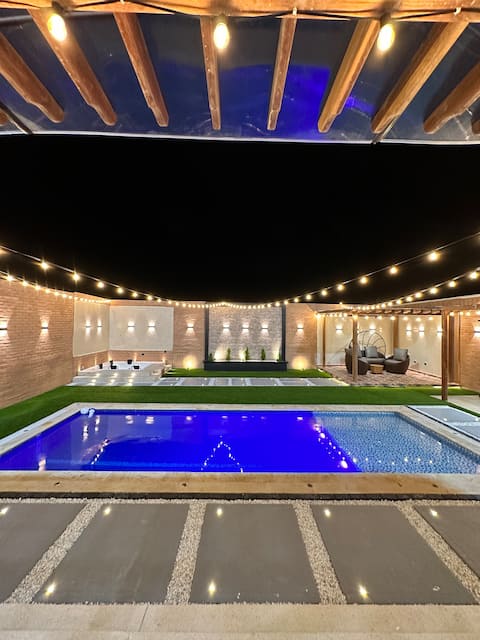
Beautiful house with ocean views
Entire Place • 4 bedrooms
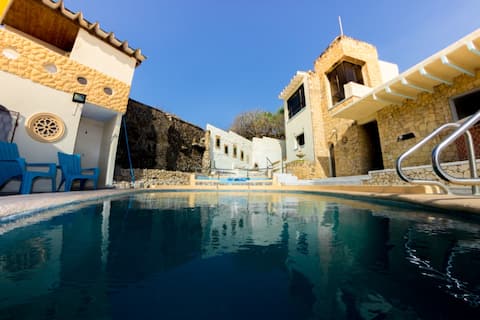
Velero Beach House & Beach Club_ RNT 109053
Entire Place • 5 bedrooms
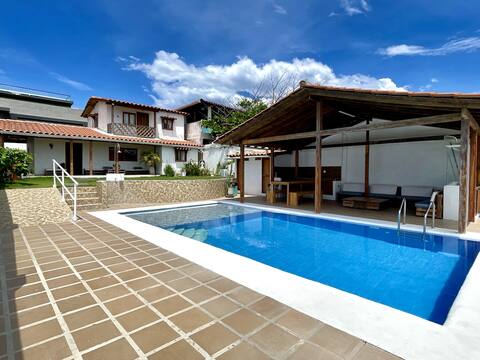
Cabin in Punta Roca
Entire Place • 4 bedrooms

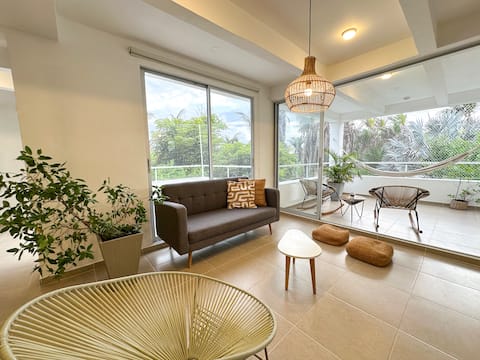
Beautiful cabin overlooking the sea, 20 minutes from B/quilla
Entire Place • 2 bedrooms

Luxury cabin in Sabanilla
Entire Place • 4 bedrooms
Apartment in Sabanilla a few steps from the sea
Entire Place • 3 bedrooms
Note: Performance varies based on location, size, amenities, seasonality, and management quality. Data reflects the past 12 months.
Who Are the Top Airbnb Hosts in Sabanilla?
Learn from the best! This table showcases top-performing Airbnb hosts in Sabanilla based on the number of properties managed and estimated total revenue over the past year. Analyze their scale and performance metrics.
| Host Name | Properties | Grossing Revenue | Stay Reviews | Avg Rating |
|---|---|---|---|---|
| Cristian | 1 | $54,379 | 12 | 4.67/5.0 |
| Mateo | 3 | $31,830 | 57 | 4.76/5.0 |
| John | 1 | $30,042 | 48 | 4.88/5.0 |
| Emnily | 1 | $22,266 | 111 | 4.70/5.0 |
| Sergio | 1 | $18,707 | 44 | 4.93/5.0 |
| Stewar | 1 | $14,415 | 1 | Not Rated |
| Dayana | 1 | $10,833 | 5 | 4.80/5.0 |
| BoaLivin | 1 | $7,010 | 2 | Not Rated |
| Mónica Patricia | 1 | $6,042 | 15 | 4.80/5.0 |
| Jean | 1 | $2,601 | 13 | 4.69/5.0 |
Analyzing the strategies of top hosts, such as their property selection, pricing, and guest communication, can offer valuable lessons for optimizing your own Airbnb operations in Sabanilla.
How Does Sabanilla's Airbnb Market Compare to Nearby Cities?
How does the Sabanilla Airbnb market stack up against its neighbors? Compare key performance metrics like average monthly revenue, ADR, and occupancy rates in surrounding areas to understand the broader regional STR landscape.
Compared with Cartagena, Sabanilla has 20 percentage points lower occupancy and about $20 higher ADR. That helps frame whether this market is winning more on demand, pricing, or both.
| Market | Active Properties | Monthly Revenue | Daily Rate | Avg. Occupancy |
|---|---|---|---|---|
| El Pueblito | 37 | $1,872 | $524.08 | 22% |
| Cartagena | 7,836 | $1,609 | $156.46 | 41% |
| Marquetalia | 10 | $1,170 | $93.49 | 37% |
| Guachaca | 35 | $871 | $120.11 | 31% |
| Juan de Acosta | 23 | $779 | $219.92 | 21% |
| Salinas Del Rey | 16 | $708 | $222.74 | 21% |
| Santa Marta | 4,510 | $701 | $85.85 | 35% |
| Dibulla | 261 | $660 | $84.88 | 30% |
| Provincia de Cartagena | 24 | $616 | $131.50 | 31% |
| Santa Verónica | 40 | $604 | $218.60 | 20% |
Frequently Asked Questions About Airbnb in Sabanilla
These quick answers summarize the most common investor and operator questions using AirROI's latest market data for Sabanilla.
How much do Airbnb hosts make in Sabanilla?
Sabanilla hosts earn about $10,719 per year on average, with an average nightly rate of $176 and RevPAR of N/A. Those figures describe the typical revenue environment for active listings in Sabanilla, Atlántico, not the ceiling for the best operators. Source: AirROI 2025 data, Sabanilla market, December 2024 to November 2025.
What is the average Airbnb occupancy rate in Sabanilla?
The average Airbnb occupancy rate in Sabanilla is 20.6%. December is the strongest month and August is the softest, so hosts should expect demand to move meaningfully throughout the year rather than stay flat.
What is the average Airbnb daily rate in Sabanilla?
Listings in Sabanilla average $176 per night. The broader pricing spread also matters: lower-performing listings cluster closer to the lower quartiles, while premium homes can price materially above the city average when demand spikes or listing quality stands out.
How many Airbnb listings are active in Sabanilla?
Sabanilla currently has about 19 active Airbnb listings in AirROI's market dataset. That supply count helps explain how competitive the market is, how much depth there is for benchmarking, and whether the market behaves like a niche destination or a scaled urban market.
How strict are short-term rental regulations in Sabanilla?
AirROI currently classifies the short-term rental regulation level in Sabanilla as High. The dataset also shows about 89.5% of listings with registration evidence. That is a market signal, not legal advice, so hosts should still confirm current licensing and compliance rules locally before listing.
What is the RevPAR for Airbnb in Sabanilla?
RevPAR in Sabanilla is about N/A. That metric combines pricing and occupancy into one efficiency number, so it is often a better quick benchmark than ADR alone when investors want to compare how well listings convert nightly rates into realized revenue.
Is Airbnb profitable in Sabanilla?
Occupancy of 20.6% means Sabanilla is a more selective market. Profitability is achievable but requires careful cost management, premium positioning, or targeting longer stays to reduce turnover. Average annual revenue is $10,719, but individual returns depend on property type, location within the city, and the host's operating efficiency.
How far in advance do guests book Airbnb in Sabanilla?
The average booking lead time in Sabanilla is about 25 days — a moderate lead time that gives hosts planning visibility while still benefiting from last-minute bookings. Hosts who understand their market's booking cadence can adjust minimum stays and pricing windows accordingly.
What are the best neighborhoods for Airbnb in Sabanilla?
Based on AirROI's analysis, some of the top neighborhoods for short-term rentals in Sabanilla include Barranquilla, Puerto Colombia, Sabanilla Centro. Each area attracts different guest profiles — from business travelers to leisure visitors — so the best location depends on the property type and target audience a host is aiming for. See the full neighborhood breakdown above.
What type of property performs best on Airbnb in Sabanilla?
entire_home listings make up 100.0% of the active supply in Sabanilla. The most common configuration does not always mean the most profitable — operators who identify underserved property types or bedroom counts can sometimes outperform the market average by filling a gap in local supply.
How does Sabanilla compare to nearby Airbnb markets?
Among neighboring markets, El Pueblito posts $22,465 in average annual revenue with 21.6% occupancy, compared to Sabanilla's $10,719 and 20.6%. Comparing nearby markets helps investors understand whether a destination's performance reflects local demand or broader regional trends.
When is the peak season for Airbnb in Sabanilla?
December is the highest-revenue month in Sabanilla, while August is the softest. The revenue spread between them indicates a highly seasonal market — revenue in the peak month is more than double the low month, so cash-flow planning and pricing automation are critical.
About AirROI Market Data
AirROI tracks over 20 million properties across 190+ countries and maintains 15+ years of historical performance data, making it one of the deepest Airbnb and STR intelligence platforms available. The analytics pipeline aggregates listing-level data monthly — revenue, occupancy, nightly rates, RevPAR, guest demographics, booking patterns, and competitive supply — so investors and operators can benchmark any market against its own history and against neighboring destinations.
Real estate investors, property managers, financial institutions, hedge funds, tourism boards, hospitality consultants, tech platforms, and academic researchers rely on AirROI data to underwrite acquisitions, optimize pricing, model macro trends, and conduct peer-reviewed research. Data is available through in-depth market reports like this one and the Airbnb API with 22 endpoints and an Airbnb MCP Server for AI agents.
AirROI proprietary analytics as of 2025-11-30. Metrics reflect trailing twelve-month aggregates from active listings. Revenue figures are market averages, not projections. Neighborhood descriptions are AI-generated and reviewed for accuracy. For full methodology, see the data methodology page.