Salgar Airbnb Market Analysis 2026: Short Term Rental Data & Vacation Rental Statistics in Atlántico, Colombia
Is Airbnb profitable in Salgar in 2026? Explore comprehensive Airbnb analytics for Salgar, Atlántico, Colombia to uncover income potential. This 2026 STR market report for Salgar, based on AirROI data from February 2025 to January 2026, reveals key trends in the niche market of 24 active listings.
Whether you're considering an Airbnb investment in Salgar, optimizing your existing vacation rental, or exploring rental arbitrage opportunities, understanding the Salgar Airbnb data is crucial. Navigating the high regulation landscape is key to maximizing your short term rental income potential. Let's dive into the specifics.
Key Salgar Airbnb Performance Metrics Overview
Monthly Airbnb Revenue Variations & Income Potential in Salgar (2026)
Understanding the monthly revenue variations for Airbnb listings in Salgar is key to maximizing your short term rental income potential. Seasonality significantly impacts earnings. Our analysis, based on data from the past 12 months, shows that the peak revenue month for STRs in Salgar is typically January, while September often presents the lowest earnings, highlighting opportunities for strategic pricing adjustments during shoulder and low seasons. Explore the typical Airbnb income in Salgar across different performance tiers:
- Best-in-class properties (Top 10%) achieve $1,546+ monthly, often utilizing dynamic pricing and superior guest experiences.
- Strong performing properties (Top 25%) earn $866 or more, indicating effective management and desirable locations/amenities.
- Typical properties (Median) generate around $377 per month, representing the average market performance.
- Entry-level properties (Bottom 25%) see earnings around $188, often with potential for optimization.
Average Monthly Airbnb Earnings Trend in Salgar
Salgar Airbnb Occupancy Rate Trends (2026)
Maximize your bookings by understanding the Salgar STR occupancy trends. Seasonal demand shifts significantly influence how often properties are booked. Typically, Aprilsees the highest demand (peak season occupancy), while October experiences the lowest (low season). Effective strategies, like adjusting minimum stays or offering promotions, can boost occupancy during slower periods. Here's how different property tiers perform in Salgar:
- Best-in-class properties (Top 10%) achieve 37%+ occupancy, indicating high desirability and potentially optimized availability.
- Strong performing properties (Top 25%) maintain 24% or higher occupancy, suggesting good market fit and guest satisfaction.
- Typical properties (Median) have an occupancy rate around 13%.
- Entry-level properties (Bottom 25%) average 7% occupancy, potentially facing higher vacancy.
Average Monthly Occupancy Rate Trend in Salgar
Average Daily Rate (ADR) Airbnb Trends in Salgar (2026)
Effective short term rental pricing strategy in Salgar involves understanding monthly ADR fluctuations. The Average Daily Rate (ADR) for Airbnb in Salgar typically peaks in December and dips lowest during February. Leveraging Airbnb dynamic pricing tools or strategies based on this seasonality can significantly boost revenue. Here's a look at the typical nightly rates achieved:
- Best-in-class properties (Top 10%) command rates of $272+ per night, often due to premium features or locations.
- Strong performing properties (Top 25%) achieve nightly rates of $141 or more.
- Typical properties (Median) charge around $79 per night.
- Entry-level properties (Bottom 25%) earn around $47 per night.
Average Daily Rate (ADR) Trend by Month in Salgar
Get Live Salgar Market Intelligence 👇

Explore Real-time Analytics
Airbnb Seasonality Analysis & Trends in Salgar (2026)
Peak Season (January, April, December)
- Revenue averages $1,067 per month
- Occupancy rates average 23.6%
- Daily rates average $131
Shoulder Season
- Revenue averages $594 per month
- Occupancy maintains around 16.8%
- Daily rates hold near $117
Low Season (May, September, October)
- Revenue drops to average $306 per month
- Occupancy decreases to average 11.4%
- Daily rates adjust to average $124
Seasonality Insights for Salgar
- The Airbnb seasonality in Salgar shows highly seasonal trends requiring careful strategy. While the sections above show seasonal averages, it's also insightful to look at the extremes:
- During the high season, the absolute peak month showcases Salgar's highest earning potential, with monthly revenues capable of climbing to $1,260, occupancy reaching a high of 31.5%, and ADRs peaking at $141.
- Conversely, the slowest single month of the year, typically falling within the low season, marks the market's lowest point. In this month, revenue might dip to $254, occupancy could drop to 6.5%, and ADRs may adjust down to $109.
- Understanding both the seasonal averages and these monthly peaks and troughs in revenue, occupancy, and ADR is crucial for maximizing your Airbnb profit potential in Salgar.
Seasonal Strategies for Maximizing Profit
- Peak Season: Maximize revenue through premium pricing and potentially longer minimum stays. Ensure high availability.
- Low Season: Offer competitive pricing, special promotions (e.g., extended stay discounts), and flexible cancellation policies. Target off-season travelers like remote workers or budget-conscious guests.
- Shoulder Seasons: Implement dynamic pricing that balances peak and low rates. Target weekend travelers or specific events. Offer slightly more flexible terms than peak season.
- Regularly analyze your own performance against these Salgar seasonality benchmarks and adjust your pricing and availability strategy accordingly.
Best Areas for Airbnb Investment in Salgar (2026)
Exploring the top neighborhoods for short-term rentals in Salgar? This section highlights key areas, outlining why they are attractive for hosts and guests, along with notable local attractions. Consider these locations based on your target guest profile and investment strategy.
| Neighborhood / Area | Why Host Here? (Target Guests & Appeal) | Key Attractions & Landmarks |
|---|---|---|
| Salgar Beach | A beautiful beach destination known for its warm waters and relaxed atmosphere. Ideal for families and tourists looking to enjoy sun, sea, and sand along with local seafood cuisine. | Salgar Beach, Pico del Águila, San Antero Beach, local seafood restaurants, fishing and water sports |
| Coveñas | A vibrant coastal area popular for its stunning beaches and lively nightlife. A great spot for young travelers looking for an active beach experience and beautiful landscapes. | Coveñas Beaches, Tolu Beaches, Isla de Múcura, San Bernardo Islands, water sports activities |
| Puerto Viejo | A quaint village that offers both relaxation and adventure, perfect for travelers looking for a blend of nature and local culture. Known for its beautiful views and warm community. | Local markets, natural pools, San Antonio beach, cultural festivals |
| Barranquilla | A major city nearby that offers cultural attractions and a bustling urban environment. Attractive for those looking for metropolitan vibes just a short drive from Salgar. | Carnival of Barranquilla, Museo del Caribe, Bocas de Cenizas, Art galleries |
| Santa Verónica | A nearby coastal area that provides a more tranquil beach experience, suitable for tourists wanting to escape the hustle and bustle. | Santa Verónica Beach, locals' markets, water activities, nature walks |
| Galapa | A suburban area near Barranquilla known for its cultural heritage and family-friendly environment, attracting visitors looking for cultural immersion. | traditional food, local music events, artisanal workshops, eco-tourism sites |
| Zipacon | An emerging rural destination known for its agricultural tourism and beautiful landscapes, ideal for guests looking to experience rural Colombia. | local farms, community projects, hiking trails, organic food markets |
| Luruaco | A small town offering authentic Colombian experiences, suitable for those looking to explore traditional cuisines and local craftsmanship. | Luruaco Lake, local artisans, cultural festivals, gastronomic fairs |
Understanding Airbnb License Requirements & STR Laws in Salgar (2026)
Yes, Salgar, Atlántico, Colombia enforces high STR regulations. Obtaining a license and ensuring compliance is almost certainly required according to current 2026 STR laws. Always verify the latest short term rental regulations and Airbnb license requirements directly with local government authorities for Salgar to ensure full compliance before hosting.
(Source: AirROI data, 2026, based on 100% licensed listings)
Top Performing Airbnb Properties in Salgar (2026)
Benchmark your potential! Explore examples of top-performing Airbnb properties in Salgarbased on Trailing Twelve Month (TTM) revenue. Analyze their characteristics, revenue, occupancy rate, and ADR to understand what drives success in this market.
country house
Entire Place • 4 bedrooms

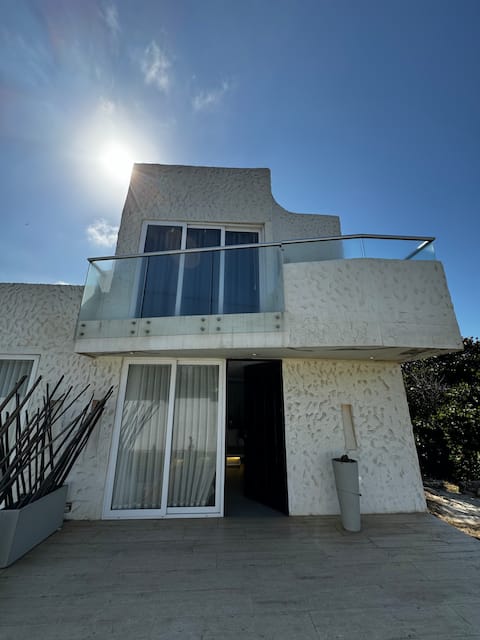
Villa Delia- A Sunset Villa by the Sea in Colombia
Entire Place • 4 bedrooms
Casa Alcatraz 3
Entire Place • 1 bedroom

Eco Lodge facing the sea - La Palma House
Entire Place • 3 bedrooms

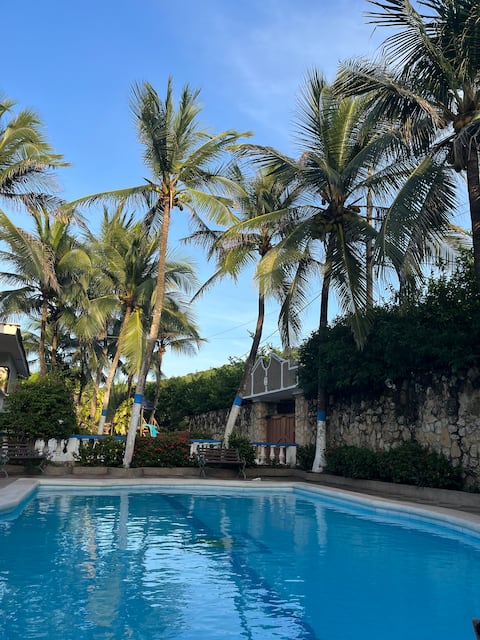
New Beach House in Salgar, steps from the sea!
Entire Place • 3 bedrooms
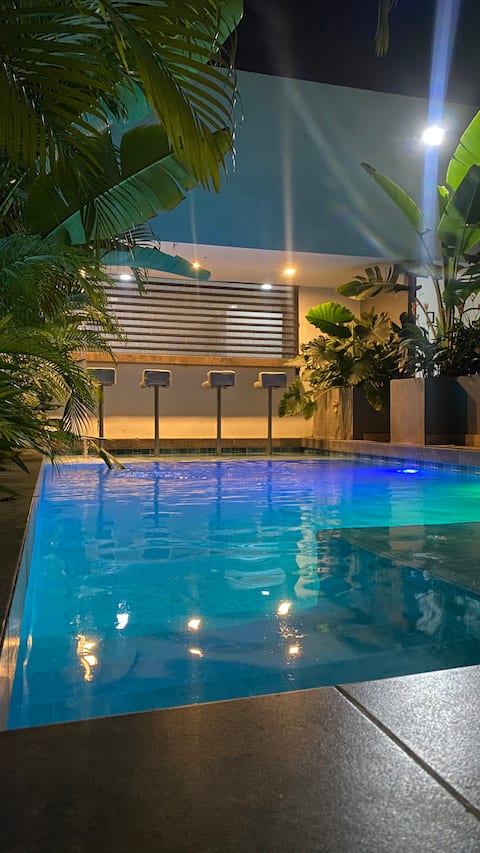
Quiet Cabin: Sea, Pool and Privacy
Entire Place • 3 bedrooms
Note: Performance varies based on location, size, amenities, seasonality, and management quality. Data reflects the past 12 months.
Top Performing Airbnb Hosts in Salgar (2026)
Learn from the best! This table showcases top-performing Airbnb hosts in Salgar based on the number of properties managed and estimated total revenue over the past year. Analyze their scale and performance metrics.
| Host Name | Properties | Grossing Revenue | Stay Reviews | Avg Rating |
|---|---|---|---|---|
| Mayra | 1 | $21,469 | 12 | 4.67/5.0 |
| Carlos | 3 | $17,608 | 88 | 4.89/5.0 |
| Giuseppe | 1 | $12,988 | 68 | 4.85/5.0 |
| Adriana | 1 | $7,417 | 16 | 4.94/5.0 |
| Carolina | 1 | $7,127 | 6 | 5.00/5.0 |
| Dubys | 1 | $6,927 | 4 | 5.00/5.0 |
| Daniel | 1 | $6,794 | 5 | 5.00/5.0 |
| Antonio | 1 | $6,095 | 90 | 4.78/5.0 |
| Beatriz | 2 | $4,281 | 60 | 4.76/5.0 |
| Esperanza | 1 | $3,746 | 3 | 5.00/5.0 |
Analyzing the strategies of top hosts, such as their property selection, pricing, and guest communication, can offer valuable lessons for optimizing your own Airbnb operations in Salgar.
Dive Deeper: Advanced Salgar STR Market Data (2026)
Ready to unlock more insights? AirROI provides access to advanced metrics and comprehensive Airbnb data for Salgar. Explore detailed analytics beyond this report to refine your investment strategy, optimize pricing, and maximize your vacation rental profits.
Explore Advanced MetricsSalgar Short-Term Rental Market Composition (2026): Property & Room Types
Room Type Distribution
Property Type Distribution
Market Composition Insights for Salgar
- The Salgar Airbnb market composition is heavily skewed towards Entire Home/Apt listings, which make up 75% of the 24 active rentals. This indicates strong guest preference for privacy and space.
- Looking at the property type distribution in Salgar, House properties are the most common (54.2%), reflecting the local real estate landscape.
- Houses represent a significant 54.2% portion, catering likely to families or larger groups.
- The presence of 8.3% Hotel/Boutique listings indicates integration with traditional hospitality.
Salgar Airbnb Room Capacity Analysis (2026): Bedroom Distribution
Distribution of Listings by Number of Bedrooms
Room Capacity Insights for Salgar
- The dominant room capacity in Salgar is 3 bedrooms listings, making up 25% of the market. This suggests a strong demand for properties suitable for families or small groups.
- Together, 3 bedrooms and 1 bedroom properties represent 50.0% of the active Airbnb listings in Salgar, indicating a high concentration in these sizes.
- A significant 37.5% of listings offer 3+ bedrooms, catering to larger groups and families seeking more space in Salgar.
Salgar Vacation Rental Guest Capacity Trends (2026)
Distribution of Listings by Guest Capacity
Guest Capacity Insights for Salgar
- The most common guest capacity trend in Salgar vacation rentals is listings accommodating 8+ guests (33.3%). This suggests the primary traveler segment is likely larger groups.
- Properties designed for 8+ guests and 2 guests dominate the Salgar STR market, accounting for 54.1% of listings.
- 37.5% of properties accommodate 6+ guests, serving the market segment for larger families or group travel in Salgar.
- On average, properties in Salgar are equipped to host 4.3 guests.
Salgar Airbnb Booking Patterns (2026): Available vs. Booked Days
Available Days Distribution
Booked Days Distribution
Booking Pattern Insights for Salgar
- The most common availability pattern in Salgar falls within the 271-366 days range, representing 100% of listings. This suggests many properties have significant open periods on their calendars.
- Approximately 100.0% of listings show high availability (181+ days open annually), indicating potential for increased bookings or specific owner usage patterns.
- For booked days, the 31-90 days range is most frequent in Salgar (54.2%), reflecting common guest stay durations or potential owner blocking patterns.
Salgar Airbnb Minimum Stay Requirements Analysis
Distribution of Listings by Minimum Night Requirement
1 Night
16 listings
66.7% of total
2 Nights
6 listings
25% of total
30+ Nights
2 listings
8.3% of total
Key Insights
- The most prevalent minimum stay requirement in Salgar is 1 Night, adopted by 66.7% of listings. This highlights the market's preference for shorter, flexible bookings.
- A strong majority (91.7%) of the Salgar Airbnb data shows acceptance of very short stays (1-2 nights), indicating a dynamic, high-turnover market.
Recommendations
- Align with the market by considering a 1 Night minimum stay, as 66.7% of Salgar hosts use this setting.
- Explore offering discounts for stays of 30+ nights to attract the 8.3% of the market seeking extended stays.
- Adjust minimum nights based on seasonality – potentially shorter during low season and longer during peak demand periods in Salgar.
Salgar Airbnb Cancellation Policy Trends Analysis (2026)
Flexible
9 listings
37.5% of total
Moderate
8 listings
33.3% of total
Firm
3 listings
12.5% of total
Strict
4 listings
16.7% of total
Cancellation Policy Insights for Salgar
- The prevailing Airbnb cancellation policy trend in Salgar is Flexible, used by 37.5% of listings.
- The market strongly favors guest-friendly terms, with 70.8% of listings offering Flexible or Moderate policies. This suggests guests in Salgar may expect booking flexibility.
Recommendations for Hosts
- Consider adopting a Flexible policy to align with the 37.5% market standard in Salgar.
- Regularly review your cancellation policy against competitors and market demand shifts in Salgar.
Salgar STR Booking Lead Time Analysis (2026)
Average Booking Lead Time by Month
Booking Lead Time Insights for Salgar
- The overall average booking lead time for vacation rentals in Salgar is 27 days.
- Guests book furthest in advance for stays during October (average 44 days), likely coinciding with peak travel demand or local events.
- The shortest booking windows occur for stays in September (average 12 days), indicating more last-minute travel plans during this time.
- Seasonally, Winter (34 days avg.) sees the longest lead times, while Summer (18 days avg.) has the shortest, reflecting typical travel planning cycles.
Recommendations for Hosts
- Use the overall average lead time (27 days) as a baseline for your pricing and availability strategy in Salgar.
- For October stays, consider implementing length-of-stay discounts or slightly higher rates for bookings made less than 44 days out to capitalize on advance planning.
- During September, focus on last-minute booking availability and promotions, as guests book with very short notice (12 days avg.).
- Target marketing efforts for the Winter season well in advance (at least 34 days) to capture early planners.
- Monitor your own booking lead times against these Salgar averages to identify opportunities for dynamic pricing adjustments.
Popular & Essential Airbnb Amenities in Salgar (2026)
Amenity Prevalence
Amenity Insights for Salgar
- Popular amenities like Kitchen, Free parking on premises, Wifi are common but not universal. Offering these can provide a competitive edge.
- Warning: Wifi is not universally provided but is considered essential globally. Ensure reliable Wifi is offered.
Recommendations for Hosts
- Consider adding popular differentiators like Kitchen or Free parking on premises to increase appeal.
- Highlight unique or less common amenities you offer (e.g., hot tub, dedicated workspace, EV charger) in your listing description and photos.
- Regularly check competitor amenities in Salgar to stay competitive.
Salgar Airbnb Guest Demographics & Profile Analysis (2026)
Guest Profile Summary for Salgar
- The typical guest profile for Airbnb in Salgar consists of primarily domestic travelers (68%), often arriving from nearby Bogotá, typically belonging to the Post-2000s (Gen Z/Alpha) group (50%), primarily speaking Spanish or English.
- Domestic travelers account for 68.0% of guests.
- Key international markets include Colombia (68%) and United States (24%).
- Top languages spoken are Spanish (53.6%) followed by English (35.7%).
- A significant demographic segment is the Post-2000s (Gen Z/Alpha) group, representing 50% of guests.
Recommendations for Hosts
- Target domestic marketing efforts towards travelers from Bogotá and Barranquilla.
- Tailor amenities and listing descriptions to appeal to the dominant Post-2000s (Gen Z/Alpha) demographic (e.g., highlight fast WiFi, smart home features, local guides).
- Highlight unique local experiences or amenities relevant to the primary guest profile.
- Consider seasonal promotions aligned with peak travel times for key origin markets.
Nearby Short-Term Rental Market Comparison
How does the Salgar Airbnb market stack up against its neighbors? Compare key performance metrics like average monthly revenue, ADR, and occupancy rates in surrounding areas to understand the broader regional STR landscape.
| Market | Active Properties | Monthly Revenue | Daily Rate | Avg. Occupancy |
|---|---|---|---|---|
| El Pueblito | 37 | $1,723 | $454.65 | 20% |
| Cartagena | 7,862 | $1,497 | $153.84 | 40% |
| Marquetalia | 10 | $1,011 | $93.30 | 33% |
| Provincia de Cartagena | 25 | $943 | $136.60 | 31% |
| Sabanilla | 16 | $905 | $194.05 | 19% |
| Guachaca | 34 | $818 | $118.47 | 29% |
| Manzanillo del Mar | 29 | $790 | $110.84 | 34% |
| Juan de Acosta | 21 | $769 | $205.60 | 20% |
| Palomino | 12 | $728 | $116.43 | 31% |
| Salinas Del Rey | 16 | $669 | $195.33 | 21% |