La Boquilla Airbnb Market Analysis 2026: Short Term Rental Data & Vacation Rental Statistics in Bolívar, Colombia
Is Airbnb profitable in La Boquilla in 2026? Explore comprehensive Airbnb analytics for La Boquilla, Bolívar, Colombia to uncover income potential. This 2026 STR market report for La Boquilla, based on AirROI data from February 2025 to January 2026, reveals key trends in the niche market of 33 active listings.
Whether you're considering an Airbnb investment in La Boquilla, optimizing your existing vacation rental, or exploring rental arbitrage opportunities, understanding the La Boquilla Airbnb data is crucial. Navigating the high regulation landscape is key to maximizing your short term rental income potential. Let's dive into the specifics.
Key La Boquilla Airbnb Performance Metrics Overview
Monthly Airbnb Revenue Variations & Income Potential in La Boquilla (2026)
Understanding the monthly revenue variations for Airbnb listings in La Boquilla is key to maximizing your short term rental income potential. Seasonality significantly impacts earnings. Our analysis, based on data from the past 12 months, shows that the peak revenue month for STRs in La Boquilla is typically December, while May often presents the lowest earnings, highlighting opportunities for strategic pricing adjustments during shoulder and low seasons. Explore the typical Airbnb income in La Boquilla across different performance tiers:
- Best-in-class properties (Top 10%) achieve $2,301+ monthly, often utilizing dynamic pricing and superior guest experiences.
- Strong performing properties (Top 25%) earn $1,529 or more, indicating effective management and desirable locations/amenities.
- Typical properties (Median) generate around $959 per month, representing the average market performance.
- Entry-level properties (Bottom 25%) see earnings around $528, often with potential for optimization.
Average Monthly Airbnb Earnings Trend in La Boquilla
La Boquilla Airbnb Occupancy Rate Trends (2026)
Maximize your bookings by understanding the La Boquilla STR occupancy trends. Seasonal demand shifts significantly influence how often properties are booked. Typically, Junesees the highest demand (peak season occupancy), while May experiences the lowest (low season). Effective strategies, like adjusting minimum stays or offering promotions, can boost occupancy during slower periods. Here's how different property tiers perform in La Boquilla:
- Best-in-class properties (Top 10%) achieve 67%+ occupancy, indicating high desirability and potentially optimized availability.
- Strong performing properties (Top 25%) maintain 49% or higher occupancy, suggesting good market fit and guest satisfaction.
- Typical properties (Median) have an occupancy rate around 30%.
- Entry-level properties (Bottom 25%) average 19% occupancy, potentially facing higher vacancy.
Average Monthly Occupancy Rate Trend in La Boquilla
Average Daily Rate (ADR) Airbnb Trends in La Boquilla (2026)
Effective short term rental pricing strategy in La Boquilla involves understanding monthly ADR fluctuations. The Average Daily Rate (ADR) for Airbnb in La Boquilla typically peaks in January and dips lowest during August. Leveraging Airbnb dynamic pricing tools or strategies based on this seasonality can significantly boost revenue. Here's a look at the typical nightly rates achieved:
- Best-in-class properties (Top 10%) command rates of $183+ per night, often due to premium features or locations.
- Strong performing properties (Top 25%) achieve nightly rates of $133 or more.
- Typical properties (Median) charge around $103 per night.
- Entry-level properties (Bottom 25%) earn around $77 per night.
Average Daily Rate (ADR) Trend by Month in La Boquilla
Get Live La Boquilla Market Intelligence 👇
Explore Real-time Analytics
Airbnb Seasonality Analysis & Trends in La Boquilla (2026)
Peak Season (December, January, November)
- Revenue averages $1,765 per month
- Occupancy rates average 36.1%
- Daily rates average $150
Shoulder Season
- Revenue averages $1,034 per month
- Occupancy maintains around 33.5%
- Daily rates hold near $104
Low Season (February, March, April)
- Revenue drops to average $0 per month
- Occupancy decreases to average 0.0%
- Daily rates adjust to average $107
Seasonality Insights for La Boquilla
- The Airbnb seasonality in La Boquilla shows highly seasonal trends requiring careful strategy. While the sections above show seasonal averages, it's also insightful to look at the extremes:
- During the high season, the absolute peak month showcases La Boquilla's highest earning potential, with monthly revenues capable of climbing to $1,953, occupancy reaching a high of 50.9%, and ADRs peaking at $166.
- Conversely, the slowest single month of the year, typically falling within the low season, marks the market's lowest point. In this month, revenue might dip to $0, occupancy could drop to 0.0%, and ADRs may adjust down to $93.
- Understanding both the seasonal averages and these monthly peaks and troughs in revenue, occupancy, and ADR is crucial for maximizing your Airbnb profit potential in La Boquilla.
Seasonal Strategies for Maximizing Profit
- Peak Season: Maximize revenue through premium pricing and potentially longer minimum stays. Ensure high availability.
- Low Season: Offer competitive pricing, special promotions (e.g., extended stay discounts), and flexible cancellation policies. Target off-season travelers like remote workers or budget-conscious guests.
- Shoulder Seasons: Implement dynamic pricing that balances peak and low rates. Target weekend travelers or specific events. Offer slightly more flexible terms than peak season.
- Regularly analyze your own performance against these La Boquilla seasonality benchmarks and adjust your pricing and availability strategy accordingly.
Best Areas for Airbnb Investment in La Boquilla (2026)
Exploring the top neighborhoods for short-term rentals in La Boquilla? This section highlights key areas, outlining why they are attractive for hosts and guests, along with notable local attractions. Consider these locations based on your target guest profile and investment strategy.
| Neighborhood / Area | Why Host Here? (Target Guests & Appeal) | Key Attractions & Landmarks |
|---|---|---|
| La Boquilla Beach | Stunning beachfront area offering beautiful views and a relaxed atmosphere, perfect for beach lovers and vacationers looking for an escape. | La Boquilla Beach, Mar Caribe, Water sports activities, Local seafood restaurants, Beachfront bars |
| Historic Center of Cartagena | Rich in culture and history, this area attracts tourists interested in exploring colonial architecture and vibrant culture, making it a prime location for Airbnb hosting. | Castillo San Felipe de Barajas, Walled City of Cartagena, Plaza Santo Domingo, Getsemani neighborhood, Palacio de la Inquisición |
| Bocagrande | A popular and upscale neighborhood in Cartagena, known for its modern beachfront apartments, shopping, and nightlife, attracting a variety of travelers. | Bocagrande Beach, Shopping malls, Fine dining restaurants, Nightclubs and bars, Casino |
| San Diego | Located within Cartagena's old town, San Diego is vibrant, charming, and full of local culture, making it a sought-after location for visitors. | Plaza San Diego, San Pedro Claver Church, Art galleries, Boutique shops, Cafe culture |
| Getsemaní | A trendy, bohemian neighborhood filled with street art, hostels, and cultural experiences, popular with young travelers and backpackers. | Street art, Plaza de la Trinidad, Cafe and bar scene, Live music venues, Cultural festivals |
| Castillo Grande | An upscale residential area with modern condos and access to beaches, ideal for families and travelers looking for a quieter stay with amenities. | Castillo Grande Beach, Local parks, Restaurants, Shopping centers, Water sports activities |
| Manzanillo del Mar | A quieter area outside the bustling city, providing a more tranquil environment for guests looking to relax and enjoy nature. | Manzanillo Beach, Eco-tourism, Nature reserves, Water sports, Local eateries |
| Tierra Bomba Island | A unique escape from the city, this island offers stunning beaches and a peaceful environment, ideal for travelers looking for a getaway experience. | Natural beaches, Snorkeling, Local fishing, Beachfront cabins, Relaxed atmosphere |
Understanding Airbnb License Requirements & STR Laws in La Boquilla (2026)
Yes, La Boquilla, Bolívar, Colombia enforces high STR regulations. Obtaining a license and ensuring compliance is almost certainly required according to current 2026 STR laws. Always verify the latest short term rental regulations and Airbnb license requirements directly with local government authorities for La Boquilla to ensure full compliance before hosting.
(Source: AirROI data, 2026, based on 91% licensed listings)
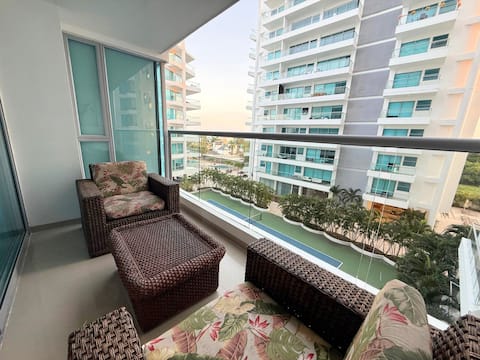
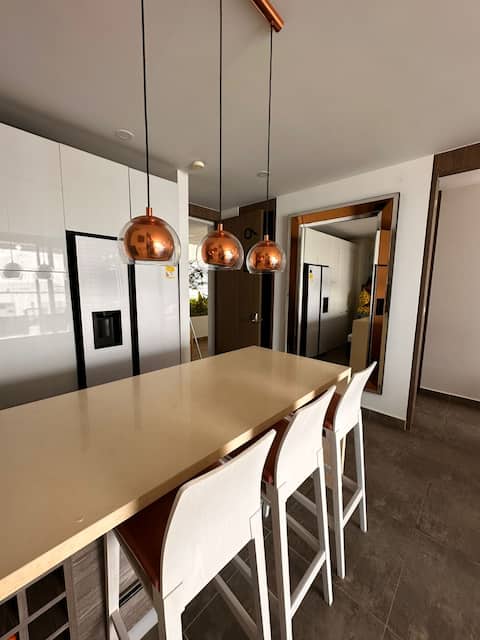
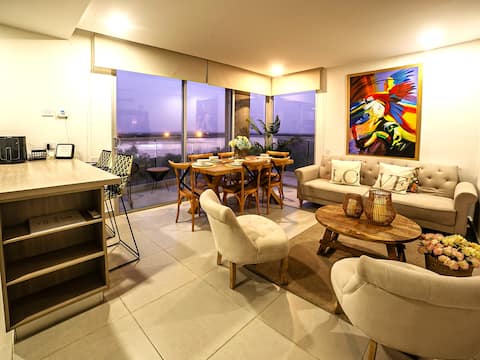
Top Performing Airbnb Properties in La Boquilla (2026)
Benchmark your potential! Explore examples of top-performing Airbnb properties in La Boquillabased on Trailing Twelve Month (TTM) revenue. Analyze their characteristics, revenue, occupancy rate, and ADR to understand what drives success in this market.
Sea Exit | Parking | 2 Pools | Sonesta
Entire Place • 3 bedrooms

Clifford Place Morros Epic - Direct Beach Access
Entire Place • 2 bedrooms
Beach Penthouse
Entire Place • 2 bedrooms
3P Encanto Rentals Sunno Beach
Entire Place • 3 bedrooms
Apartment with a Jacuzzi near the beach
Entire Place • 2 bedrooms

Apartment with a Jacuzzi in the Martinique building
Entire Place • 1 bedroom
Note: Performance varies based on location, size, amenities, seasonality, and management quality. Data reflects the past 12 months.
Top Performing Airbnb Hosts in La Boquilla (2026)
Learn from the best! This table showcases top-performing Airbnb hosts in La Boquilla based on the number of properties managed and estimated total revenue over the past year. Analyze their scale and performance metrics.
| Host Name | Properties | Grossing Revenue | Stay Reviews | Avg Rating |
|---|---|---|---|---|
| Luxury Rentals CTG | 3 | $35,624 | 72 | 4.50/5.0 |
| Amalia | 3 | $32,939 | 36 | 4.70/5.0 |
| Arturo | 4 | $26,761 | 30 | 4.50/5.0 |
| Juan Camilo | 1 | $23,249 | 11 | 5.00/5.0 |
| Tatiana | 1 | $17,328 | 3 | 5.00/5.0 |
| Camilo | 2 | $13,738 | 13 | 4.58/5.0 |
| Andres | 1 | $9,257 | 8 | 5.00/5.0 |
| Ruben | 1 | $8,704 | 5 | 5.00/5.0 |
| Kelly Johana | 1 | $8,131 | 2 | Not Rated |
| Encanto Rentals | 1 | $7,729 | 24 | 4.92/5.0 |
Analyzing the strategies of top hosts, such as their property selection, pricing, and guest communication, can offer valuable lessons for optimizing your own Airbnb operations in La Boquilla.
Dive Deeper: Advanced La Boquilla STR Market Data (2026)
Ready to unlock more insights? AirROI provides access to advanced metrics and comprehensive Airbnb data for La Boquilla. Explore detailed analytics beyond this report to refine your investment strategy, optimize pricing, and maximize your vacation rental profits.
Explore Advanced MetricsLa Boquilla Short-Term Rental Market Composition (2026): Property & Room Types
Room Type Distribution
Property Type Distribution
Market Composition Insights for La Boquilla
- The La Boquilla Airbnb market composition is heavily skewed towards Entire Home/Apt listings, which make up 100% of the 33 active rentals. This indicates strong guest preference for privacy and space.
- Looking at the property type distribution in La Boquilla, Apartment/Condo properties are the most common (93.9%), reflecting the local real estate landscape.
La Boquilla Airbnb Room Capacity Analysis (2026): Bedroom Distribution
Distribution of Listings by Number of Bedrooms
Room Capacity Insights for La Boquilla
- The dominant room capacity in La Boquilla is 2 bedrooms listings, making up 45.5% of the market. This suggests a strong demand for properties suitable for couples or solo travelers.
- Together, 2 bedrooms and 1 bedroom properties represent 72.8% of the active Airbnb listings in La Boquilla, indicating a high concentration in these sizes.
- A significant 27.3% of listings offer 3+ bedrooms, catering to larger groups and families seeking more space in La Boquilla.
La Boquilla Vacation Rental Guest Capacity Trends (2026)
Distribution of Listings by Guest Capacity
Guest Capacity Insights for La Boquilla
- The most common guest capacity trend in La Boquilla vacation rentals is listings accommodating 6 guests (30.3%). This suggests the primary traveler segment is likely larger groups.
- Properties designed for 6 guests and 4 guests dominate the La Boquilla STR market, accounting for 60.6% of listings.
- 60.6% of properties accommodate 6+ guests, serving the market segment for larger families or group travel in La Boquilla.
- On average, properties in La Boquilla are equipped to host 5.8 guests.
La Boquilla Airbnb Booking Patterns (2026): Available vs. Booked Days
Available Days Distribution
Booked Days Distribution
Booking Pattern Insights for La Boquilla
- The most common availability pattern in La Boquilla falls within the 271-366 days range, representing 75.8% of listings. This suggests many properties have significant open periods on their calendars.
- Approximately 100.0% of listings show high availability (181+ days open annually), indicating potential for increased bookings or specific owner usage patterns.
- For booked days, the 31-90 days range is most frequent in La Boquilla (57.6%), reflecting common guest stay durations or potential owner blocking patterns.
La Boquilla Airbnb Minimum Stay Requirements Analysis
Distribution of Listings by Minimum Night Requirement
1 Night
5 listings
15.2% of total
2 Nights
10 listings
30.3% of total
3 Nights
1 listings
3% of total
30+ Nights
17 listings
51.5% of total
Key Insights
- The most prevalent minimum stay requirement in La Boquilla is 30+ Nights, adopted by 51.5% of listings. This highlights the market's preference for longer commitments.
- A significant segment (51.5%) caters to monthly stays (30+ nights) in La Boquilla, pointing to opportunities in the extended-stay market.
Recommendations
- Align with the market by considering a 30+ Nights minimum stay, as 51.5% of La Boquilla hosts use this setting.
- If feasible, allowing 1-night stays, especially midweek or during low season, could capture last-minute bookings, as only 15.2% currently do.
- A 2-night minimum appears standard (30.3%). Consider this for weekends or peak periods.
- Explore offering discounts for stays of 30+ nights to attract the 51.5% of the market seeking extended stays.
- Adjust minimum nights based on seasonality – potentially shorter during low season and longer during peak demand periods in La Boquilla.
La Boquilla Airbnb Cancellation Policy Trends Analysis (2026)
Limited
1 listings
3% of total
Flexible
15 listings
45.5% of total
Moderate
13 listings
39.4% of total
Firm
4 listings
12.1% of total
Cancellation Policy Insights for La Boquilla
- The prevailing Airbnb cancellation policy trend in La Boquilla is Flexible, used by 45.5% of listings.
- The market strongly favors guest-friendly terms, with 84.9% of listings offering Flexible or Moderate policies. This suggests guests in La Boquilla may expect booking flexibility.
Recommendations for Hosts
- Consider adopting a Flexible policy to align with the 45.5% market standard in La Boquilla.
- Regularly review your cancellation policy against competitors and market demand shifts in La Boquilla.
La Boquilla STR Booking Lead Time Analysis (2026)
Average Booking Lead Time by Month
Booking Lead Time Insights for La Boquilla
- The overall average booking lead time for vacation rentals in La Boquilla is 33 days.
- Guests book furthest in advance for stays during November (average 50 days), likely coinciding with peak travel demand or local events.
- The shortest booking windows occur for stays in April (average 0 days), indicating more last-minute travel plans during this time.
- Seasonally, Fall (32 days avg.) sees the longest lead times, while Spring (1 days avg.) has the shortest, reflecting typical travel planning cycles.
Recommendations for Hosts
- Use the overall average lead time (33 days) as a baseline for your pricing and availability strategy in La Boquilla.
- For November stays, consider implementing length-of-stay discounts or slightly higher rates for bookings made less than 50 days out to capitalize on advance planning.
- During April, focus on last-minute booking availability and promotions, as guests book with very short notice (0 days avg.).
- Target marketing efforts for the Fall season well in advance (at least 32 days) to capture early planners.
- Monitor your own booking lead times against these La Boquilla averages to identify opportunities for dynamic pricing adjustments.
Popular & Essential Airbnb Amenities in La Boquilla (2026)
Amenity Prevalence
Amenity Insights for La Boquilla
- Essential amenities in La Boquilla that guests expect include: Air conditioning, Wifi, Kitchen, TV, Pool, Free parking on premises. Lacking these (any) could significantly impact bookings.
- Popular amenities like Washer, Beach access, Cooking basics are common but not universal. Offering these can provide a competitive edge.
Recommendations for Hosts
- Ensure your listing includes all essential amenities for La Boquilla: Air conditioning, Wifi, Kitchen, TV, Pool, Free parking on premises.
- Prioritize adding missing essentials: Free parking on premises.
- Consider adding popular differentiators like Washer or Beach access to increase appeal.
- Highlight unique or less common amenities you offer (e.g., hot tub, dedicated workspace, EV charger) in your listing description and photos.
- Regularly check competitor amenities in La Boquilla to stay competitive.
La Boquilla Airbnb Guest Demographics & Profile Analysis (2026)
Guest Profile Summary for La Boquilla
- The typical guest profile for Airbnb in La Boquilla consists of a mix of domestic (62%) and international guests, often arriving from nearby Bogotá, typically belonging to the Post-2000s (Gen Z/Alpha) group (50%), primarily speaking Spanish or English.
- Domestic travelers account for 61.8% of guests.
- Key international markets include Colombia (61.8%) and United States (18.2%).
- Top languages spoken are Spanish (54%) followed by English (36%).
- A significant demographic segment is the Post-2000s (Gen Z/Alpha) group, representing 50% of guests.
Recommendations for Hosts
- Target domestic marketing efforts towards travelers from Bogotá and Barranquilla.
- Tailor amenities and listing descriptions to appeal to the dominant Post-2000s (Gen Z/Alpha) demographic (e.g., highlight fast WiFi, smart home features, local guides).
- Highlight unique local experiences or amenities relevant to the primary guest profile.
- Consider seasonal promotions aligned with peak travel times for key origin markets.
Nearby Short-Term Rental Market Comparison
How does the La Boquilla Airbnb market stack up against its neighbors? Compare key performance metrics like average monthly revenue, ADR, and occupancy rates in surrounding areas to understand the broader regional STR landscape.
| Market | Active Properties | Monthly Revenue | Daily Rate | Avg. Occupancy |
|---|---|---|---|---|
| El Pueblito | 37 | $1,723 | $454.65 | 20% |
| Cartagena | 7,862 | $1,497 | $153.84 | 40% |
| San Antero | 62 | $1,230 | $229.19 | 23% |
| Tolú | 287 | $1,210 | $187.24 | 24% |
| Coveñas | 389 | $1,025 | $143.10 | 31% |
| Provincia de Cartagena | 25 | $943 | $136.60 | 31% |
| Sabanilla | 16 | $905 | $194.05 | 19% |
| Manzanillo del Mar | 29 | $790 | $110.84 | 34% |
| Juan de Acosta | 21 | $769 | $205.60 | 20% |
| Santiago de Tolú | 44 | $744 | $144.99 | 25% |