Tibasosa Airbnb Market Analysis 2026: Short Term Rental Data & Vacation Rental Statistics in Boyacá, Colombia
Is Airbnb profitable in Tibasosa in 2026? Explore comprehensive Airbnb analytics for Tibasosa, Boyacá, Colombia to uncover income potential. This 2026 STR market report for Tibasosa, based on AirROI data from February 2025 to January 2026, reveals key trends in the niche market of 25 active listings.
Whether you're considering an Airbnb investment in Tibasosa, optimizing your existing vacation rental, or exploring rental arbitrage opportunities, understanding the Tibasosa Airbnb data is crucial. Navigating the high regulation landscape is key to maximizing your short term rental income potential. Let's dive into the specifics.
Key Tibasosa Airbnb Performance Metrics Overview
Monthly Airbnb Revenue Variations & Income Potential in Tibasosa (2026)
Understanding the monthly revenue variations for Airbnb listings in Tibasosa is key to maximizing your short term rental income potential. Seasonality significantly impacts earnings. Our analysis, based on data from the past 12 months, shows that the peak revenue month for STRs in Tibasosa is typically December, while March often presents the lowest earnings, highlighting opportunities for strategic pricing adjustments during shoulder and low seasons. Explore the typical Airbnb income in Tibasosa across different performance tiers:
- Best-in-class properties (Top 10%) achieve $939+ monthly, often utilizing dynamic pricing and superior guest experiences.
- Strong performing properties (Top 25%) earn $606 or more, indicating effective management and desirable locations/amenities.
- Typical properties (Median) generate around $326 per month, representing the average market performance.
- Entry-level properties (Bottom 25%) see earnings around $147, often with potential for optimization.
Average Monthly Airbnb Earnings Trend in Tibasosa
Tibasosa Airbnb Occupancy Rate Trends (2026)
Maximize your bookings by understanding the Tibasosa STR occupancy trends. Seasonal demand shifts significantly influence how often properties are booked. Typically, Decembersees the highest demand (peak season occupancy), while March experiences the lowest (low season). Effective strategies, like adjusting minimum stays or offering promotions, can boost occupancy during slower periods. Here's how different property tiers perform in Tibasosa:
- Best-in-class properties (Top 10%) achieve 37%+ occupancy, indicating high desirability and potentially optimized availability.
- Strong performing properties (Top 25%) maintain 28% or higher occupancy, suggesting good market fit and guest satisfaction.
- Typical properties (Median) have an occupancy rate around 17%.
- Entry-level properties (Bottom 25%) average 9% occupancy, potentially facing higher vacancy.
Average Monthly Occupancy Rate Trend in Tibasosa
Average Daily Rate (ADR) Airbnb Trends in Tibasosa (2026)
Effective short term rental pricing strategy in Tibasosa involves understanding monthly ADR fluctuations. The Average Daily Rate (ADR) for Airbnb in Tibasosa typically peaks in September and dips lowest during October. Leveraging Airbnb dynamic pricing tools or strategies based on this seasonality can significantly boost revenue. Here's a look at the typical nightly rates achieved:
- Best-in-class properties (Top 10%) command rates of $171+ per night, often due to premium features or locations.
- Strong performing properties (Top 25%) achieve nightly rates of $84 or more.
- Typical properties (Median) charge around $55 per night.
- Entry-level properties (Bottom 25%) earn around $37 per night.
Average Daily Rate (ADR) Trend by Month in Tibasosa
Get Live Tibasosa Market Intelligence 👇

Explore Real-time Analytics
Airbnb Seasonality Analysis & Trends in Tibasosa (2026)
Peak Season (December, September, August)
- Revenue averages $639 per month
- Occupancy rates average 27.2%
- Daily rates average $81
Shoulder Season
- Revenue averages $454 per month
- Occupancy maintains around 20.2%
- Daily rates hold near $78
Low Season (January, February, March)
- Revenue drops to average $280 per month
- Occupancy decreases to average 14.5%
- Daily rates adjust to average $78
Seasonality Insights for Tibasosa
- The Airbnb seasonality in Tibasosa shows highly seasonal trends requiring careful strategy. While the sections above show seasonal averages, it's also insightful to look at the extremes:
- During the high season, the absolute peak month showcases Tibasosa's highest earning potential, with monthly revenues capable of climbing to $753, occupancy reaching a high of 36.5%, and ADRs peaking at $85.
- Conversely, the slowest single month of the year, typically falling within the low season, marks the market's lowest point. In this month, revenue might dip to $255, occupancy could drop to 11.2%, and ADRs may adjust down to $72.
- Understanding both the seasonal averages and these monthly peaks and troughs in revenue, occupancy, and ADR is crucial for maximizing your Airbnb profit potential in Tibasosa.
Seasonal Strategies for Maximizing Profit
- Peak Season: Maximize revenue through premium pricing and potentially longer minimum stays. Ensure high availability.
- Low Season: Offer competitive pricing, special promotions (e.g., extended stay discounts), and flexible cancellation policies. Target off-season travelers like remote workers or budget-conscious guests.
- Shoulder Seasons: Implement dynamic pricing that balances peak and low rates. Target weekend travelers or specific events. Offer slightly more flexible terms than peak season.
- Regularly analyze your own performance against these Tibasosa seasonality benchmarks and adjust your pricing and availability strategy accordingly.
Best Areas for Airbnb Investment in Tibasosa (2026)
Exploring the top neighborhoods for short-term rentals in Tibasosa? This section highlights key areas, outlining why they are attractive for hosts and guests, along with notable local attractions. Consider these locations based on your target guest profile and investment strategy.
| Neighborhood / Area | Why Host Here? (Target Guests & Appeal) | Key Attractions & Landmarks |
|---|---|---|
| Tibasosa Centro | The heart of Tibasosa, known for its colonial architecture and traditional markets. A great location for tourists wanting to experience local culture and traditions. | Main Square, San Miguel Arcángel Church, Tibasosa Colonial Houses, Local Artisan Shops, Cultural Festivals |
| El Peñon | A scenic area with beautiful views and outdoor activities like hiking and bird watching. Ideal for nature lovers and adventure seekers. | El Peñon Viewpoint, Hiking Trails, Bird Watching, Natural Parks |
| Laguna de Tota | Located near Tibasosa, this is the largest lake in Colombia, perfect for water sports, fishing, and relaxation. A popular weekend getaway. | Water Sports, Fishing Tours, Scenic Views, Nature Trails |
| Nearby Villas de Leyva | A short drive from Tibasosa, this town is famous for its well-preserved colonial architecture and rich history, attracting tourists year-round. | Plaza Mayor, Casa Museo de Antonio Narino, Paleontological Museum, Cultural Festivals |
| Los Andes | A mountainous region close to Tibasosa, known for its eco-tourism, hiking, and the scenic beauty of the Andes. | Mountain Trails, Ecotourism Activities, Cultural Tours |
| Chicamocha Canyon | One of the most impressive canyons in Colombia, great for adventure tourism such as rafting and paragliding, attracting thrill-seekers. | Paragliding, Rafting, Scenic Views, Outdoor Adventures |
| Cocuy National Park | A bit farther away but a major attraction for hikers and nature enthusiasts, known for its stunning landscapes and biodiversity. | Glacier Trails, Wildlife Spotting, Camping, Hiking |
| Cultural Experiences | Focus on hosting cultural experiences in Tibasosa, where tourists can engage with artisans, farmers, and local traditions. | Artisan Workshops, Local Gastronomy Tours, Cultural Immersion Experiences |
Understanding Airbnb License Requirements & STR Laws in Tibasosa (2026)
Yes, Tibasosa, Boyacá, Colombia enforces high STR regulations. Obtaining a license and ensuring compliance is almost certainly required according to current 2026 STR laws. Always verify the latest short term rental regulations and Airbnb license requirements directly with local government authorities for Tibasosa to ensure full compliance before hosting.
(Source: AirROI data, 2026, based on 92% licensed listings)
Top Performing Airbnb Properties in Tibasosa (2026)
Benchmark your potential! Explore examples of top-performing Airbnb properties in Tibasosabased on Trailing Twelve Month (TTM) revenue. Analyze their characteristics, revenue, occupancy rate, and ADR to understand what drives success in this market.

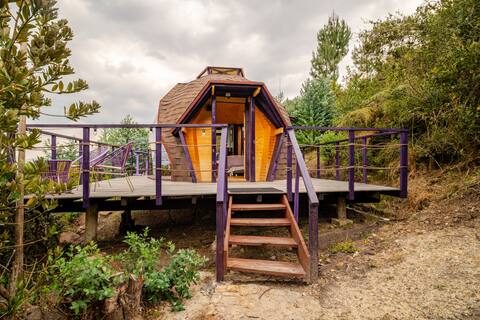
Finca La Mara, Colonial House with Forest
Entire Place • 6 bedrooms

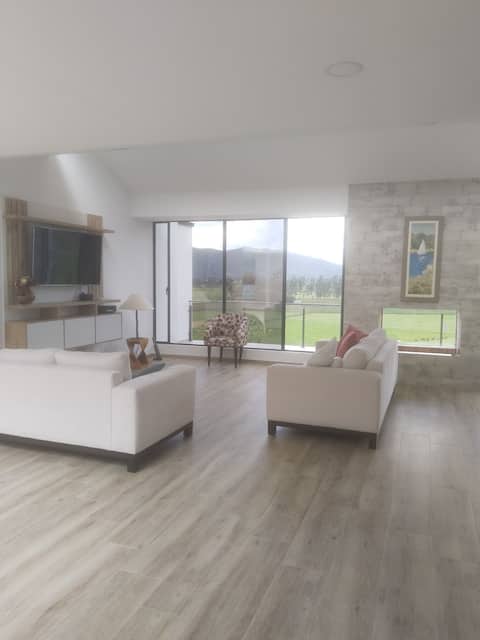
Casa Quinta San Martin
Entire Place • 4 bedrooms
El Madrigal, Catleya
Entire Place • N/A
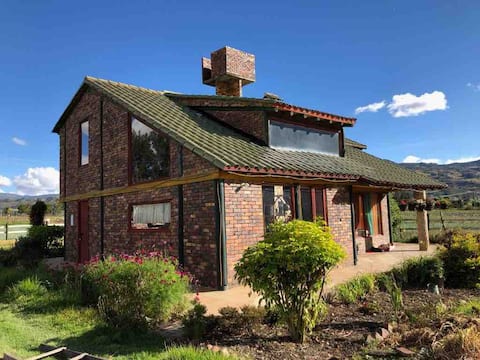
Cozy cottage in the countryside in Tibasosa
Entire Place • 3 bedrooms
Casa Normandía
Private Room • 3 bedrooms

Huitaca Wonderful country cabin in Tibasosa.
Entire Place • 4 bedrooms
Note: Performance varies based on location, size, amenities, seasonality, and management quality. Data reflects the past 12 months.
Top Performing Airbnb Hosts in Tibasosa (2026)
Learn from the best! This table showcases top-performing Airbnb hosts in Tibasosa based on the number of properties managed and estimated total revenue over the past year. Analyze their scale and performance metrics.
| Host Name | Properties | Grossing Revenue | Stay Reviews | Avg Rating |
|---|---|---|---|---|
| Esperanza | 3 | $13,612 | 26 | 4.71/5.0 |
| Paola | 3 | $12,026 | 102 | 4.83/5.0 |
| Pedro | 1 | $7,626 | 24 | 4.96/5.0 |
| María Jose | 2 | $7,570 | 5 | 4.00/5.0 |
| Victoria | 1 | $6,635 | 130 | 4.72/5.0 |
| Edilma | 1 | $5,945 | 2 | Not Rated |
| Diego Joaquin | 1 | $5,175 | 27 | 4.96/5.0 |
| Finca La Aurora Tibasosa | 1 | $3,445 | 12 | 4.83/5.0 |
| Maria | 1 | $2,997 | 34 | 4.94/5.0 |
| Maribel | 1 | $2,886 | 124 | 4.90/5.0 |
Analyzing the strategies of top hosts, such as their property selection, pricing, and guest communication, can offer valuable lessons for optimizing your own Airbnb operations in Tibasosa.
Dive Deeper: Advanced Tibasosa STR Market Data (2026)
Ready to unlock more insights? AirROI provides access to advanced metrics and comprehensive Airbnb data for Tibasosa. Explore detailed analytics beyond this report to refine your investment strategy, optimize pricing, and maximize your vacation rental profits.
Explore Advanced MetricsTibasosa Short-Term Rental Market Composition (2026): Property & Room Types
Room Type Distribution
Property Type Distribution
Market Composition Insights for Tibasosa
- The Tibasosa Airbnb market composition is heavily skewed towards Entire Home/Apt listings, which make up 72% of the 25 active rentals. This indicates strong guest preference for privacy and space.
- Looking at the property type distribution in Tibasosa, House properties are the most common (44%), reflecting the local real estate landscape.
- Houses represent a significant 44% portion, catering likely to families or larger groups.
- The presence of 16% Hotel/Boutique listings indicates integration with traditional hospitality.
- Smaller segments like others (combined 4.0%) offer potential for unique stay experiences.
Tibasosa Airbnb Room Capacity Analysis (2026): Bedroom Distribution
Distribution of Listings by Number of Bedrooms
Room Capacity Insights for Tibasosa
- The dominant room capacity in Tibasosa is 3 bedrooms listings, making up 24% of the market. This suggests a strong demand for properties suitable for families or small groups.
- Together, 3 bedrooms and 4 bedrooms properties represent 40.0% of the active Airbnb listings in Tibasosa, indicating a high concentration in these sizes.
- A significant 56.0% of listings offer 3+ bedrooms, catering to larger groups and families seeking more space in Tibasosa.
Tibasosa Vacation Rental Guest Capacity Trends (2026)
Distribution of Listings by Guest Capacity
Guest Capacity Insights for Tibasosa
- The most common guest capacity trend in Tibasosa vacation rentals is listings accommodating 8+ guests (44%). This suggests the primary traveler segment is likely larger groups.
- Properties designed for 8+ guests and 2 guests dominate the Tibasosa STR market, accounting for 56.0% of listings.
- 52.0% of properties accommodate 6+ guests, serving the market segment for larger families or group travel in Tibasosa.
- On average, properties in Tibasosa are equipped to host 5.1 guests.
Tibasosa Airbnb Booking Patterns (2026): Available vs. Booked Days
Available Days Distribution
Booked Days Distribution
Booking Pattern Insights for Tibasosa
- The most common availability pattern in Tibasosa falls within the 271-366 days range, representing 96% of listings. This suggests many properties have significant open periods on their calendars.
- Approximately 100.0% of listings show high availability (181+ days open annually), indicating potential for increased bookings or specific owner usage patterns.
- For booked days, the 31-90 days range is most frequent in Tibasosa (56%), reflecting common guest stay durations or potential owner blocking patterns.
Tibasosa Airbnb Minimum Stay Requirements Analysis
Distribution of Listings by Minimum Night Requirement
1 Night
20 listings
80% of total
2 Nights
3 listings
12% of total
30+ Nights
2 listings
8% of total
Key Insights
- The most prevalent minimum stay requirement in Tibasosa is 1 Night, adopted by 80% of listings. This highlights the market's preference for shorter, flexible bookings.
- A strong majority (92.0%) of the Tibasosa Airbnb data shows acceptance of very short stays (1-2 nights), indicating a dynamic, high-turnover market.
Recommendations
- Align with the market by considering a 1 Night minimum stay, as 80% of Tibasosa hosts use this setting.
- Explore offering discounts for stays of 30+ nights to attract the 8% of the market seeking extended stays.
- Adjust minimum nights based on seasonality – potentially shorter during low season and longer during peak demand periods in Tibasosa.
Tibasosa Airbnb Cancellation Policy Trends Analysis (2026)
Flexible
14 listings
56% of total
Moderate
2 listings
8% of total
Firm
9 listings
36% of total
Cancellation Policy Insights for Tibasosa
- The prevailing Airbnb cancellation policy trend in Tibasosa is Flexible, used by 56% of listings.
- There's a relatively balanced mix between guest-friendly (64.0%) and stricter (36.0%) policies, offering choices for different guest needs.
Recommendations for Hosts
- Consider adopting a Flexible policy to align with the 56% market standard in Tibasosa.
- Given the high prevalence of Flexible policies (56%), offering this can enhance booking appeal, especially during shoulder seasons.
- Regularly review your cancellation policy against competitors and market demand shifts in Tibasosa.
Tibasosa STR Booking Lead Time Analysis (2026)
Average Booking Lead Time by Month
Booking Lead Time Insights for Tibasosa
- The overall average booking lead time for vacation rentals in Tibasosa is 21 days.
- Guests book furthest in advance for stays during October (average 37 days), likely coinciding with peak travel demand or local events.
- The shortest booking windows occur for stays in February (average 11 days), indicating more last-minute travel plans during this time.
- Seasonally, Fall (24 days avg.) sees the longest lead times, while Spring (16 days avg.) has the shortest, reflecting typical travel planning cycles.
Recommendations for Hosts
- Use the overall average lead time (21 days) as a baseline for your pricing and availability strategy in Tibasosa.
- For October stays, consider implementing length-of-stay discounts or slightly higher rates for bookings made less than 37 days out to capitalize on advance planning.
- During February, focus on last-minute booking availability and promotions, as guests book with very short notice (11 days avg.).
- Target marketing efforts for the Fall season well in advance (at least 24 days) to capture early planners.
- Monitor your own booking lead times against these Tibasosa averages to identify opportunities for dynamic pricing adjustments.
Popular & Essential Airbnb Amenities in Tibasosa (2026)
Amenity Prevalence
Amenity Insights for Tibasosa
- Essential amenities in Tibasosa that guests expect include: Wifi, Free parking on premises. Lacking these (any) could significantly impact bookings.
- Popular amenities like Pets allowed, TV, Hot water are common but not universal. Offering these can provide a competitive edge.
Recommendations for Hosts
- Ensure your listing includes all essential amenities for Tibasosa: Wifi, Free parking on premises.
- Prioritize adding missing essentials: Free parking on premises.
- Consider adding popular differentiators like Pets allowed or TV to increase appeal.
- Highlight unique or less common amenities you offer (e.g., hot tub, dedicated workspace, EV charger) in your listing description and photos.
- Regularly check competitor amenities in Tibasosa to stay competitive.
Tibasosa Airbnb Guest Demographics & Profile Analysis (2026)
Guest Profile Summary for Tibasosa
- The typical guest profile for Airbnb in Tibasosa consists of primarily domestic travelers (88%), often arriving from nearby Bogotá, typically belonging to the Post-2000s (Gen Z/Alpha) group (50%), primarily speaking Spanish or English.
- Domestic travelers account for 88.3% of guests.
- Key international markets include Colombia (88.3%) and United States (8.3%).
- Top languages spoken are Spanish (44.4%) followed by English (37.8%).
- A significant demographic segment is the Post-2000s (Gen Z/Alpha) group, representing 50% of guests.
Recommendations for Hosts
- Target domestic marketing efforts towards travelers from Bogotá and Bogota.
- Tailor amenities and listing descriptions to appeal to the dominant Post-2000s (Gen Z/Alpha) demographic (e.g., highlight fast WiFi, smart home features, local guides).
- Highlight unique local experiences or amenities relevant to the primary guest profile.
- Consider seasonal promotions aligned with peak travel times for key origin markets.
Nearby Short-Term Rental Market Comparison
How does the Tibasosa Airbnb market stack up against its neighbors? Compare key performance metrics like average monthly revenue, ADR, and occupancy rates in surrounding areas to understand the broader regional STR landscape.
| Market | Active Properties | Monthly Revenue | Daily Rate | Avg. Occupancy |
|---|---|---|---|---|
| Anapoima | 286 | $1,775 | $279.24 | 26% |
| Apulo | 105 | $1,505 | $270.37 | 22% |
| Cundinamarca | 11 | $1,424 | $201.05 | 23% |
| Nilo | 73 | $1,138 | $246.56 | 21% |
| Quebradanegra | 22 | $977 | $189.40 | 16% |
| El Imperio | 14 | $900 | $193.43 | 19% |
| Villeta | 325 | $860 | $181.51 | 20% |
| Nimaima | 34 | $843 | $195.06 | 19% |
| Sasaima | 42 | $810 | $132.40 | 22% |
| Vergara | 11 | $773 | $106.11 | 25% |