Villamaría Airbnb Market Analysis 2026: Short Term Rental Data & Vacation Rental Statistics in Caldas, Colombia
Is Airbnb profitable in Villamaría in 2026? Explore comprehensive Airbnb analytics for Villamaría, Caldas, Colombia to uncover income potential. This 2026 STR market report for Villamaría, based on AirROI data from February 2025 to January 2026, reveals key trends in the niche market of 27 active listings.
Whether you're considering an Airbnb investment in Villamaría, optimizing your existing vacation rental, or exploring rental arbitrage opportunities, understanding the Villamaría Airbnb data is crucial. Navigating the high regulation landscape is key to maximizing your short term rental income potential. Let's dive into the specifics.
Key Villamaría Airbnb Performance Metrics Overview
Monthly Airbnb Revenue Variations & Income Potential in Villamaría (2026)
Understanding the monthly revenue variations for Airbnb listings in Villamaría is key to maximizing your short term rental income potential. Seasonality significantly impacts earnings. Our analysis, based on data from the past 12 months, shows that the peak revenue month for STRs in Villamaría is typically December, while May often presents the lowest earnings, highlighting opportunities for strategic pricing adjustments during shoulder and low seasons. Explore the typical Airbnb income in Villamaría across different performance tiers:
- Best-in-class properties (Top 10%) achieve $1,076+ monthly, often utilizing dynamic pricing and superior guest experiences.
- Strong performing properties (Top 25%) earn $668 or more, indicating effective management and desirable locations/amenities.
- Typical properties (Median) generate around $325 per month, representing the average market performance.
- Entry-level properties (Bottom 25%) see earnings around $104, often with potential for optimization.
Average Monthly Airbnb Earnings Trend in Villamaría
Villamaría Airbnb Occupancy Rate Trends (2026)
Maximize your bookings by understanding the Villamaría STR occupancy trends. Seasonal demand shifts significantly influence how often properties are booked. Typically, Octobersees the highest demand (peak season occupancy), while May experiences the lowest (low season). Effective strategies, like adjusting minimum stays or offering promotions, can boost occupancy during slower periods. Here's how different property tiers perform in Villamaría:
- Best-in-class properties (Top 10%) achieve 57%+ occupancy, indicating high desirability and potentially optimized availability.
- Strong performing properties (Top 25%) maintain 36% or higher occupancy, suggesting good market fit and guest satisfaction.
- Typical properties (Median) have an occupancy rate around 19%.
- Entry-level properties (Bottom 25%) average 9% occupancy, potentially facing higher vacancy.
Average Monthly Occupancy Rate Trend in Villamaría
Average Daily Rate (ADR) Airbnb Trends in Villamaría (2026)
Effective short term rental pricing strategy in Villamaría involves understanding monthly ADR fluctuations. The Average Daily Rate (ADR) for Airbnb in Villamaría typically peaks in December and dips lowest during September. Leveraging Airbnb dynamic pricing tools or strategies based on this seasonality can significantly boost revenue. Here's a look at the typical nightly rates achieved:
- Best-in-class properties (Top 10%) command rates of $125+ per night, often due to premium features or locations.
- Strong performing properties (Top 25%) achieve nightly rates of $88 or more.
- Typical properties (Median) charge around $59 per night.
- Entry-level properties (Bottom 25%) earn around $27 per night.
Average Daily Rate (ADR) Trend by Month in Villamaría
Get Live Villamaría Market Intelligence 👇

Explore Real-time Analytics
Airbnb Seasonality Analysis & Trends in Villamaría (2026)
Peak Season (December, June, October)
- Revenue averages $627 per month
- Occupancy rates average 30.7%
- Daily rates average $72
Shoulder Season
- Revenue averages $468 per month
- Occupancy maintains around 27.3%
- Daily rates hold near $70
Low Season (March, April, May)
- Revenue drops to average $326 per month
- Occupancy decreases to average 16.1%
- Daily rates adjust to average $72
Seasonality Insights for Villamaría
- The Airbnb seasonality in Villamaría shows highly seasonal trends requiring careful strategy. While the sections above show seasonal averages, it's also insightful to look at the extremes:
- During the high season, the absolute peak month showcases Villamaría's highest earning potential, with monthly revenues capable of climbing to $720, occupancy reaching a high of 33.7%, and ADRs peaking at $74.
- Conversely, the slowest single month of the year, typically falling within the low season, marks the market's lowest point. In this month, revenue might dip to $237, occupancy could drop to 12.7%, and ADRs may adjust down to $60.
- Understanding both the seasonal averages and these monthly peaks and troughs in revenue, occupancy, and ADR is crucial for maximizing your Airbnb profit potential in Villamaría.
Seasonal Strategies for Maximizing Profit
- Peak Season: Maximize revenue through premium pricing and potentially longer minimum stays. Ensure high availability.
- Low Season: Offer competitive pricing, special promotions (e.g., extended stay discounts), and flexible cancellation policies. Target off-season travelers like remote workers or budget-conscious guests.
- Shoulder Seasons: Implement dynamic pricing that balances peak and low rates. Target weekend travelers or specific events. Offer slightly more flexible terms than peak season.
- Regularly analyze your own performance against these Villamaría seasonality benchmarks and adjust your pricing and availability strategy accordingly.
Best Areas for Airbnb Investment in Villamaría (2026)
Exploring the top neighborhoods for short-term rentals in Villamaría? This section highlights key areas, outlining why they are attractive for hosts and guests, along with notable local attractions. Consider these locations based on your target guest profile and investment strategy.
| Neighborhood / Area | Why Host Here? (Target Guests & Appeal) | Key Attractions & Landmarks |
|---|---|---|
| Parque Principal de Villamaría | The central park of Villamaría, a social and cultural hub for locals and visitors alike. Ideal for tourists looking for local experiences and events. | Parque Principal, Catedral de Villamaría, Artisan market, Local Festivals |
| Cerro de Las Tres Cruces | A popular hiking destination offering stunning views of the region. Great location for nature lovers and adventure seekers. | Hiking Trails, Scenic Views, Wildlife Watching |
| Café del Parque | A vibrant coffee shop area in Villamaría, ideal for coffee enthusiasts and those looking to relax in a cozy atmosphere. | Local Coffee Shops, Cultural Events, Artisan Crafts |
| Zona Rosa | The nightlife hub of Villamaría, filled with bars, restaurants, and entertainment options for a lively evening out. | Nightclubs, Bars, Live Music Venues |
| Embalse del Guatapé | A beautiful reservoir popular for water sports and leisure activities. Attractive for families and groups looking for outdoor fun. | Water Sports, Fishing, Picnic Areas |
| Plaza de Mercado | The main market area offering a taste of local culture, cuisine, and produce. Great for guests wanting to explore local foods. | Local Produce, Food Stalls, Cultural Exchange |
| Historic Center | Rich in history and architecture, this area provides guests with insights into the local culture and heritage. | Colonial Architecture, Museums, Historical Tours |
| Surrounding Coffee Farms | Villamaría is located in the heart of coffee country, perfect for guests wanting to tour coffee farms and taste the local brew. | Coffee Tours, Scenic Landscapes, Cultural Experiences |
Understanding Airbnb License Requirements & STR Laws in Villamaría (2026)
Yes, Villamaría, Caldas, Colombia enforces high STR regulations. Obtaining a license and ensuring compliance is almost certainly required according to current 2026 STR laws. Always verify the latest short term rental regulations and Airbnb license requirements directly with local government authorities for Villamaría to ensure full compliance before hosting.
(Source: AirROI data, 2026, based on 100% licensed listings)
Top Performing Airbnb Properties in Villamaría (2026)
Benchmark your potential! Explore examples of top-performing Airbnb properties in Villamaríabased on Trailing Twelve Month (TTM) revenue. Analyze their characteristics, revenue, occupancy rate, and ADR to understand what drives success in this market.

Relaxing and Quiet House Estate, Close to Manizales
Entire Place • 4 bedrooms
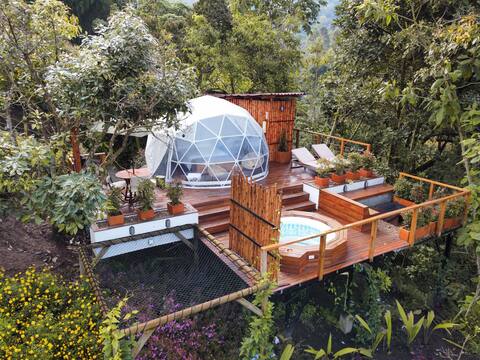
Private room/NazcaGlamping
Entire Place • 1 bedroom
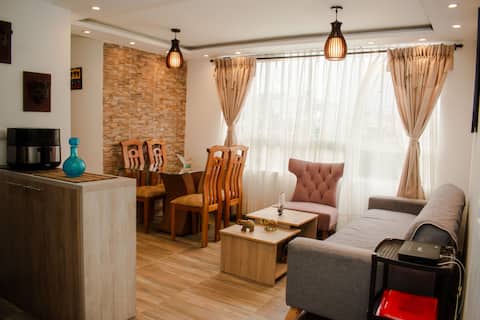
Excellent location, just like home, peace and quiet.
Entire Place • 3 bedrooms
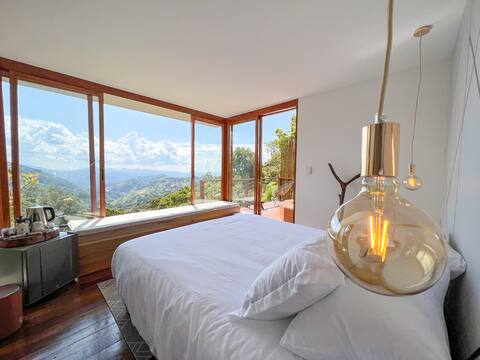
Connecting with Nature
Entire Place • 1 bedroom

Domo entre Monta
Private Room • 1 bedroom

Glamping between mountains
Entire Place • 1 bedroom
Note: Performance varies based on location, size, amenities, seasonality, and management quality. Data reflects the past 12 months.
Top Performing Airbnb Hosts in Villamaría (2026)
Learn from the best! This table showcases top-performing Airbnb hosts in Villamaría based on the number of properties managed and estimated total revenue over the past year. Analyze their scale and performance metrics.
| Host Name | Properties | Grossing Revenue | Stay Reviews | Avg Rating |
|---|---|---|---|---|
| Sebastian | 2 | $18,406 | 40 | 4.95/5.0 |
| Anlly | 1 | $15,219 | 20 | 4.80/5.0 |
| Maria Francedy | 2 | $13,194 | 3 | Not Rated |
| Valentina | 2 | $7,982 | 31 | 4.97/5.0 |
| Daniel | 1 | $7,635 | 88 | 4.92/5.0 |
| Glamping | 1 | $4,890 | 8 | 4.88/5.0 |
| Anderson | 1 | $4,640 | 44 | 4.86/5.0 |
| Jenny | 1 | $4,570 | 65 | 4.91/5.0 |
| Irene | 1 | $4,557 | 34 | 4.79/5.0 |
| Jorge | 2 | $4,241 | 14 | 4.67/5.0 |
Analyzing the strategies of top hosts, such as their property selection, pricing, and guest communication, can offer valuable lessons for optimizing your own Airbnb operations in Villamaría.
Dive Deeper: Advanced Villamaría STR Market Data (2026)
Ready to unlock more insights? AirROI provides access to advanced metrics and comprehensive Airbnb data for Villamaría. Explore detailed analytics beyond this report to refine your investment strategy, optimize pricing, and maximize your vacation rental profits.
Explore Advanced MetricsVillamaría Short-Term Rental Market Composition (2026): Property & Room Types
Room Type Distribution
Property Type Distribution
Market Composition Insights for Villamaría
- The Villamaría Airbnb market composition is heavily skewed towards Entire Home/Apt listings, which make up 81.5% of the 27 active rentals. This indicates strong guest preference for privacy and space.
- Looking at the property type distribution in Villamaría, Apartment/Condo properties are the most common (37%), reflecting the local real estate landscape.
- Houses represent a significant 22.2% portion, catering likely to families or larger groups.
- The presence of 7.4% Hotel/Boutique listings indicates integration with traditional hospitality.
Villamaría Airbnb Room Capacity Analysis (2026): Bedroom Distribution
Distribution of Listings by Number of Bedrooms
Room Capacity Insights for Villamaría
- The dominant room capacity in Villamaría is 1 bedroom listings, making up 63% of the market. This suggests a strong demand for properties suitable for couples or solo travelers.
- Together, 1 bedroom and 3 bedrooms properties represent 74.1% of the active Airbnb listings in Villamaría, indicating a high concentration in these sizes.
- With over half the market (63%) consisting of studios or 1-bedroom units, Villamaría is particularly well-suited for individuals or couples.
Villamaría Vacation Rental Guest Capacity Trends (2026)
Distribution of Listings by Guest Capacity
Guest Capacity Insights for Villamaría
- The most common guest capacity trend in Villamaría vacation rentals is listings accommodating 2 guests (33.3%). This suggests the primary traveler segment is likely couples or solo travelers.
- Properties designed for 2 guests and 4 guests dominate the Villamaría STR market, accounting for 51.8% of listings.
- 29.6% of properties accommodate 6+ guests, serving the market segment for larger families or group travel in Villamaría.
- On average, properties in Villamaría are equipped to host 4.1 guests.
Villamaría Airbnb Booking Patterns (2026): Available vs. Booked Days
Available Days Distribution
Booked Days Distribution
Booking Pattern Insights for Villamaría
- The most common availability pattern in Villamaría falls within the 271-366 days range, representing 77.8% of listings. This suggests many properties have significant open periods on their calendars.
- Approximately 96.3% of listings show high availability (181+ days open annually), indicating potential for increased bookings or specific owner usage patterns.
- For booked days, the 31-90 days range is most frequent in Villamaría (40.7%), reflecting common guest stay durations or potential owner blocking patterns.
- A notable 3.7% of properties secure long booking periods (181+ days booked per year), highlighting successful long-term rental strategies or significant owner usage.
Villamaría Airbnb Minimum Stay Requirements Analysis
Distribution of Listings by Minimum Night Requirement
1 Night
23 listings
85.2% of total
2 Nights
2 listings
7.4% of total
30+ Nights
2 listings
7.4% of total
Key Insights
- The most prevalent minimum stay requirement in Villamaría is 1 Night, adopted by 85.2% of listings. This highlights the market's preference for shorter, flexible bookings.
- A strong majority (92.6%) of the Villamaría Airbnb data shows acceptance of very short stays (1-2 nights), indicating a dynamic, high-turnover market.
Recommendations
- Align with the market by considering a 1 Night minimum stay, as 85.2% of Villamaría hosts use this setting.
- Explore offering discounts for stays of 30+ nights to attract the 7.4% of the market seeking extended stays.
- Adjust minimum nights based on seasonality – potentially shorter during low season and longer during peak demand periods in Villamaría.
Villamaría Airbnb Cancellation Policy Trends Analysis (2026)
Flexible
18 listings
66.7% of total
Moderate
5 listings
18.5% of total
Firm
3 listings
11.1% of total
Strict
1 listings
3.7% of total
Cancellation Policy Insights for Villamaría
- The prevailing Airbnb cancellation policy trend in Villamaría is Flexible, used by 66.7% of listings.
- The market strongly favors guest-friendly terms, with 85.2% of listings offering Flexible or Moderate policies. This suggests guests in Villamaría may expect booking flexibility.
- Strict cancellation policies are quite rare (3.7%), potentially making listings with this policy less competitive unless justified by high demand or property type.
Recommendations for Hosts
- Consider adopting a Flexible policy to align with the 66.7% market standard in Villamaría.
- Given the high prevalence of Flexible policies (66.7%), offering this can enhance booking appeal, especially during shoulder seasons.
- Using a Strict policy might deter some guests, as only 3.7% of listings use it. Evaluate if potential revenue protection outweighs possible lower booking rates.
- Regularly review your cancellation policy against competitors and market demand shifts in Villamaría.
Villamaría STR Booking Lead Time Analysis (2026)
Average Booking Lead Time by Month
Booking Lead Time Insights for Villamaría
- The overall average booking lead time for vacation rentals in Villamaría is 22 days.
- Guests book furthest in advance for stays during August (average 41 days), likely coinciding with peak travel demand or local events.
- The shortest booking windows occur for stays in June (average 11 days), indicating more last-minute travel plans during this time.
- Seasonally, Fall (33 days avg.) sees the longest lead times, while Spring (18 days avg.) has the shortest, reflecting typical travel planning cycles.
Recommendations for Hosts
- Use the overall average lead time (22 days) as a baseline for your pricing and availability strategy in Villamaría.
- For August stays, consider implementing length-of-stay discounts or slightly higher rates for bookings made less than 41 days out to capitalize on advance planning.
- During June, focus on last-minute booking availability and promotions, as guests book with very short notice (11 days avg.).
- Target marketing efforts for the Fall season well in advance (at least 33 days) to capture early planners.
- Monitor your own booking lead times against these Villamaría averages to identify opportunities for dynamic pricing adjustments.
Popular & Essential Airbnb Amenities in Villamaría (2026)
Amenity Prevalence
Amenity Insights for Villamaría
- Popular amenities like Free parking on premises, Wifi, Kitchen are common but not universal. Offering these can provide a competitive edge.
- Warning: Wifi is not universally provided but is considered essential globally. Ensure reliable Wifi is offered.
Recommendations for Hosts
- Consider adding popular differentiators like Free parking on premises or Wifi to increase appeal.
- Highlight unique or less common amenities you offer (e.g., hot tub, dedicated workspace, EV charger) in your listing description and photos.
- Regularly check competitor amenities in Villamaría to stay competitive.
Villamaría Airbnb Guest Demographics & Profile Analysis (2026)
Guest Profile Summary for Villamaría
- The typical guest profile for Airbnb in Villamaría consists of primarily domestic travelers (67%), often arriving from nearby Bogotá, typically belonging to the Post-2000s (Gen Z/Alpha) group (50%), primarily speaking Spanish or English.
- Domestic travelers account for 67.4% of guests.
- Key international markets include Colombia (67.4%) and United States (14.7%).
- Top languages spoken are Spanish (50%) followed by English (34.3%).
- A significant demographic segment is the Post-2000s (Gen Z/Alpha) group, representing 50% of guests.
Recommendations for Hosts
- Target domestic marketing efforts towards travelers from Bogotá and Medellín.
- Tailor amenities and listing descriptions to appeal to the dominant Post-2000s (Gen Z/Alpha) demographic (e.g., highlight fast WiFi, smart home features, local guides).
- Highlight unique local experiences or amenities relevant to the primary guest profile.
- Consider seasonal promotions aligned with peak travel times for key origin markets.
Nearby Short-Term Rental Market Comparison
How does the Villamaría Airbnb market stack up against its neighbors? Compare key performance metrics like average monthly revenue, ADR, and occupancy rates in surrounding areas to understand the broader regional STR landscape.
| Market | Active Properties | Monthly Revenue | Daily Rate | Avg. Occupancy |
|---|---|---|---|---|
| San Nicolás | 18 | $3,446 | $345.13 | 34% |
| Cauca Viejo | 26 | $2,181 | $298.12 | 27% |
| Córdoba | 23 | $1,794 | $269.01 | 22% |
| Anapoima | 286 | $1,775 | $279.24 | 26% |
| Popalito | 10 | $1,529 | $250.41 | 22% |
| Apulo | 105 | $1,505 | $270.37 | 22% |
| Cundinamarca | 11 | $1,424 | $201.05 | 23% |
| La Pintada | 20 | $1,381 | $258.80 | 24% |
| Fredonia | 14 | $1,284 | $201.88 | 23% |
| Antioquia | 13 | $1,267 | $292.11 | 23% |