Yopal Airbnb Market Analysis 2026: Short Term Rental Data & Vacation Rental Statistics in Casanare, Colombia
Is Airbnb profitable in Yopal in 2026? Explore comprehensive Airbnb analytics for Yopal, Casanare, Colombia to uncover income potential. This 2026 STR market report for Yopal, based on AirROI data from February 2025 to January 2026, reveals key trends in the niche market of 79 active listings.
Whether you're considering an Airbnb investment in Yopal, optimizing your existing vacation rental, or exploring rental arbitrage opportunities, understanding the Yopal Airbnb data is crucial. Navigating the high regulation landscape is key to maximizing your short term rental income potential. Let's dive into the specifics.
Key Yopal Airbnb Performance Metrics Overview
Monthly Airbnb Revenue Variations & Income Potential in Yopal (2026)
Understanding the monthly revenue variations for Airbnb listings in Yopal is key to maximizing your short term rental income potential. Seasonality significantly impacts earnings. Our analysis, based on data from the past 12 months, shows that the peak revenue month for STRs in Yopal is typically December, while August often presents the lowest earnings, highlighting opportunities for strategic pricing adjustments during shoulder and low seasons. Explore the typical Airbnb income in Yopal across different performance tiers:
- Best-in-class properties (Top 10%) achieve $849+ monthly, often utilizing dynamic pricing and superior guest experiences.
- Strong performing properties (Top 25%) earn $536 or more, indicating effective management and desirable locations/amenities.
- Typical properties (Median) generate around $266 per month, representing the average market performance.
- Entry-level properties (Bottom 25%) see earnings around $149, often with potential for optimization.
Average Monthly Airbnb Earnings Trend in Yopal
Yopal Airbnb Occupancy Rate Trends (2026)
Maximize your bookings by understanding the Yopal STR occupancy trends. Seasonal demand shifts significantly influence how often properties are booked. Typically, Februarysees the highest demand (peak season occupancy), while January experiences the lowest (low season). Effective strategies, like adjusting minimum stays or offering promotions, can boost occupancy during slower periods. Here's how different property tiers perform in Yopal:
- Best-in-class properties (Top 10%) achieve 64%+ occupancy, indicating high desirability and potentially optimized availability.
- Strong performing properties (Top 25%) maintain 41% or higher occupancy, suggesting good market fit and guest satisfaction.
- Typical properties (Median) have an occupancy rate around 21%.
- Entry-level properties (Bottom 25%) average 10% occupancy, potentially facing higher vacancy.
Average Monthly Occupancy Rate Trend in Yopal
Average Daily Rate (ADR) Airbnb Trends in Yopal (2026)
Effective short term rental pricing strategy in Yopal involves understanding monthly ADR fluctuations. The Average Daily Rate (ADR) for Airbnb in Yopal typically peaks in January and dips lowest during February. Leveraging Airbnb dynamic pricing tools or strategies based on this seasonality can significantly boost revenue. Here's a look at the typical nightly rates achieved:
- Best-in-class properties (Top 10%) command rates of $156+ per night, often due to premium features or locations.
- Strong performing properties (Top 25%) achieve nightly rates of $81 or more.
- Typical properties (Median) charge around $36 per night.
- Entry-level properties (Bottom 25%) earn around $26 per night.
Average Daily Rate (ADR) Trend by Month in Yopal
Get Live Yopal Market Intelligence 👇

Explore Real-time Analytics
Airbnb Seasonality Analysis & Trends in Yopal (2026)
Peak Season (December, March, April)
- Revenue averages $535 per month
- Occupancy rates average 27.4%
- Daily rates average $66
Shoulder Season
- Revenue averages $389 per month
- Occupancy maintains around 29.2%
- Daily rates hold near $67
Low Season (May, July, August)
- Revenue drops to average $306 per month
- Occupancy decreases to average 26.6%
- Daily rates adjust to average $64
Seasonality Insights for Yopal
- The Airbnb seasonality in Yopal shows highly seasonal trends requiring careful strategy. While the sections above show seasonal averages, it's also insightful to look at the extremes:
- During the high season, the absolute peak month showcases Yopal's highest earning potential, with monthly revenues capable of climbing to $674, occupancy reaching a high of 32.5%, and ADRs peaking at $72.
- Conversely, the slowest single month of the year, typically falling within the low season, marks the market's lowest point. In this month, revenue might dip to $280, occupancy could drop to 20.3%, and ADRs may adjust down to $62.
- Understanding both the seasonal averages and these monthly peaks and troughs in revenue, occupancy, and ADR is crucial for maximizing your Airbnb profit potential in Yopal.
Seasonal Strategies for Maximizing Profit
- Peak Season: Maximize revenue through premium pricing and potentially longer minimum stays. Ensure high availability.
- Low Season: Offer competitive pricing, special promotions (e.g., extended stay discounts), and flexible cancellation policies. Target off-season travelers like remote workers or budget-conscious guests.
- Shoulder Seasons: Implement dynamic pricing that balances peak and low rates. Target weekend travelers or specific events. Offer slightly more flexible terms than peak season.
- Regularly analyze your own performance against these Yopal seasonality benchmarks and adjust your pricing and availability strategy accordingly.
Best Areas for Airbnb Investment in Yopal (2026)
Exploring the top neighborhoods for short-term rentals in Yopal? This section highlights key areas, outlining why they are attractive for hosts and guests, along with notable local attractions. Consider these locations based on your target guest profile and investment strategy.
| Neighborhood / Area | Why Host Here? (Target Guests & Appeal) | Key Attractions & Landmarks |
|---|---|---|
| Centro | The heart of Yopal, ideal for those wanting access to local shops, restaurants, and cultural sites. It attracts both tourists and business travelers due to its central location. | Plaza de Yopal, Cathedral of Yopal, Parque El Resurgimiento, local markets, government buildings |
| Los Andes | A residential neighborhood with green areas and a family-friendly atmosphere. It's perfect for visitors looking for a quieter stay while being close to the city center. | Parque Los Andes, local restaurants, shopping centers, neighborhood parks, cultural events |
| El Centro | Another central area that offers historical sites and the vibrancy of local life, making it perfect for those interested in the culture and history of Yopal. | Iglesia de San Francisco, Parque La Paz, local artisan shops, museums, historical landmarks |
| Maracas | Known for its picturesque views and access to nature. This area is appealing for those who enjoy outdoor activities and a more tranquil setting while still being near the city. | Maracas River, hiking trails, scenic viewpoints, nature parks, wildlife observation |
| Niza | A developing area popular with families and ex-pats, offering a range of amenities and proximity to schools and parks. It's a growing hotspot for longer stays. | local parks, family-friendly restaurants, shopping centers, community events, cultural festivals |
| La Campiña | This neighborhood is known for its spacious accommodations and serene atmosphere, making it a great spot for families or larger groups. | La Campiña park, community markets, family activities, relaxing environment, local eateries |
| Los Cedros | A quiet, residential area that offers locals and visitors a peaceful stay, with easy access to the vibrant life of Yopal. | local cafes, green spaces, community parks, grocery stores, small shops |
| El Jardin | A newer area with modern amenities and an upscale feel. It is becoming popular for those looking for more luxurious accommodation options. | high-end restaurants, shopping centers, modern parks, local art galleries, nightlife options |
Understanding Airbnb License Requirements & STR Laws in Yopal (2026)
Yes, Yopal, Casanare, Colombia enforces high STR regulations. Obtaining a license and ensuring compliance is almost certainly required according to current 2026 STR laws. Always verify the latest short term rental regulations and Airbnb license requirements directly with local government authorities for Yopal to ensure full compliance before hosting.
(Source: AirROI data, 2026, based on 90% licensed listings)
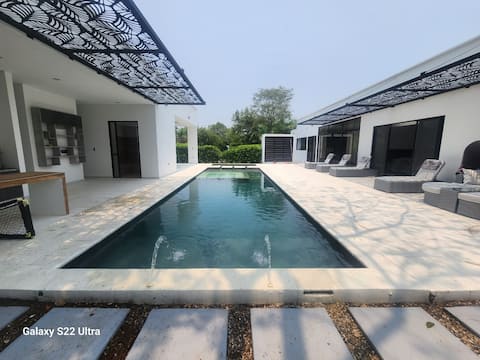
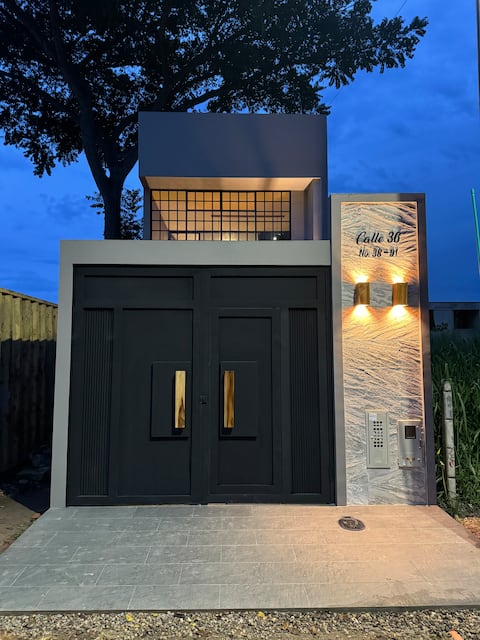
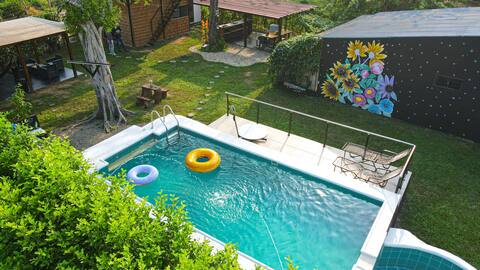
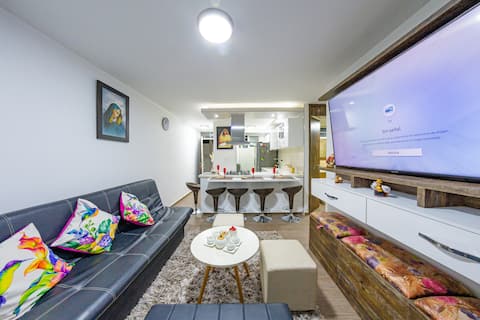
Top Performing Airbnb Properties in Yopal (2026)
Benchmark your potential! Explore examples of top-performing Airbnb properties in Yopalbased on Trailing Twelve Month (TTM) revenue. Analyze their characteristics, revenue, occupancy rate, and ADR to understand what drives success in this market.
Casa Yopal
Entire Place • 3 bedrooms
Comfortable Loft-style apartment Parking and Jacuzzi
Entire Place • 1 bedroom
Casa campestre con chalet, malla catamarán piscina
Entire Place • 4 bedrooms

Comfort Security Nice View
Entire Place • 2 bedrooms
Luxurious and beautiful apartment in Yopal, Casanare
Entire Place • 3 bedrooms

2 Beautiful loft with terrace in the center.
Entire Place • 1 bedroom
Note: Performance varies based on location, size, amenities, seasonality, and management quality. Data reflects the past 12 months.
Top Performing Airbnb Hosts in Yopal (2026)
Learn from the best! This table showcases top-performing Airbnb hosts in Yopal based on the number of properties managed and estimated total revenue over the past year. Analyze their scale and performance metrics.
| Host Name | Properties | Grossing Revenue | Stay Reviews | Avg Rating |
|---|---|---|---|---|
| César | 1 | $21,748 | 4 | 4.75/5.0 |
| Deisy | 3 | $13,487 | 32 | 4.85/5.0 |
| Claudia | 4 | $10,738 | 88 | 4.86/5.0 |
| H Dario | 2 | $9,496 | 236 | 4.88/5.0 |
| Jeffer Alexander | 2 | $8,328 | 364 | 4.97/5.0 |
| Jhoe | 2 | $6,791 | 42 | 4.80/5.0 |
| Host #150777271 | 1 | $6,760 | 0 | Not Rated |
| Gustavo | 2 | $6,710 | 41 | 4.87/5.0 |
| Jhonathan Erasmo | 1 | $5,435 | 22 | 4.95/5.0 |
| Johana Andrea | 1 | $5,355 | 41 | 4.85/5.0 |
Analyzing the strategies of top hosts, such as their property selection, pricing, and guest communication, can offer valuable lessons for optimizing your own Airbnb operations in Yopal.
Dive Deeper: Advanced Yopal STR Market Data (2026)
Ready to unlock more insights? AirROI provides access to advanced metrics and comprehensive Airbnb data for Yopal. Explore detailed analytics beyond this report to refine your investment strategy, optimize pricing, and maximize your vacation rental profits.
Explore Advanced MetricsYopal Short-Term Rental Market Composition (2026): Property & Room Types
Room Type Distribution
Property Type Distribution
Market Composition Insights for Yopal
- The Yopal Airbnb market composition is heavily skewed towards Entire Home/Apt listings, which make up 88.6% of the 79 active rentals. This indicates strong guest preference for privacy and space.
- Looking at the property type distribution in Yopal, Apartment/Condo properties are the most common (53.2%), reflecting the local real estate landscape.
- Houses represent a significant 32.9% portion, catering likely to families or larger groups.
- Smaller segments like unique stays, hotel/boutique (combined 6.3%) offer potential for unique stay experiences.
Yopal Airbnb Room Capacity Analysis (2026): Bedroom Distribution
Distribution of Listings by Number of Bedrooms
Room Capacity Insights for Yopal
- The dominant room capacity in Yopal is 2 bedrooms listings, making up 29.1% of the market. This suggests a strong demand for properties suitable for couples or solo travelers.
- Together, 2 bedrooms and 1 bedroom properties represent 55.7% of the active Airbnb listings in Yopal, indicating a high concentration in these sizes.
- A significant 36.7% of listings offer 3+ bedrooms, catering to larger groups and families seeking more space in Yopal.
Yopal Vacation Rental Guest Capacity Trends (2026)
Distribution of Listings by Guest Capacity
Guest Capacity Insights for Yopal
- The most common guest capacity trend in Yopal vacation rentals is listings accommodating 8+ guests (25.3%). This suggests the primary traveler segment is likely larger groups.
- Properties designed for 8+ guests and 2 guests dominate the Yopal STR market, accounting for 44.3% of listings.
- 39.2% of properties accommodate 6+ guests, serving the market segment for larger families or group travel in Yopal.
- On average, properties in Yopal are equipped to host 4.6 guests.
Yopal Airbnb Booking Patterns (2026): Available vs. Booked Days
Available Days Distribution
Booked Days Distribution
Booking Pattern Insights for Yopal
- The most common availability pattern in Yopal falls within the 271-366 days range, representing 79.7% of listings. This suggests many properties have significant open periods on their calendars.
- Approximately 97.4% of listings show high availability (181+ days open annually), indicating potential for increased bookings or specific owner usage patterns.
- For booked days, the 1-30 days range is most frequent in Yopal (44.3%), reflecting common guest stay durations or potential owner blocking patterns.
- A notable 2.5% of properties secure long booking periods (181+ days booked per year), highlighting successful long-term rental strategies or significant owner usage.
Yopal Airbnb Minimum Stay Requirements Analysis
Distribution of Listings by Minimum Night Requirement
1 Night
48 listings
60.8% of total
2 Nights
14 listings
17.7% of total
3 Nights
2 listings
2.5% of total
7-29 Nights
1 listings
1.3% of total
30+ Nights
14 listings
17.7% of total
Key Insights
- The most prevalent minimum stay requirement in Yopal is 1 Night, adopted by 60.8% of listings. This highlights the market's preference for shorter, flexible bookings.
- A strong majority (78.5%) of the Yopal Airbnb data shows acceptance of very short stays (1-2 nights), indicating a dynamic, high-turnover market.
- A significant segment (17.7%) caters to monthly stays (30+ nights) in Yopal, pointing to opportunities in the extended-stay market.
Recommendations
- Align with the market by considering a 1 Night minimum stay, as 60.8% of Yopal hosts use this setting.
- Explore offering discounts for stays of 30+ nights to attract the 17.7% of the market seeking extended stays.
- Adjust minimum nights based on seasonality – potentially shorter during low season and longer during peak demand periods in Yopal.
Yopal Airbnb Cancellation Policy Trends Analysis (2026)
Limited
1 listings
1.3% of total
Flexible
40 listings
51.3% of total
Moderate
24 listings
30.8% of total
Firm
12 listings
15.4% of total
Strict
1 listings
1.3% of total
Cancellation Policy Insights for Yopal
- The prevailing Airbnb cancellation policy trend in Yopal is Flexible, used by 51.3% of listings.
- The market strongly favors guest-friendly terms, with 82.1% of listings offering Flexible or Moderate policies. This suggests guests in Yopal may expect booking flexibility.
- Strict cancellation policies are quite rare (1.3%), potentially making listings with this policy less competitive unless justified by high demand or property type.
Recommendations for Hosts
- Consider adopting a Flexible policy to align with the 51.3% market standard in Yopal.
- Given the high prevalence of Flexible policies (51.3%), offering this can enhance booking appeal, especially during shoulder seasons.
- Using a Strict policy might deter some guests, as only 1.3% of listings use it. Evaluate if potential revenue protection outweighs possible lower booking rates.
- Regularly review your cancellation policy against competitors and market demand shifts in Yopal.
Yopal STR Booking Lead Time Analysis (2026)
Average Booking Lead Time by Month
Booking Lead Time Insights for Yopal
- The overall average booking lead time for vacation rentals in Yopal is 13 days.
- Guests book furthest in advance for stays during August (average 19 days), likely coinciding with peak travel demand or local events.
- The shortest booking windows occur for stays in February (average 4 days), indicating more last-minute travel plans during this time.
- Seasonally, Summer (12 days avg.) sees the longest lead times, while Spring (9 days avg.) has the shortest, reflecting typical travel planning cycles.
Recommendations for Hosts
- Use the overall average lead time (13 days) as a baseline for your pricing and availability strategy in Yopal.
- During February, focus on last-minute booking availability and promotions, as guests book with very short notice (4 days avg.).
- Target marketing efforts for the Summer season well in advance (at least 12 days) to capture early planners.
- Monitor your own booking lead times against these Yopal averages to identify opportunities for dynamic pricing adjustments.
Popular & Essential Airbnb Amenities in Yopal (2026)
Amenity Prevalence
Amenity Insights for Yopal
- Popular amenities like TV, Kitchen, Wifi are common but not universal. Offering these can provide a competitive edge.
- Warning: Wifi is not universally provided but is considered essential globally. Ensure reliable Wifi is offered.
Recommendations for Hosts
- Consider adding popular differentiators like TV or Kitchen to increase appeal.
- Highlight unique or less common amenities you offer (e.g., hot tub, dedicated workspace, EV charger) in your listing description and photos.
- Regularly check competitor amenities in Yopal to stay competitive.
Yopal Airbnb Guest Demographics & Profile Analysis (2026)
Guest Profile Summary for Yopal
- The typical guest profile for Airbnb in Yopal consists of primarily domestic travelers (85%), often arriving from nearby Bogotá, typically belonging to the Post-2000s (Gen Z/Alpha) group (50%), primarily speaking Spanish or English.
- Domestic travelers account for 84.6% of guests.
- Key international markets include Colombia (84.6%) and United States (4.8%).
- Top languages spoken are Spanish (59.9%) followed by English (26.7%).
- A significant demographic segment is the Post-2000s (Gen Z/Alpha) group, representing 50% of guests.
Recommendations for Hosts
- Target domestic marketing efforts towards travelers from Bogotá and Bogota.
- Tailor amenities and listing descriptions to appeal to the dominant Post-2000s (Gen Z/Alpha) demographic (e.g., highlight fast WiFi, smart home features, local guides).
- Highlight unique local experiences or amenities relevant to the primary guest profile.
- Consider seasonal promotions aligned with peak travel times for key origin markets.
Nearby Short-Term Rental Market Comparison
How does the Yopal Airbnb market stack up against its neighbors? Compare key performance metrics like average monthly revenue, ADR, and occupancy rates in surrounding areas to understand the broader regional STR landscape.
| Market | Active Properties | Monthly Revenue | Daily Rate | Avg. Occupancy |
|---|---|---|---|---|
| Chocontá | 57 | $610 | $164.52 | 15% |
| Guasca | 66 | $599 | $104.33 | 21% |
| Vereda El Espinal | 19 | $571 | $91.60 | 26% |
| El Roble | 11 | $561 | $160.50 | 21% |
| Villa de Leyva | 1,037 | $544 | $109.41 | 22% |
| Sopó | 27 | $513 | $90.03 | 25% |
| Cumaral | 39 | $513 | $129.79 | 18% |
| Los Santos | 70 | $504 | $152.85 | 16% |
| Restrepo | 108 | $481 | $162.35 | 18% |
| Piedecuesta | 98 | $450 | $104.53 | 25% |