Choachí Airbnb Market Analysis 2026: Short Term Rental Data & Vacation Rental Statistics in Cundinamarca, Colombia
Is Airbnb profitable in Choachí in 2026? Explore comprehensive Airbnb analytics for Choachí, Cundinamarca, Colombia to uncover income potential. This 2026 STR market report for Choachí, based on AirROI data from February 2025 to January 2026, reveals key trends in the niche market of 33 active listings.
Whether you're considering an Airbnb investment in Choachí, optimizing your existing vacation rental, or exploring rental arbitrage opportunities, understanding the Choachí Airbnb data is crucial. Navigating the high regulation landscape is key to maximizing your short term rental income potential. Let's dive into the specifics.
Key Choachí Airbnb Performance Metrics Overview
Monthly Airbnb Revenue Variations & Income Potential in Choachí (2026)
Understanding the monthly revenue variations for Airbnb listings in Choachí is key to maximizing your short term rental income potential. Seasonality significantly impacts earnings. Our analysis, based on data from the past 12 months, shows that the peak revenue month for STRs in Choachí is typically March, while September often presents the lowest earnings, highlighting opportunities for strategic pricing adjustments during shoulder and low seasons. Explore the typical Airbnb income in Choachí across different performance tiers:
- Best-in-class properties (Top 10%) achieve $1,408+ monthly, often utilizing dynamic pricing and superior guest experiences.
- Strong performing properties (Top 25%) earn $628 or more, indicating effective management and desirable locations/amenities.
- Typical properties (Median) generate around $275 per month, representing the average market performance.
- Entry-level properties (Bottom 25%) see earnings around $114, often with potential for optimization.
Average Monthly Airbnb Earnings Trend in Choachí
Choachí Airbnb Occupancy Rate Trends (2026)
Maximize your bookings by understanding the Choachí STR occupancy trends. Seasonal demand shifts significantly influence how often properties are booked. Typically, Junesees the highest demand (peak season occupancy), while May experiences the lowest (low season). Effective strategies, like adjusting minimum stays or offering promotions, can boost occupancy during slower periods. Here's how different property tiers perform in Choachí:
- Best-in-class properties (Top 10%) achieve 40%+ occupancy, indicating high desirability and potentially optimized availability.
- Strong performing properties (Top 25%) maintain 25% or higher occupancy, suggesting good market fit and guest satisfaction.
- Typical properties (Median) have an occupancy rate around 15%.
- Entry-level properties (Bottom 25%) average 7% occupancy, potentially facing higher vacancy.
Average Monthly Occupancy Rate Trend in Choachí
Average Daily Rate (ADR) Airbnb Trends in Choachí (2026)
Effective short term rental pricing strategy in Choachí involves understanding monthly ADR fluctuations. The Average Daily Rate (ADR) for Airbnb in Choachí typically peaks in May and dips lowest during October. Leveraging Airbnb dynamic pricing tools or strategies based on this seasonality can significantly boost revenue. Here's a look at the typical nightly rates achieved:
- Best-in-class properties (Top 10%) command rates of $124+ per night, often due to premium features or locations.
- Strong performing properties (Top 25%) achieve nightly rates of $98 or more.
- Typical properties (Median) charge around $61 per night.
- Entry-level properties (Bottom 25%) earn around $38 per night.
Average Daily Rate (ADR) Trend by Month in Choachí
Get Live Choachí Market Intelligence 👇

Explore Real-time Analytics
Airbnb Seasonality Analysis & Trends in Choachí (2026)
Peak Season (March, June, August)
- Revenue averages $664 per month
- Occupancy rates average 20.2%
- Daily rates average $76
Shoulder Season
- Revenue averages $530 per month
- Occupancy maintains around 19.9%
- Daily rates hold near $73
Low Season (May, September, October)
- Revenue drops to average $428 per month
- Occupancy decreases to average 15.0%
- Daily rates adjust to average $73
Seasonality Insights for Choachí
- The Airbnb seasonality in Choachí shows moderate seasonality with distinct peak and low periods. While the sections above show seasonal averages, it's also insightful to look at the extremes:
- During the high season, the absolute peak month showcases Choachí's highest earning potential, with monthly revenues capable of climbing to $692, occupancy reaching a high of 22.9%, and ADRs peaking at $79.
- Conversely, the slowest single month of the year, typically falling within the low season, marks the market's lowest point. In this month, revenue might dip to $411, occupancy could drop to 14.4%, and ADRs may adjust down to $69.
- Understanding both the seasonal averages and these monthly peaks and troughs in revenue, occupancy, and ADR is crucial for maximizing your Airbnb profit potential in Choachí.
Seasonal Strategies for Maximizing Profit
- Peak Season: Maximize revenue through premium pricing and potentially longer minimum stays. Ensure high availability.
- Low Season: Offer competitive pricing, special promotions (e.g., extended stay discounts), and flexible cancellation policies. Target off-season travelers like remote workers or budget-conscious guests.
- Shoulder Seasons: Implement dynamic pricing that balances peak and low rates. Target weekend travelers or specific events. Offer slightly more flexible terms than peak season.
- Regularly analyze your own performance against these Choachí seasonality benchmarks and adjust your pricing and availability strategy accordingly.
Best Areas for Airbnb Investment in Choachí (2026)
Exploring the top neighborhoods for short-term rentals in Choachí? This section highlights key areas, outlining why they are attractive for hosts and guests, along with notable local attractions. Consider these locations based on your target guest profile and investment strategy.
| Neighborhood / Area | Why Host Here? (Target Guests & Appeal) | Key Attractions & Landmarks |
|---|---|---|
| Choachí Centro | The central area of Choachí is known for its local charm and proximity to essential services. It's convenient for travelers who want to explore the local culture and cuisine. | Main Plaza, Local Handicraft Shops, Choachí Church, Cafés and Restaurants |
| La Candelaria | A picturesque neighborhood known for its colonial architecture and beautiful landscapes. Popular with tourists wanting to experience the natural beauty and tranquility of the area. | La Candelaria Park, Waterfalls, Hiking Trails, Scenic Views |
| Vereda San Juanito | A rural area ideal for eco-tourism and nature enthusiasts, providing an immersive experience in the Colombian countryside. | Nature Reserves, Birdwatching, Organic Farms, Rural Tourism Activities |
| Vereda La Esperanza | Known for its stunning views of the surrounding mountains and lush greenery, perfect for those seeking relaxation and outdoor activities. | Hiking Paths, Mountain Biking Trails, Countryside Views, Local Agriculture Tours |
| Pueblo Viejo | A charming village with a friendly atmosphere, attracting visitors interested in the cultural heritage of the region. | Traditional Festivals, Local Markets, Cultural Tours, Artisan Workshops |
| Montserrate | Famous for its panoramic views of Bogotá, Montserrate attracts hikers and adventure-seekers. | Monastery, Cable Car, Hiking Trails, Photography Spots |
| El Trompito | A natural area known for recreation and outdoor sports, appealing to both locals and visitors. | Adventure Sports, Picnic Areas, Natural Pools, Fishing Spots |
| Chicaque Park | A nature reserve that offers a variety of activities including hiking and birdwatching, ideal for nature lovers. | Nature Trails, Birdwatching, Family Picnics, Camping |
Understanding Airbnb License Requirements & STR Laws in Choachí (2026)
Yes, Choachí, Cundinamarca, Colombia enforces high STR regulations. Obtaining a license and ensuring compliance is almost certainly required according to current 2026 STR laws. Always verify the latest short term rental regulations and Airbnb license requirements directly with local government authorities for Choachí to ensure full compliance before hosting.
(Source: AirROI data, 2026, based on 94% licensed listings)
Top Performing Airbnb Properties in Choachí (2026)
Benchmark your potential! Explore examples of top-performing Airbnb properties in Choachíbased on Trailing Twelve Month (TTM) revenue. Analyze their characteristics, revenue, occupancy rate, and ADR to understand what drives success in this market.

Entrenubes-Full country house for 10 people
Entire Place • 3 bedrooms
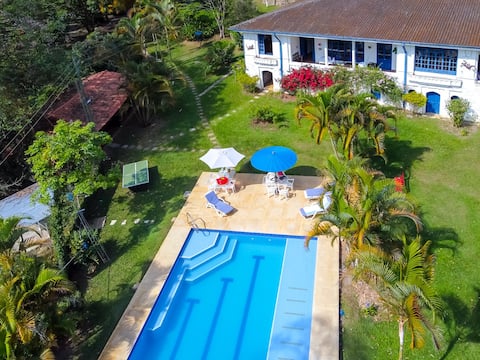
Finca Alcalá, a paradise near Bogotá!
Entire Place • 10 bedrooms
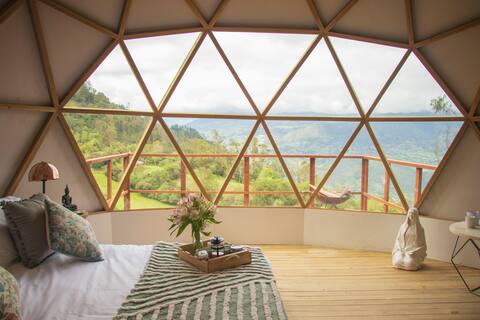
Cúspidê Choachí - Dome Suite
Entire Place • 1 bedroom
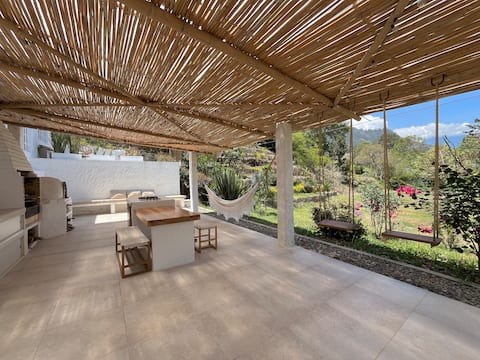
Beautiful country house surrounded by nature
Entire Place • 3 bedrooms

Ecocabanas B&B Luxury cabin with Jacuzzi DIFA
Entire Place • 2 bedrooms

Beautiful country house in a nature reserve
Entire Place • 2 bedrooms
Note: Performance varies based on location, size, amenities, seasonality, and management quality. Data reflects the past 12 months.
Top Performing Airbnb Hosts in Choachí (2026)
Learn from the best! This table showcases top-performing Airbnb hosts in Choachí based on the number of properties managed and estimated total revenue over the past year. Analyze their scale and performance metrics.
| Host Name | Properties | Grossing Revenue | Stay Reviews | Avg Rating |
|---|---|---|---|---|
| Johana | 1 | $27,513 | 30 | 4.83/5.0 |
| Maria Eugenia | 1 | $22,171 | 18 | 4.94/5.0 |
| Jorge | 1 | $17,022 | 6 | 4.67/5.0 |
| Jorge | 4 | $10,542 | 323 | 4.95/5.0 |
| Daniela Sofia | 1 | $8,759 | 21 | 5.00/5.0 |
| Piedad | 3 | $7,640 | 73 | 4.71/5.0 |
| Diana Y Fabio | 1 | $7,527 | 30 | 4.83/5.0 |
| Catalina | 1 | $7,123 | 34 | 4.88/5.0 |
| Nicolás | 2 | $6,195 | 103 | 4.92/5.0 |
| Steven | 1 | $5,827 | 40 | 4.85/5.0 |
Analyzing the strategies of top hosts, such as their property selection, pricing, and guest communication, can offer valuable lessons for optimizing your own Airbnb operations in Choachí.
Dive Deeper: Advanced Choachí STR Market Data (2026)
Ready to unlock more insights? AirROI provides access to advanced metrics and comprehensive Airbnb data for Choachí. Explore detailed analytics beyond this report to refine your investment strategy, optimize pricing, and maximize your vacation rental profits.
Explore Advanced MetricsChoachí Short-Term Rental Market Composition (2026): Property & Room Types
Room Type Distribution
Property Type Distribution
Market Composition Insights for Choachí
- The Choachí Airbnb market composition is heavily skewed towards Entire Home/Apt listings, which make up 75.8% of the 33 active rentals. This indicates strong guest preference for privacy and space.
- Looking at the property type distribution in Choachí, House properties are the most common (33.3%), reflecting the local real estate landscape.
- Houses represent a significant 33.3% portion, catering likely to families or larger groups.
- The presence of 24.2% Hotel/Boutique listings indicates integration with traditional hospitality.
- Smaller segments like others (combined 3.0%) offer potential for unique stay experiences.
Choachí Airbnb Room Capacity Analysis (2026): Bedroom Distribution
Distribution of Listings by Number of Bedrooms
Room Capacity Insights for Choachí
- The dominant room capacity in Choachí is 1 bedroom listings, making up 36.4% of the market. This suggests a strong demand for properties suitable for couples or solo travelers.
- Together, 1 bedroom and 3 bedrooms properties represent 54.6% of the active Airbnb listings in Choachí, indicating a high concentration in these sizes.
- A significant 27.3% of listings offer 3+ bedrooms, catering to larger groups and families seeking more space in Choachí.
Choachí Vacation Rental Guest Capacity Trends (2026)
Distribution of Listings by Guest Capacity
Guest Capacity Insights for Choachí
- The most common guest capacity trend in Choachí vacation rentals is listings accommodating 4 guests (24.2%). This suggests the primary traveler segment is likely small families or groups.
- Properties designed for 4 guests and 8+ guests dominate the Choachí STR market, accounting for 45.4% of listings.
- 30.3% of properties accommodate 6+ guests, serving the market segment for larger families or group travel in Choachí.
- On average, properties in Choachí are equipped to host 4.2 guests.
Choachí Airbnb Booking Patterns (2026): Available vs. Booked Days
Available Days Distribution
Booked Days Distribution
Booking Pattern Insights for Choachí
- The most common availability pattern in Choachí falls within the 271-366 days range, representing 87.9% of listings. This suggests many properties have significant open periods on their calendars.
- Approximately 97.0% of listings show high availability (181+ days open annually), indicating potential for increased bookings or specific owner usage patterns.
- For booked days, the 31-90 days range is most frequent in Choachí (48.5%), reflecting common guest stay durations or potential owner blocking patterns.
- A notable 3.0% of properties secure long booking periods (181+ days booked per year), highlighting successful long-term rental strategies or significant owner usage.
Choachí Airbnb Minimum Stay Requirements Analysis
Distribution of Listings by Minimum Night Requirement
1 Night
26 listings
78.8% of total
2 Nights
4 listings
12.1% of total
30+ Nights
3 listings
9.1% of total
Key Insights
- The most prevalent minimum stay requirement in Choachí is 1 Night, adopted by 78.8% of listings. This highlights the market's preference for shorter, flexible bookings.
- A strong majority (90.9%) of the Choachí Airbnb data shows acceptance of very short stays (1-2 nights), indicating a dynamic, high-turnover market.
Recommendations
- Align with the market by considering a 1 Night minimum stay, as 78.8% of Choachí hosts use this setting.
- Explore offering discounts for stays of 30+ nights to attract the 9.1% of the market seeking extended stays.
- Adjust minimum nights based on seasonality – potentially shorter during low season and longer during peak demand periods in Choachí.
Choachí Airbnb Cancellation Policy Trends Analysis (2026)
Limited
3 listings
9.1% of total
Flexible
13 listings
39.4% of total
Moderate
12 listings
36.4% of total
Firm
5 listings
15.2% of total
Cancellation Policy Insights for Choachí
- The prevailing Airbnb cancellation policy trend in Choachí is Flexible, used by 39.4% of listings.
- The market strongly favors guest-friendly terms, with 75.8% of listings offering Flexible or Moderate policies. This suggests guests in Choachí may expect booking flexibility.
Recommendations for Hosts
- Consider adopting a Flexible policy to align with the 39.4% market standard in Choachí.
- Regularly review your cancellation policy against competitors and market demand shifts in Choachí.
Choachí STR Booking Lead Time Analysis (2026)
Average Booking Lead Time by Month
Booking Lead Time Insights for Choachí
- The overall average booking lead time for vacation rentals in Choachí is 17 days.
- Guests book furthest in advance for stays during January (average 24 days), likely coinciding with peak travel demand or local events.
- The shortest booking windows occur for stays in February (average 9 days), indicating more last-minute travel plans during this time.
- Seasonally, Fall (20 days avg.) sees the longest lead times, while Spring (14 days avg.) has the shortest, reflecting typical travel planning cycles.
Recommendations for Hosts
- Use the overall average lead time (17 days) as a baseline for your pricing and availability strategy in Choachí.
- During February, focus on last-minute booking availability and promotions, as guests book with very short notice (9 days avg.).
- Target marketing efforts for the Fall season well in advance (at least 20 days) to capture early planners.
- Monitor your own booking lead times against these Choachí averages to identify opportunities for dynamic pricing adjustments.
Popular & Essential Airbnb Amenities in Choachí (2026)
Amenity Prevalence
Amenity Insights for Choachí
- Essential amenities in Choachí that guests expect include: Free parking on premises. Lacking these (this) could significantly impact bookings.
- Popular amenities like Pets allowed, Wifi, First aid kit are common but not universal. Offering these can provide a competitive edge.
- Warning: Wifi is not universally provided but is considered essential globally. Ensure reliable Wifi is offered.
Recommendations for Hosts
- Ensure your listing includes all essential amenities for Choachí: Free parking on premises.
- Prioritize adding missing essentials: Free parking on premises.
- Consider adding popular differentiators like Pets allowed or Wifi to increase appeal.
- Highlight unique or less common amenities you offer (e.g., hot tub, dedicated workspace, EV charger) in your listing description and photos.
- Regularly check competitor amenities in Choachí to stay competitive.
Choachí Airbnb Guest Demographics & Profile Analysis (2026)
Guest Profile Summary for Choachí
- The typical guest profile for Airbnb in Choachí consists of primarily domestic travelers (69%), often arriving from nearby Bogotá, typically belonging to the Post-2000s (Gen Z/Alpha) group (50%), primarily speaking Spanish or English.
- Domestic travelers account for 69.2% of guests.
- Key international markets include Colombia (69.2%) and United States (15%).
- Top languages spoken are Spanish (45%) followed by English (39.6%).
- A significant demographic segment is the Post-2000s (Gen Z/Alpha) group, representing 50% of guests.
Recommendations for Hosts
- Target domestic marketing efforts towards travelers from Bogotá and Bogota.
- Tailor amenities and listing descriptions to appeal to the dominant Post-2000s (Gen Z/Alpha) demographic (e.g., highlight fast WiFi, smart home features, local guides).
- Highlight unique local experiences or amenities relevant to the primary guest profile.
- Consider seasonal promotions aligned with peak travel times for key origin markets.
Nearby Short-Term Rental Market Comparison
How does the Choachí Airbnb market stack up against its neighbors? Compare key performance metrics like average monthly revenue, ADR, and occupancy rates in surrounding areas to understand the broader regional STR landscape.
| Market | Active Properties | Monthly Revenue | Daily Rate | Avg. Occupancy |
|---|---|---|---|---|
| Anapoima | 286 | $1,775 | $279.24 | 26% |
| Apulo | 105 | $1,505 | $270.37 | 22% |
| Cundinamarca | 11 | $1,424 | $201.05 | 23% |
| Nilo | 73 | $1,138 | $246.56 | 21% |
| Quebradanegra | 22 | $977 | $189.40 | 16% |
| El Imperio | 14 | $900 | $193.43 | 19% |
| Villeta | 325 | $860 | $181.51 | 20% |
| Nimaima | 34 | $843 | $195.06 | 19% |
| Sasaima | 42 | $810 | $132.40 | 22% |
| Vergara | 11 | $773 | $106.11 | 25% |