Cogua Airbnb Market Analysis 2025: Short Term Rental Data & Vacation Rental Statistics in Cundinamarca, Colombia
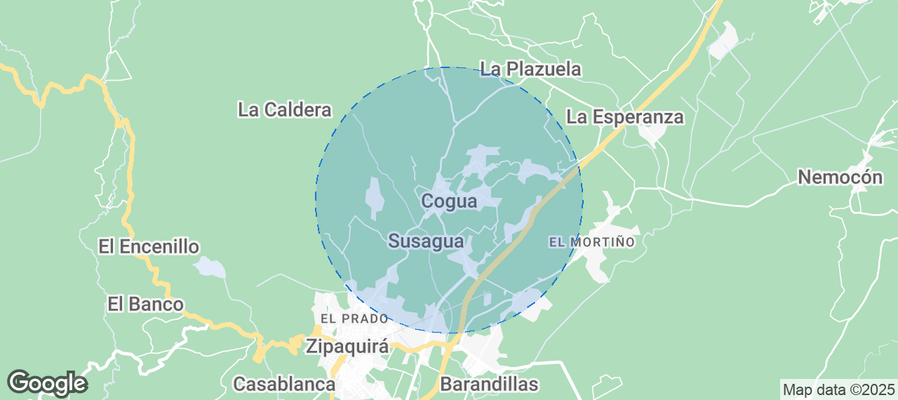
Is Airbnb profitable in Cogua in 2025? Explore comprehensive Airbnb analytics for Cogua, Cundinamarca, Colombia to uncover income potential. This 2025 STR market report for Cogua, based on AirROI data from October 2024 to September 2025, reveals key trends in the niche market of 18 active listings.
Whether you're considering an Airbnb investment in Cogua, optimizing your existing vacation rental, or exploring rental arbitrage opportunities, understanding the Cogua Airbnb data is crucial. Navigating the high regulation landscape is key to maximizing your short term rental income potential. Let's dive into the specifics.
Key Cogua Airbnb Performance Metrics Overview
Monthly Airbnb Revenue Variations & Income Potential in Cogua (2025)
Understanding the monthly revenue variations for Airbnb listings in Cogua is key to maximizing your short term rental income potential. Seasonality significantly impacts earnings. Our analysis, based on data from the past 12 months, shows that the peak revenue month for STRs in Cogua is typically April, while October often presents the lowest earnings, highlighting opportunities for strategic pricing adjustments during shoulder and low seasons. Explore the typical Airbnb income in Cogua across different performance tiers:
- Best-in-class properties (Top 10%) achieve $941+ monthly, often utilizing dynamic pricing and superior guest experiences.
- Strong performing properties (Top 25%) earn $469 or more, indicating effective management and desirable locations/amenities.
- Typical properties (Median) generate around $248 per month, representing the average market performance.
- Entry-level properties (Bottom 25%) see earnings around $141, often with potential for optimization.
Average Monthly Airbnb Earnings Trend in Cogua
Cogua Airbnb Occupancy Rate Trends (2025)
Maximize your bookings by understanding the Cogua STR occupancy trends. Seasonal demand shifts significantly influence how often properties are booked. Typically, Aprilsees the highest demand (peak season occupancy), while October experiences the lowest (low season). Effective strategies, like adjusting minimum stays or offering promotions, can boost occupancy during slower periods. Here's how different property tiers perform in Cogua:
- Best-in-class properties (Top 10%) achieve 47%+ occupancy, indicating high desirability and potentially optimized availability.
- Strong performing properties (Top 25%) maintain 27% or higher occupancy, suggesting good market fit and guest satisfaction.
- Typical properties (Median) have an occupancy rate around 16%.
- Entry-level properties (Bottom 25%) average 8% occupancy, potentially facing higher vacancy.
Average Monthly Occupancy Rate Trend in Cogua
Average Daily Rate (ADR) Airbnb Trends in Cogua (2025)
Effective short term rental pricing strategy in Cogua involves understanding monthly ADR fluctuations. The Average Daily Rate (ADR) for Airbnb in Cogua typically peaks in April and dips lowest during July. Leveraging Airbnb dynamic pricing tools or strategies based on this seasonality can significantly boost revenue. Here's a look at the typical nightly rates achieved:
- Best-in-class properties (Top 10%) command rates of $118+ per night, often due to premium features or locations.
- Strong performing properties (Top 25%) achieve nightly rates of $80 or more.
- Typical properties (Median) charge around $63 per night.
- Entry-level properties (Bottom 25%) earn around $46 per night.
Average Daily Rate (ADR) Trend by Month in Cogua
Get Live Cogua Market Intelligence 👇
Explore Real-time Analytics
Airbnb Seasonality Analysis & Trends in Cogua (2025)
Peak Season (April, May, December)
- Revenue averages $536 per month
- Occupancy rates average 27.3%
- Daily rates average $69
Shoulder Season
- Revenue averages $391 per month
- Occupancy maintains around 21.7%
- Daily rates hold near $67
Low Season (September, October, November)
- Revenue drops to average $234 per month
- Occupancy decreases to average 14.4%
- Daily rates adjust to average $69
Seasonality Insights for Cogua
- The Airbnb seasonality in Cogua shows highly seasonal trends requiring careful strategy. While the sections above show seasonal averages, it's also insightful to look at the extremes:
- During the high season, the absolute peak month showcases Cogua's highest earning potential, with monthly revenues capable of climbing to $569, occupancy reaching a high of 32.1%, and ADRs peaking at $70.
- Conversely, the slowest single month of the year, typically falling within the low season, marks the market's lowest point. In this month, revenue might dip to $164, occupancy could drop to 11.4%, and ADRs may adjust down to $65.
- Understanding both the seasonal averages and these monthly peaks and troughs in revenue, occupancy, and ADR is crucial for maximizing your Airbnb profit potential in Cogua.
Seasonal Strategies for Maximizing Profit
- Peak Season: Maximize revenue through premium pricing and potentially longer minimum stays. Ensure high availability.
- Low Season: Offer competitive pricing, special promotions (e.g., extended stay discounts), and flexible cancellation policies. Target off-season travelers like remote workers or budget-conscious guests.
- Shoulder Seasons: Implement dynamic pricing that balances peak and low rates. Target weekend travelers or specific events. Offer slightly more flexible terms than peak season.
- Regularly analyze your own performance against these Cogua seasonality benchmarks and adjust your pricing and availability strategy accordingly.
Best Areas for Airbnb Investment in Cogua (2025)
Exploring the top neighborhoods for short-term rentals in Cogua? This section highlights key areas, outlining why they are attractive for hosts and guests, along with notable local attractions. Consider these locations based on your target guest profile and investment strategy.
| Neighborhood / Area | Why Host Here? (Target Guests & Appeal) | Key Attractions & Landmarks |
|---|---|---|
| Centrala de Cogua | This area is known for its accessibility and convenience, making it a popular choice for tourists and locals alike. It has a mix of commercial and residential spaces, ideal for hosting guests. | Plaza de Mercado, Parroquia San Juan Bautista, Pueblo de Cogua, Cerro de las Tres Viejas, Parque Principal |
| Vereda La Palma | A serene and natural setting, perfect for guests looking to escape the hustle and bustle. This area offers beautiful views and a tranquil atmosphere, ideal for weekends and retreats. | Sendero ecológico, Mirador La Palma, Cascada del Indio, Finca El Encanto, Parque Natural Chicaque |
| Vereda La Cabaña | Known for its rural charm and proximity to nature, this area attracts visitors seeking a peaceful getaway. Popular among families and nature lovers. | Reserva Natural La Cabaña, Café la Palma, Cultivo de flores, Ruta ecológica, Mirador de La Cabaña |
| Pueblo de Cogua | The historical center of Cogua, featuring local culture and community spirit. A great place for tourists to experience the authentic Colombian lifestyle. | Iglesia San Juan Bautista, Plaza Principal, Caminos de la Historia, Cultura Local, Mercado Artesanal |
| Sector El Chorro | A picturesque area known for its natural beauty and outdoor activities. It's great for adventure tourism and guests looking for exploration. | Cascada El Chorro, Rutas de senderismo, Mirador El Chorro, Parque Ecológico, Zona de picnic |
| Vereda La Estancia | A tranquil and scenic location favored by those looking for a countryside escape. Great for romantic getaways or family gatherings. | Área de camping, Parque natural, Sendero ecológico, Río Cogua, Cabalgatas |
| Vereda San Rafael | Famous for its coffee plantations and scenic routes. Ideal for tourists interested in the coffee culture of Colombia. | Finca Cafetera, Recorridos cafetaleros, Cultura del café, Paisaje cultural, Café de altura |
| Embalse del Neusa | This artificial lake area is popular for water sports and picnics. A weekend hotspot for tourists and locals seeking leisure activities. | Deportes acuáticos, Senderos alrededor del embalse, Pesca deportiva, Áreas de descanso, Mirador del embalse |
Understanding Airbnb License Requirements & STR Laws in Cogua (2025)
Yes, Cogua, Cundinamarca, Colombia enforces high STR regulations. Obtaining a license and ensuring compliance is almost certainly required according to current 2025 STR laws. Always verify the latest short term rental regulations and Airbnb license requirements directly with local government authorities for Cogua to ensure full compliance before hosting.
(Source: AirROI data, 2025, based on 72% licensed listings)
Top Performing Airbnb Properties in Cogua (2025)
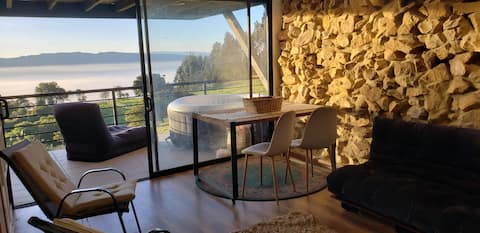
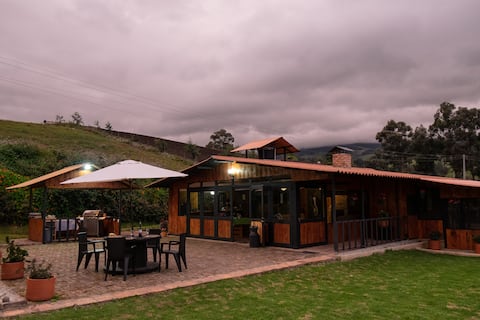
Benchmark your potential! Explore examples of top-performing Airbnb properties in Coguabased on Trailing Twelve Month (TTM) revenue. Analyze their characteristics, revenue, occupancy rate, and ADR to understand what drives success in this market.
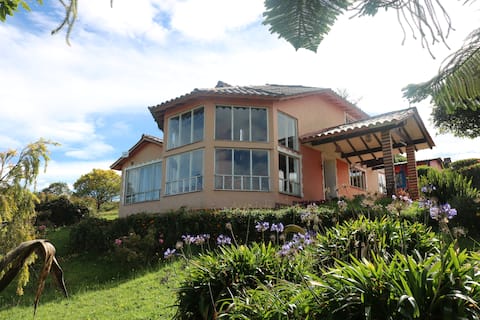
Beautiful cabin with mountain views RNT.118410
Entire Place • 3 bedrooms
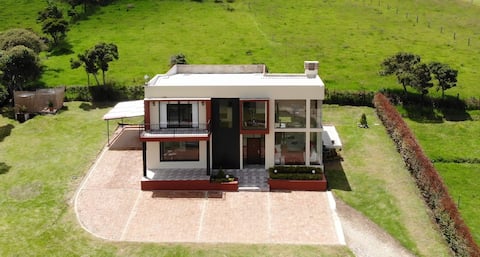
A place to rest, surrounded by beautiful landscapes
Entire Place • 3 bedrooms
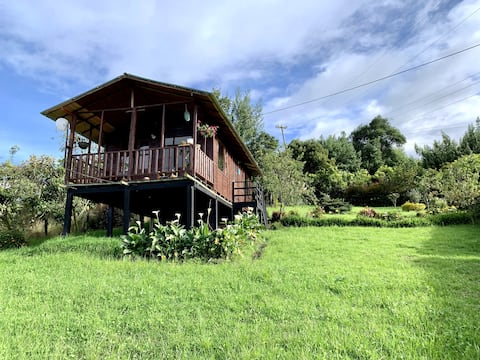
Beautiful little cabin near Neusa
Entire Place • 1 bedroom
A hideaway in the woods: apartasuite
Entire Place • 1 bedroom

Glamping at Campo Hermoso Farm
Entire Place • 1 bedroom
Beautiful cabin ideal for relaxing "Pa que mas"
Entire Place • 2 bedrooms
Note: Performance varies based on location, size, amenities, seasonality, and management quality. Data reflects the past 12 months.
Top Performing Airbnb Hosts in Cogua (2025)
Learn from the best! This table showcases top-performing Airbnb hosts in Cogua based on the number of properties managed and estimated total revenue over the past year. Analyze their scale and performance metrics.
| Host Name | Properties | Grossing Revenue | Stay Reviews | Avg Rating |
|---|---|---|---|---|
| Alexandra | 1 | $13,900 | 46 | 4.93/5.0 |
| Jorge | 4 | $5,603 | 134 | 4.84/5.0 |
| Iván | 1 | $5,016 | 50 | 4.76/5.0 |
| Diego | 1 | $4,815 | 36 | 4.89/5.0 |
| Carlos Alberto | 1 | $3,713 | 14 | 4.36/5.0 |
| Gonzalo | 1 | $2,812 | 64 | 4.95/5.0 |
| Laura Melissa | 1 | $2,683 | 29 | 4.97/5.0 |
| Myriam | 2 | $2,410 | 52 | 4.82/5.0 |
| Martha | 1 | $2,228 | 36 | 5.00/5.0 |
| Vivi | 1 | $2,208 | 44 | 5.00/5.0 |
Analyzing the strategies of top hosts, such as their property selection, pricing, and guest communication, can offer valuable lessons for optimizing your own Airbnb operations in Cogua.
Dive Deeper: Advanced Cogua STR Market Data (2025)
Ready to unlock more insights? AirROI provides access to advanced metrics and comprehensive Airbnb data for Cogua. Explore detailed analytics beyond this report to refine your investment strategy, optimize pricing, and maximize your vacation rental profits.
Explore Advanced MetricsCogua Short-Term Rental Market Composition (2025): Property & Room Types
Room Type Distribution
Property Type Distribution
Market Composition Insights for Cogua
- The Cogua Airbnb market composition is heavily skewed towards Entire Home/Apt listings, which make up 88.9% of the 18 active rentals. This indicates strong guest preference for privacy and space.
- Looking at the property type distribution in Cogua, Outdoor/Unique properties are the most common (55.6%), reflecting the local real estate landscape.
- Houses represent a significant 27.8% portion, catering likely to families or larger groups.
- The presence of 11.1% Hotel/Boutique listings indicates integration with traditional hospitality.
Cogua Airbnb Room Capacity Analysis (2025): Bedroom Distribution
Distribution of Listings by Number of Bedrooms
Room Capacity Insights for Cogua
- The dominant room capacity in Cogua is 1 bedroom listings, making up 66.7% of the market. This suggests a strong demand for properties suitable for couples or solo travelers.
- Together, 1 bedroom and 2 bedrooms properties represent 83.4% of the active Airbnb listings in Cogua, indicating a high concentration in these sizes.
- With over half the market (66.7%) consisting of studios or 1-bedroom units, Cogua is particularly well-suited for individuals or couples.
Cogua Vacation Rental Guest Capacity Trends (2025)
Distribution of Listings by Guest Capacity
Guest Capacity Insights for Cogua
- The most common guest capacity trend in Cogua vacation rentals is listings accommodating 2 guests (38.9%). This suggests the primary traveler segment is likely couples or solo travelers.
- Properties designed for 2 guests and 3 guests dominate the Cogua STR market, accounting for 61.1% of listings.
- 16.8% of properties accommodate 6+ guests, serving the market segment for larger families or group travel in Cogua.
- On average, properties in Cogua are equipped to host 3.3 guests.
Cogua Airbnb Booking Patterns (2025): Available vs. Booked Days
Available Days Distribution
Booked Days Distribution
Booking Pattern Insights for Cogua
- The most common availability pattern in Cogua falls within the 271-366 days range, representing 88.9% of listings. This suggests many properties have significant open periods on their calendars.
- Approximately 100.0% of listings show high availability (181+ days open annually), indicating potential for increased bookings or specific owner usage patterns.
- For booked days, the 31-90 days range is most frequent in Cogua (55.6%), reflecting common guest stay durations or potential owner blocking patterns.
Cogua Airbnb Minimum Stay Requirements Analysis
Distribution of Listings by Minimum Night Requirement
1 Night
17 listings
94.4% of total
2 Nights
1 listings
5.6% of total
Key Insights
- The most prevalent minimum stay requirement in Cogua is 1 Night, adopted by 94.4% of listings. This highlights the market's preference for shorter, flexible bookings.
- A strong majority (100.0%) of the Cogua Airbnb data shows acceptance of very short stays (1-2 nights), indicating a dynamic, high-turnover market.
Recommendations
- Align with the market by considering a 1 Night minimum stay, as 94.4% of Cogua hosts use this setting.
- Adjust minimum nights based on seasonality – potentially shorter during low season and longer during peak demand periods in Cogua.
Cogua Airbnb Cancellation Policy Trends Analysis (2025)
Flexible
7 listings
41.2% of total
Moderate
9 listings
52.9% of total
Firm
1 listings
5.9% of total
Cancellation Policy Insights for Cogua
- The prevailing Airbnb cancellation policy trend in Cogua is Moderate, used by 52.9% of listings.
- The market strongly favors guest-friendly terms, with 94.1% of listings offering Flexible or Moderate policies. This suggests guests in Cogua may expect booking flexibility.
Recommendations for Hosts
- Consider adopting a Moderate policy to align with the 52.9% market standard in Cogua.
- Regularly review your cancellation policy against competitors and market demand shifts in Cogua.
Cogua STR Booking Lead Time Analysis (2025)
Average Booking Lead Time by Month
Booking Lead Time Insights for Cogua
- The overall average booking lead time for vacation rentals in Cogua is 10 days.
- Guests book furthest in advance for stays during December (average 30 days), likely coinciding with peak travel demand or local events.
- The shortest booking windows occur for stays in November (average 3 days), indicating more last-minute travel plans during this time.
- Seasonally, Winter (16 days avg.) sees the longest lead times, while Fall (5 days avg.) has the shortest, reflecting typical travel planning cycles.
Recommendations for Hosts
- Use the overall average lead time (10 days) as a baseline for your pricing and availability strategy in Cogua.
- For December stays, consider implementing length-of-stay discounts or slightly higher rates for bookings made less than 30 days out to capitalize on advance planning.
- Target marketing efforts for the Winter season well in advance (at least 16 days) to capture early planners.
- Monitor your own booking lead times against these Cogua averages to identify opportunities for dynamic pricing adjustments.
Popular & Essential Airbnb Amenities in Cogua (2025)
Amenity Prevalence
Amenity Insights for Cogua
- Essential amenities in Cogua that guests expect include: Free parking on premises. Lacking these (this) could significantly impact bookings.
- Popular amenities like Wifi, Cooking basics, Essentials are common but not universal. Offering these can provide a competitive edge.
- Warning: Wifi is not universally provided but is considered essential globally. Ensure reliable Wifi is offered.
Recommendations for Hosts
- Ensure your listing includes all essential amenities for Cogua: Free parking on premises.
- Consider adding popular differentiators like Wifi or Cooking basics to increase appeal.
- Highlight unique or less common amenities you offer (e.g., hot tub, dedicated workspace, EV charger) in your listing description and photos.
- Regularly check competitor amenities in Cogua to stay competitive.
Cogua Airbnb Guest Demographics & Profile Analysis (2025)
Guest Profile Summary for Cogua
- The typical guest profile for Airbnb in Cogua consists of primarily domestic travelers (95%), often arriving from nearby Bogotá, typically belonging to the Post-2000s (Gen Z/Alpha) group (50%), primarily speaking Spanish or English.
- Domestic travelers account for 94.6% of guests.
- Key international markets include Colombia (94.6%) and United States (1.1%).
- Top languages spoken are Spanish (54%) followed by English (32%).
- A significant demographic segment is the Post-2000s (Gen Z/Alpha) group, representing 50% of guests.
Recommendations for Hosts
- Target domestic marketing efforts towards travelers from Bogotá and Bogota.
- Tailor amenities and listing descriptions to appeal to the dominant Post-2000s (Gen Z/Alpha) demographic (e.g., highlight fast WiFi, smart home features, local guides).
- Highlight unique local experiences or amenities relevant to the primary guest profile.
- Consider seasonal promotions aligned with peak travel times for key origin markets.
Nearby Short-Term Rental Market Comparison
How does the Cogua Airbnb market stack up against its neighbors? Compare key performance metrics like average monthly revenue, ADR, and occupancy rates in surrounding areas to understand the broader regional STR landscape.
| Market | Active Properties | Monthly Revenue | Daily Rate | Avg. Occupancy |
|---|---|---|---|---|
| Apulo | 97 | $1,709 | $276.95 | 24% |
| Anapoima | 300 | $1,686 | $269.04 | 26% |
| Cundinamarca | 11 | $1,421 | $193.39 | 25% |
| El Imperio | 13 | $1,027 | $185.28 | 22% |
| Nilo | 75 | $1,009 | $229.45 | 22% |
| Nimaima | 30 | $973 | $186.75 | 21% |
| Carmen Apicala | 10 | $925 | $184.92 | 21% |
| Quebradanegra | 20 | $889 | $204.89 | 18% |
| Villeta | 334 | $867 | $179.58 | 21% |
| Sasaima | 41 | $807 | $137.68 | 23% |