Cota Airbnb Market Analysis 2026: Short Term Rental Data & Vacation Rental Statistics in Cundinamarca, Colombia
Is Airbnb profitable in Cota in 2026? Explore comprehensive Airbnb analytics for Cota, Cundinamarca, Colombia to uncover income potential. This 2026 STR market report for Cota, based on AirROI data from February 2025 to January 2026, reveals key trends in the niche market of 46 active listings.
Whether you're considering an Airbnb investment in Cota, optimizing your existing vacation rental, or exploring rental arbitrage opportunities, understanding the Cota Airbnb data is crucial. Navigating the high regulation landscape is key to maximizing your short term rental income potential. Let's dive into the specifics.
Key Cota Airbnb Performance Metrics Overview
Monthly Airbnb Revenue Variations & Income Potential in Cota (2026)
Understanding the monthly revenue variations for Airbnb listings in Cota is key to maximizing your short term rental income potential. Seasonality significantly impacts earnings. Our analysis, based on data from the past 12 months, shows that the peak revenue month for STRs in Cota is typically December, while January often presents the lowest earnings, highlighting opportunities for strategic pricing adjustments during shoulder and low seasons. Explore the typical Airbnb income in Cota across different performance tiers:
- Best-in-class properties (Top 10%) achieve $1,401+ monthly, often utilizing dynamic pricing and superior guest experiences.
- Strong performing properties (Top 25%) earn $627 or more, indicating effective management and desirable locations/amenities.
- Typical properties (Median) generate around $296 per month, representing the average market performance.
- Entry-level properties (Bottom 25%) see earnings around $156, often with potential for optimization.
Average Monthly Airbnb Earnings Trend in Cota
Cota Airbnb Occupancy Rate Trends (2026)
Maximize your bookings by understanding the Cota STR occupancy trends. Seasonal demand shifts significantly influence how often properties are booked. Typically, Marchsees the highest demand (peak season occupancy), while September experiences the lowest (low season). Effective strategies, like adjusting minimum stays or offering promotions, can boost occupancy during slower periods. Here's how different property tiers perform in Cota:
- Best-in-class properties (Top 10%) achieve 59%+ occupancy, indicating high desirability and potentially optimized availability.
- Strong performing properties (Top 25%) maintain 35% or higher occupancy, suggesting good market fit and guest satisfaction.
- Typical properties (Median) have an occupancy rate around 18%.
- Entry-level properties (Bottom 25%) average 10% occupancy, potentially facing higher vacancy.
Average Monthly Occupancy Rate Trend in Cota
Average Daily Rate (ADR) Airbnb Trends in Cota (2026)
Effective short term rental pricing strategy in Cota involves understanding monthly ADR fluctuations. The Average Daily Rate (ADR) for Airbnb in Cota typically peaks in December and dips lowest during February. Leveraging Airbnb dynamic pricing tools or strategies based on this seasonality can significantly boost revenue. Here's a look at the typical nightly rates achieved:
- Best-in-class properties (Top 10%) command rates of $118+ per night, often due to premium features or locations.
- Strong performing properties (Top 25%) achieve nightly rates of $59 or more.
- Typical properties (Median) charge around $40 per night.
- Entry-level properties (Bottom 25%) earn around $27 per night.
Average Daily Rate (ADR) Trend by Month in Cota
Get Live Cota Market Intelligence 👇

Explore Real-time Analytics
Airbnb Seasonality Analysis & Trends in Cota (2026)
Peak Season (December, August, March)
- Revenue averages $828 per month
- Occupancy rates average 29.3%
- Daily rates average $63
Shoulder Season
- Revenue averages $557 per month
- Occupancy maintains around 23.1%
- Daily rates hold near $62
Low Season (January, February, October)
- Revenue drops to average $427 per month
- Occupancy decreases to average 25.4%
- Daily rates adjust to average $64
Seasonality Insights for Cota
- The Airbnb seasonality in Cota shows highly seasonal trends requiring careful strategy. While the sections above show seasonal averages, it's also insightful to look at the extremes:
- During the high season, the absolute peak month showcases Cota's highest earning potential, with monthly revenues capable of climbing to $1,106, occupancy reaching a high of 36.8%, and ADRs peaking at $69.
- Conversely, the slowest single month of the year, typically falling within the low season, marks the market's lowest point. In this month, revenue might dip to $401, occupancy could drop to 17.8%, and ADRs may adjust down to $57.
- Understanding both the seasonal averages and these monthly peaks and troughs in revenue, occupancy, and ADR is crucial for maximizing your Airbnb profit potential in Cota.
Seasonal Strategies for Maximizing Profit
- Peak Season: Maximize revenue through premium pricing and potentially longer minimum stays. Ensure high availability.
- Low Season: Offer competitive pricing, special promotions (e.g., extended stay discounts), and flexible cancellation policies. Target off-season travelers like remote workers or budget-conscious guests.
- Shoulder Seasons: Implement dynamic pricing that balances peak and low rates. Target weekend travelers or specific events. Offer slightly more flexible terms than peak season.
- Regularly analyze your own performance against these Cota seasonality benchmarks and adjust your pricing and availability strategy accordingly.
Best Areas for Airbnb Investment in Cota (2026)
Exploring the top neighborhoods for short-term rentals in Cota? This section highlights key areas, outlining why they are attractive for hosts and guests, along with notable local attractions. Consider these locations based on your target guest profile and investment strategy.
| Neighborhood / Area | Why Host Here? (Target Guests & Appeal) | Key Attractions & Landmarks |
|---|---|---|
| Cota Centro | The main town area with local markets, restaurants, and historical sites. Great for visitors looking to experience the traditional lifestyle of Cota and its vibrant community atmosphere. | Plaza de Cota, Church of San Juan Bautista, Local markets, Restaurants and cafes |
| Parque Natural Chicaque | A beautiful natural park offering stunning hiking trails and nature experiences. Attracts nature lovers and adventure seekers looking for eco-tourism. | Hiking trails, Bird watching, Scenic viewpoints, Eco-tourism activities |
| Embassy of France in Colombia | This historical area offers a unique blend of culture and history, appealing to visitors interested in the diplomatic and cultural offerings. | Historical buildings, Cultural events, Art galleries |
| Las Flores | A tranquil neighborhood with scenic gardens and parks, ideal for families and tourists seeking relaxation and nature. | Parque Las Flores, Community gardens, Local bakeries |
| La Calera | Nearby scenic location known for its panoramic views of the surrounding mountains and quick access to hiking routes, suitable for nature enthusiasts. | Hiking trails, Mirador de La Calera, Nature retreats |
| Nariño | A residential area known for its local charm and quiet streets, appealing to travelers looking for a more local experience away from the tourist hustle. | Local shops, Quiet parks, Cafes |
| Vereda San Pedro | An up-and-coming area with modern developments and proximity to Cota's natural attractions, ideal for future investors and hospitality ventures. | Nature trails, Rural tourism, Local farms |
| Cota's Cultural Heritage sites | Cota boasts several historical sites and cultural landmarks that attract tourists interested in Colombian history and architecture. | Museo de Cota, Cultural festivals, Artisan markets |
Understanding Airbnb License Requirements & STR Laws in Cota (2026)
Yes, Cota, Cundinamarca, Colombia enforces high STR regulations. Obtaining a license and ensuring compliance is almost certainly required according to current 2026 STR laws. Always verify the latest short term rental regulations and Airbnb license requirements directly with local government authorities for Cota to ensure full compliance before hosting.
(Source: AirROI data, 2026, based on 96% licensed listings)
Top Performing Airbnb Properties in Cota (2026)
Benchmark your potential! Explore examples of top-performing Airbnb properties in Cotabased on Trailing Twelve Month (TTM) revenue. Analyze their characteristics, revenue, occupancy rate, and ADR to understand what drives success in this market.
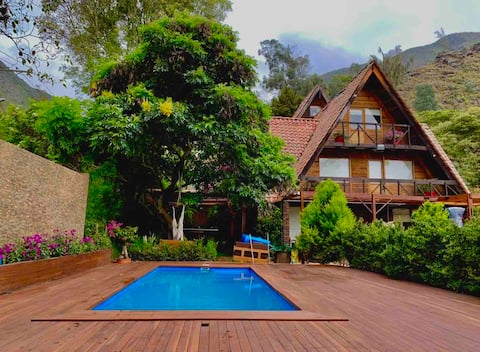
Spectacular villa just 20 minutes from Bogota
Entire Place • 4 bedrooms

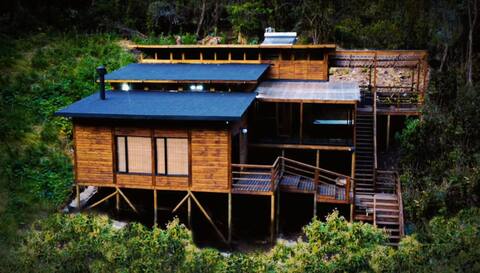
Luxury country house in Cota
Entire Place • 6 bedrooms
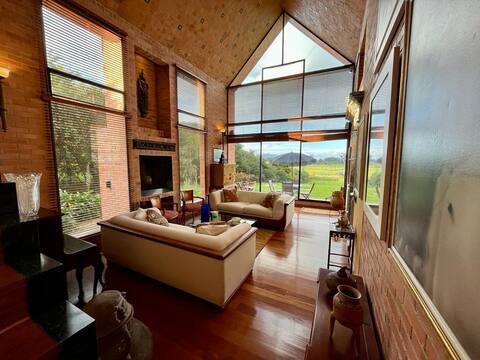
Chalet el Majuy
Entire Place • 3 bedrooms
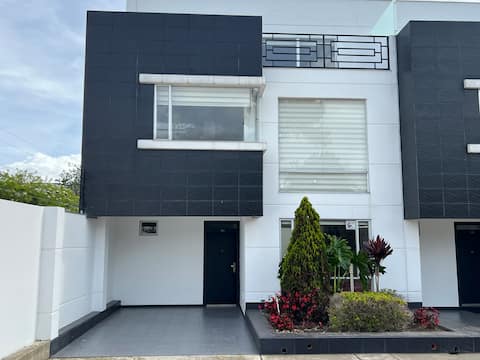
The Abbey - Casa de Campo
Entire Place • 3 bedrooms
El Retiro: Country House - Int 3
Entire Place • 3 bedrooms
"El Darién" Villa
Entire Place • 4 bedrooms
Note: Performance varies based on location, size, amenities, seasonality, and management quality. Data reflects the past 12 months.
Top Performing Airbnb Hosts in Cota (2026)
Learn from the best! This table showcases top-performing Airbnb hosts in Cota based on the number of properties managed and estimated total revenue over the past year. Analyze their scale and performance metrics.
| Host Name | Properties | Grossing Revenue | Stay Reviews | Avg Rating |
|---|---|---|---|---|
| Ikigai | 1 | $30,341 | 22 | 4.77/5.0 |
| Andres | 1 | $23,417 | 28 | 5.00/5.0 |
| Andrea | 3 | $18,706 | 223 | 4.81/5.0 |
| Bruno Fonseca | 1 | $17,171 | 65 | 5.00/5.0 |
| Andres Mauricio | 1 | $14,756 | 7 | 5.00/5.0 |
| Omaira | 7 | $12,603 | 13 | 4.67/5.0 |
| Miguel | 4 | $7,182 | 24 | 4.88/5.0 |
| Host #261165443 | 5 | $7,141 | 2 | Not Rated |
| William Humberto | 1 | $6,306 | 55 | 4.87/5.0 |
| Jose | 1 | $3,710 | 70 | 4.96/5.0 |
Analyzing the strategies of top hosts, such as their property selection, pricing, and guest communication, can offer valuable lessons for optimizing your own Airbnb operations in Cota.
Dive Deeper: Advanced Cota STR Market Data (2026)
Ready to unlock more insights? AirROI provides access to advanced metrics and comprehensive Airbnb data for Cota. Explore detailed analytics beyond this report to refine your investment strategy, optimize pricing, and maximize your vacation rental profits.
Explore Advanced MetricsCota Short-Term Rental Market Composition (2026): Property & Room Types
Room Type Distribution
Property Type Distribution
Market Composition Insights for Cota
- The Cota Airbnb market composition is heavily skewed towards Entire Home/Apt listings, which make up 80.4% of the 46 active rentals. This indicates strong guest preference for privacy and space.
- Looking at the property type distribution in Cota, Apartment/Condo properties are the most common (58.7%), reflecting the local real estate landscape.
- Houses represent a significant 34.8% portion, catering likely to families or larger groups.
- Smaller segments like outdoor/unique, hotel/boutique (combined 6.5%) offer potential for unique stay experiences.
Cota Airbnb Room Capacity Analysis (2026): Bedroom Distribution
Distribution of Listings by Number of Bedrooms
Room Capacity Insights for Cota
- The dominant room capacity in Cota is 1 bedroom listings, making up 43.5% of the market. This suggests a strong demand for properties suitable for couples or solo travelers.
- Together, 1 bedroom and 3 bedrooms properties represent 58.7% of the active Airbnb listings in Cota, indicating a high concentration in these sizes.
- A significant 28.2% of listings offer 3+ bedrooms, catering to larger groups and families seeking more space in Cota.
Cota Vacation Rental Guest Capacity Trends (2026)
Distribution of Listings by Guest Capacity
Guest Capacity Insights for Cota
- The most common guest capacity trend in Cota vacation rentals is listings accommodating 2 guests (26.1%). This suggests the primary traveler segment is likely couples or solo travelers.
- Properties designed for 2 guests and 4 guests dominate the Cota STR market, accounting for 50.0% of listings.
- 26.1% of properties accommodate 6+ guests, serving the market segment for larger families or group travel in Cota.
- On average, properties in Cota are equipped to host 3.8 guests.
Cota Airbnb Booking Patterns (2026): Available vs. Booked Days
Available Days Distribution
Booked Days Distribution
Booking Pattern Insights for Cota
- The most common availability pattern in Cota falls within the 271-366 days range, representing 82.6% of listings. This suggests many properties have significant open periods on their calendars.
- Approximately 97.8% of listings show high availability (181+ days open annually), indicating potential for increased bookings or specific owner usage patterns.
- For booked days, the 1-30 days range is most frequent in Cota (47.8%), reflecting common guest stay durations or potential owner blocking patterns.
- A notable 2.2% of properties secure long booking periods (181+ days booked per year), highlighting successful long-term rental strategies or significant owner usage.
Cota Airbnb Minimum Stay Requirements Analysis
Distribution of Listings by Minimum Night Requirement
1 Night
24 listings
52.2% of total
2 Nights
15 listings
32.6% of total
3 Nights
1 listings
2.2% of total
4-6 Nights
4 listings
8.7% of total
30+ Nights
2 listings
4.3% of total
Key Insights
- The most prevalent minimum stay requirement in Cota is 1 Night, adopted by 52.2% of listings. This highlights the market's preference for shorter, flexible bookings.
- A strong majority (84.8%) of the Cota Airbnb data shows acceptance of very short stays (1-2 nights), indicating a dynamic, high-turnover market.
Recommendations
- Align with the market by considering a 1 Night minimum stay, as 52.2% of Cota hosts use this setting.
- Adjust minimum nights based on seasonality – potentially shorter during low season and longer during peak demand periods in Cota.
Cota Airbnb Cancellation Policy Trends Analysis (2026)
Limited
3 listings
6.7% of total
Super Strict 60 Days
1 listings
2.2% of total
Flexible
28 listings
62.2% of total
Moderate
4 listings
8.9% of total
Firm
6 listings
13.3% of total
Strict
3 listings
6.7% of total
Cancellation Policy Insights for Cota
- The prevailing Airbnb cancellation policy trend in Cota is Flexible, used by 62.2% of listings.
- The market strongly favors guest-friendly terms, with 71.1% of listings offering Flexible or Moderate policies. This suggests guests in Cota may expect booking flexibility.
- Strict cancellation policies are quite rare (6.7%), potentially making listings with this policy less competitive unless justified by high demand or property type.
Recommendations for Hosts
- Consider adopting a Flexible policy to align with the 62.2% market standard in Cota.
- Given the high prevalence of Flexible policies (62.2%), offering this can enhance booking appeal, especially during shoulder seasons.
- Using a Strict policy might deter some guests, as only 6.7% of listings use it. Evaluate if potential revenue protection outweighs possible lower booking rates.
- Regularly review your cancellation policy against competitors and market demand shifts in Cota.
Cota STR Booking Lead Time Analysis (2026)
Average Booking Lead Time by Month
Booking Lead Time Insights for Cota
- The overall average booking lead time for vacation rentals in Cota is 19 days.
- Guests book furthest in advance for stays during June (average 52 days), likely coinciding with peak travel demand or local events.
- The shortest booking windows occur for stays in March (average 7 days), indicating more last-minute travel plans during this time.
- Seasonally, Summer (35 days avg.) sees the longest lead times, while Spring (15 days avg.) has the shortest, reflecting typical travel planning cycles.
Recommendations for Hosts
- Use the overall average lead time (19 days) as a baseline for your pricing and availability strategy in Cota.
- For June stays, consider implementing length-of-stay discounts or slightly higher rates for bookings made less than 52 days out to capitalize on advance planning.
- During March, focus on last-minute booking availability and promotions, as guests book with very short notice (7 days avg.).
- Target marketing efforts for the Summer season well in advance (at least 35 days) to capture early planners.
- Monitor your own booking lead times against these Cota averages to identify opportunities for dynamic pricing adjustments.
Popular & Essential Airbnb Amenities in Cota (2026)
Amenity Prevalence
Amenity Insights for Cota
- Essential amenities in Cota that guests expect include: Wifi, Kitchen, TV. Lacking these (any) could significantly impact bookings.
- Popular amenities like Dedicated workspace, Hot water, Washer are common but not universal. Offering these can provide a competitive edge.
Recommendations for Hosts
- Ensure your listing includes all essential amenities for Cota: Wifi, Kitchen, TV.
- Prioritize adding missing essentials: Kitchen, TV.
- Consider adding popular differentiators like Dedicated workspace or Hot water to increase appeal.
- Highlight unique or less common amenities you offer (e.g., hot tub, dedicated workspace, EV charger) in your listing description and photos.
- Regularly check competitor amenities in Cota to stay competitive.
Cota Airbnb Guest Demographics & Profile Analysis (2026)
Guest Profile Summary for Cota
- The typical guest profile for Airbnb in Cota consists of primarily domestic travelers (70%), often arriving from nearby Bogotá, typically belonging to the Post-2000s (Gen Z/Alpha) group (50%), primarily speaking Spanish or English.
- Domestic travelers account for 69.8% of guests.
- Key international markets include Colombia (69.8%) and United States (20.8%).
- Top languages spoken are Spanish (51.7%) followed by English (37.1%).
- A significant demographic segment is the Post-2000s (Gen Z/Alpha) group, representing 50% of guests.
Recommendations for Hosts
- Target domestic marketing efforts towards travelers from Bogotá and Bogota.
- Tailor amenities and listing descriptions to appeal to the dominant Post-2000s (Gen Z/Alpha) demographic (e.g., highlight fast WiFi, smart home features, local guides).
- Highlight unique local experiences or amenities relevant to the primary guest profile.
- Consider seasonal promotions aligned with peak travel times for key origin markets.
Nearby Short-Term Rental Market Comparison
How does the Cota Airbnb market stack up against its neighbors? Compare key performance metrics like average monthly revenue, ADR, and occupancy rates in surrounding areas to understand the broader regional STR landscape.
| Market | Active Properties | Monthly Revenue | Daily Rate | Avg. Occupancy |
|---|---|---|---|---|
| Cauca Viejo | 26 | $2,181 | $298.12 | 27% |
| Anapoima | 286 | $1,775 | $279.24 | 26% |
| Apulo | 105 | $1,505 | $270.37 | 22% |
| Cundinamarca | 11 | $1,424 | $201.05 | 23% |
| La Pintada | 20 | $1,381 | $258.80 | 24% |
| Fredonia | 14 | $1,284 | $201.88 | 23% |
| Nilo | 73 | $1,138 | $246.56 | 21% |
| Quebradanegra | 22 | $977 | $189.40 | 16% |
| El Imperio | 14 | $900 | $193.43 | 19% |
| Villeta | 325 | $860 | $181.51 | 20% |