Girardot Airbnb Market Analysis 2026: Short Term Rental Data & Vacation Rental Statistics in Cundinamarca, Colombia
Is Airbnb profitable in Girardot in 2026? Explore comprehensive Airbnb analytics for Girardot, Cundinamarca, Colombia to uncover income potential. This 2026 STR market report for Girardot, based on AirROI data from June 2024 to May 2025, reveals key trends in the niche market of 60 active listings.
Whether you're considering an Airbnb investment in Girardot, optimizing your existing vacation rental, or exploring rental arbitrage opportunities, understanding the Girardot Airbnb data is crucial. Navigating the high regulation landscape is key to maximizing your short term rental income potential. Let's dive into the specifics.
Key Girardot Airbnb Performance Metrics Overview
Monthly Airbnb Revenue Variations & Income Potential in Girardot (2026)
Understanding the monthly revenue variations for Airbnb listings in Girardot is key to maximizing your short term rental income potential. Seasonality significantly impacts earnings. Our analysis, based on data from the past 12 months, shows that the peak revenue month for STRs in Girardot is typically November, while May often presents the lowest earnings, highlighting opportunities for strategic pricing adjustments during shoulder and low seasons. Explore the typical Airbnb income in Girardot across different performance tiers:
- Best-in-class properties (Top 10%) achieve $2,170+ monthly, often utilizing dynamic pricing and superior guest experiences.
- Strong performing properties (Top 25%) earn $648 or more, indicating effective management and desirable locations/amenities.
- Typical properties (Median) generate around $248 per month, representing the average market performance.
- Entry-level properties (Bottom 25%) see earnings around $135, often with potential for optimization.
Average Monthly Airbnb Earnings Trend in Girardot
Girardot Airbnb Occupancy Rate Trends (2026)
Maximize your bookings by understanding the Girardot STR occupancy trends. Seasonal demand shifts significantly influence how often properties are booked. Typically, Septembersees the highest demand (peak season occupancy), while May experiences the lowest (low season). Effective strategies, like adjusting minimum stays or offering promotions, can boost occupancy during slower periods. Here's how different property tiers perform in Girardot:
- Best-in-class properties (Top 10%) achieve 49%+ occupancy, indicating high desirability and potentially optimized availability.
- Strong performing properties (Top 25%) maintain 32% or higher occupancy, suggesting good market fit and guest satisfaction.
- Typical properties (Median) have an occupancy rate around 19%.
- Entry-level properties (Bottom 25%) average 10% occupancy, potentially facing higher vacancy.
Average Monthly Occupancy Rate Trend in Girardot
Average Daily Rate (ADR) Airbnb Trends in Girardot (2026)
Effective short term rental pricing strategy in Girardot involves understanding monthly ADR fluctuations. The Average Daily Rate (ADR) for Airbnb in Girardot typically peaks in December and dips lowest during January. Leveraging Airbnb dynamic pricing tools or strategies based on this seasonality can significantly boost revenue. Here's a look at the typical nightly rates achieved:
- Best-in-class properties (Top 10%) command rates of $315+ per night, often due to premium features or locations.
- Strong performing properties (Top 25%) achieve nightly rates of $127 or more.
- Typical properties (Median) charge around $61 per night.
- Entry-level properties (Bottom 25%) earn around $36 per night.
Average Daily Rate (ADR) Trend by Month in Girardot
Get Live Girardot Market Intelligence 👇

Explore Real-time Analytics
Airbnb Seasonality Analysis & Trends in Girardot (2025)
Peak Season (November, February, October)
- Revenue averages $1,078 per month
- Occupancy rates average 27.9%
- Daily rates average $124
Shoulder Season
- Revenue averages $795 per month
- Occupancy maintains around 23.8%
- Daily rates hold near $122
Low Season (April, May, June)
- Revenue drops to average $502 per month
- Occupancy decreases to average 20.6%
- Daily rates adjust to average $123
Seasonality Insights for Girardot
- The Airbnb seasonality in Girardot shows highly seasonal trends requiring careful strategy. While the sections above show seasonal averages, it's also insightful to look at the extremes:
- During the high season, the absolute peak month showcases Girardot's highest earning potential, with monthly revenues capable of climbing to $1,197, occupancy reaching a high of 32.1%, and ADRs peaking at $132.
- Conversely, the slowest single month of the year, typically falling within the low season, marks the market's lowest point. In this month, revenue might dip to $405, occupancy could drop to 13.5%, and ADRs may adjust down to $102.
- Understanding both the seasonal averages and these monthly peaks and troughs in revenue, occupancy, and ADR is crucial for maximizing your Airbnb profit potential in Girardot.
Seasonal Strategies for Maximizing Profit
- Peak Season: Maximize revenue through premium pricing and potentially longer minimum stays. Ensure high availability.
- Low Season: Offer competitive pricing, special promotions (e.g., extended stay discounts), and flexible cancellation policies. Target off-season travelers like remote workers or budget-conscious guests.
- Shoulder Seasons: Implement dynamic pricing that balances peak and low rates. Target weekend travelers or specific events. Offer slightly more flexible terms than peak season.
- Regularly analyze your own performance against these Girardot seasonality benchmarks and adjust your pricing and availability strategy accordingly.
Best Areas for Airbnb Investment in Girardot (2026)
Exploring the top neighborhoods for short-term rentals in Girardot? This section highlights key areas, outlining why they are attractive for hosts and guests, along with notable local attractions. Consider these locations based on your target guest profile and investment strategy.
| Neighborhood / Area | Why Host Here? (Target Guests & Appeal) | Key Attractions & Landmarks |
|---|---|---|
| La Palma | A serene neighborhood popular for its access to nature and relaxation. Ideal for families and nature enthusiasts looking for a peaceful retreat close to the city. | La Palma Waterfall, Natural park trails, Local coffee farms, Outdoor sports facilities, Cultural events |
| El Peñón | A vibrant area known for its recreational facilities and proximity to the lake. Great for guests seeking outdoor activities and a lively atmosphere. | Aguas Claras Lagoons, Peñón Golf Course, Water sports activities, Restaurants and bars by the lake, Local artisan markets |
| Girardot Centro | The heart of Girardot with easy access to local culture, shops, and restaurants. Perfect for tourists wanting to immerse themselves in the local lifestyle. | Main Plaza, Local boutiques, Cultural festivals, Restaurants serving local cuisine, Historical buildings |
| Carmen de Apicalá | A nearby town known for its thermal springs and wellness retreats. Attracts those looking for relaxation and comfort in a beautiful setting. | Thermal spas, Nature trails, Restaurant options with local cuisine, Wildlife observation, Cultural attractions |
| Côte d'Azur | An upscale residential area with beautiful views and modern amenities. Ideal for guests looking for luxury stays with a peaceful ambiance. | Scenic viewpoints, Private beach access, Fine dining options, Wellness centers, Swimming pools |
| El Tabacal | A natural paradise with eco-friendly accommodations and proximity to recreational areas, catering to eco-tourists and adventure seekers. | Hiking trails, Eco-tourism activities, Nature reserves, Bird watching opportunities, Cultural exchanges with local communities |
| Rincón del Chicamocha | An adventurous spot known for outdoor sports like rafting and paragliding. Attracts thrill-seekers and nature lovers. | Chicamocha Canyon, Adventure sports facilities, Viewpoints, Nature excursions, Local cuisine experiences |
| Melgar | A bustling tourist destination nearby known for its vibrant nightlife and entertainment. Popular among young travelers looking for fun and social experiences. | Water parks, Nightclubs and bars, Shopping areas, Cultural performances, Outdoor adventure parks |
Understanding Airbnb License Requirements & STR Laws in Girardot (2026)
Yes, Girardot, Cundinamarca, Colombia enforces high STR regulations. Obtaining a license and ensuring compliance is almost certainly required according to current 2026 STR laws. Always verify the latest short term rental regulations and Airbnb license requirements directly with local government authorities for Girardot to ensure full compliance before hosting.
(Source: AirROI data, 2026, based on 65% licensed listings)
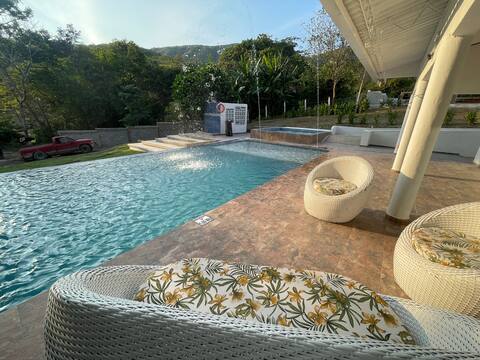
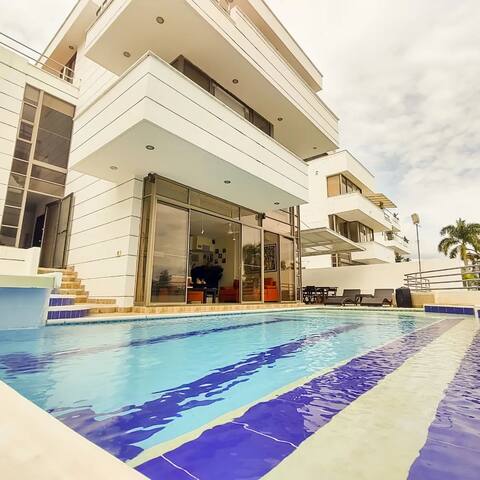
Top Performing Airbnb Properties in Girardot (2026)
Benchmark your potential! Explore examples of top-performing Airbnb properties in Girardotbased on Trailing Twelve Month (TTM) revenue. Analyze their characteristics, revenue, occupancy rate, and ADR to understand what drives success in this market.

Casa Chilacoa
Entire Place • 5 bedrooms

Beautiful House with Swimming Pool, Jacuzzi, BBQ & Employee
Entire Place • 4 bedrooms

Accommodation in Girardot Lagos del Peñol
Entire Place • 5 bedrooms

Beautiful brand new house
Entire Place • 3 bedrooms
San Gabriel farm
Entire Place • 5 bedrooms
🏊♂️🌅Casa en El Peñón "lake view"🌅🏌🏼
Entire Place • 4 bedrooms
Note: Performance varies based on location, size, amenities, seasonality, and management quality. Data reflects the past 12 months.
Top Performing Airbnb Hosts in Girardot (2026)
Learn from the best! This table showcases top-performing Airbnb hosts in Girardot based on the number of properties managed and estimated total revenue over the past year. Analyze their scale and performance metrics.
| Host Name | Properties | Grossing Revenue | Stay Reviews | Avg Rating |
|---|---|---|---|---|
| Laura | 1 | $58,884 | 3 | 5.00/5.0 |
| Edgar | 1 | $45,816 | 78 | 4.94/5.0 |
| Angelica | 1 | $44,876 | 18 | 4.78/5.0 |
| Daniel | 1 | $31,171 | 22 | 4.82/5.0 |
| Pilar | 3 | $20,274 | 144 | 4.81/5.0 |
| Raúl | 1 | $14,177 | 24 | 4.58/5.0 |
| Eduardo | 1 | $8,409 | 8 | 4.00/5.0 |
| Francisco A | 4 | $6,986 | 81 | 4.59/5.0 |
| Juan | 1 | $6,552 | 18 | 4.94/5.0 |
| Carlos | 1 | $6,078 | 41 | 4.88/5.0 |
Analyzing the strategies of top hosts, such as their property selection, pricing, and guest communication, can offer valuable lessons for optimizing your own Airbnb operations in Girardot.
Dive Deeper: Advanced Girardot STR Market Data (2026)
Ready to unlock more insights? AirROI provides access to advanced metrics and comprehensive Airbnb data for Girardot. Explore detailed analytics beyond this report to refine your investment strategy, optimize pricing, and maximize your vacation rental profits.
Explore Advanced MetricsGirardot Short-Term Rental Market Composition (2026): Property & Room Types
Room Type Distribution
Property Type Distribution
Market Composition Insights for Girardot
- The Girardot Airbnb market composition is heavily skewed towards Entire Home/Apt listings, which make up 91.7% of the 60 active rentals. This indicates strong guest preference for privacy and space.
- Looking at the property type distribution in Girardot, Apartment/Condo properties are the most common (48.3%), reflecting the local real estate landscape.
- Houses represent a significant 43.3% portion, catering likely to families or larger groups.
- The presence of 6.7% Hotel/Boutique listings indicates integration with traditional hospitality.
- Smaller segments like others (combined 1.7%) offer potential for unique stay experiences.
Girardot Airbnb Room Capacity Analysis (2026): Bedroom Distribution
Distribution of Listings by Number of Bedrooms
Room Capacity Insights for Girardot
- The dominant room capacity in Girardot is 3 bedrooms listings, making up 45% of the market. This suggests a strong demand for properties suitable for families or small groups.
- Together, 3 bedrooms and 2 bedrooms properties represent 66.7% of the active Airbnb listings in Girardot, indicating a high concentration in these sizes.
- A significant 70.0% of listings offer 3+ bedrooms, catering to larger groups and families seeking more space in Girardot.
Girardot Vacation Rental Guest Capacity Trends (2026)
Distribution of Listings by Guest Capacity
Guest Capacity Insights for Girardot
- The most common guest capacity trend in Girardot vacation rentals is listings accommodating 8+ guests (55%). This suggests the primary traveler segment is likely larger groups.
- Properties designed for 8+ guests and 6 guests dominate the Girardot STR market, accounting for 75.0% of listings.
- 78.3% of properties accommodate 6+ guests, serving the market segment for larger families or group travel in Girardot.
- On average, properties in Girardot are equipped to host 6.7 guests.
Girardot Airbnb Booking Patterns (2026): Available vs. Booked Days
Available Days Distribution
Booked Days Distribution
Booking Pattern Insights for Girardot
- The most common availability pattern in Girardot falls within the 271-366 days range, representing 83.3% of listings. This suggests many properties have significant open periods on their calendars.
- Approximately 96.6% of listings show high availability (181+ days open annually), indicating potential for increased bookings or specific owner usage patterns.
- For booked days, the 1-30 days range is most frequent in Girardot (51.7%), reflecting common guest stay durations or potential owner blocking patterns.
- A notable 3.3% of properties secure long booking periods (181+ days booked per year), highlighting successful long-term rental strategies or significant owner usage.
Girardot Airbnb Minimum Stay Requirements Analysis
Distribution of Listings by Minimum Night Requirement
1 Night
22 listings
37.9% of total
2 Nights
20 listings
34.5% of total
3 Nights
1 listings
1.7% of total
4-6 Nights
1 listings
1.7% of total
30+ Nights
14 listings
24.1% of total
Key Insights
- The most prevalent minimum stay requirement in Girardot is 1 Night, adopted by 37.9% of listings. This highlights the market's preference for shorter, flexible bookings.
- A strong majority (72.4%) of the Girardot Airbnb data shows acceptance of very short stays (1-2 nights), indicating a dynamic, high-turnover market.
- A significant segment (24.1%) caters to monthly stays (30+ nights) in Girardot, pointing to opportunities in the extended-stay market.
Recommendations
- Align with the market by considering a 1 Night minimum stay, as 37.9% of Girardot hosts use this setting.
- Explore offering discounts for stays of 30+ nights to attract the 24.1% of the market seeking extended stays.
- Adjust minimum nights based on seasonality – potentially shorter during low season and longer during peak demand periods in Girardot.
Girardot Airbnb Cancellation Policy Trends Analysis (2026)
Flexible
17 listings
32.1% of total
Moderate
13 listings
24.5% of total
Firm
8 listings
15.1% of total
Strict
15 listings
28.3% of total
Cancellation Policy Insights for Girardot
- The prevailing Airbnb cancellation policy trend in Girardot is Flexible, used by 32.1% of listings.
- There's a relatively balanced mix between guest-friendly (56.6%) and stricter (43.4%) policies, offering choices for different guest needs.
Recommendations for Hosts
- Consider adopting a Flexible policy to align with the 32.1% market standard in Girardot.
- Regularly review your cancellation policy against competitors and market demand shifts in Girardot.
Girardot STR Booking Lead Time Analysis (2026)
Average Booking Lead Time by Month
Booking Lead Time Insights for Girardot
- The overall average booking lead time for vacation rentals in Girardot is 32 days.
- Guests book furthest in advance for stays during December (average 54 days), likely coinciding with peak travel demand or local events.
- The shortest booking windows occur for stays in July (average 6 days), indicating more last-minute travel plans during this time.
- Seasonally, Winter (36 days avg.) sees the longest lead times, while Summer (11 days avg.) has the shortest, reflecting typical travel planning cycles.
Recommendations for Hosts
- Use the overall average lead time (32 days) as a baseline for your pricing and availability strategy in Girardot.
- For December stays, consider implementing length-of-stay discounts or slightly higher rates for bookings made less than 54 days out to capitalize on advance planning.
- During July, focus on last-minute booking availability and promotions, as guests book with very short notice (6 days avg.).
- Target marketing efforts for the Winter season well in advance (at least 36 days) to capture early planners.
- Monitor your own booking lead times against these Girardot averages to identify opportunities for dynamic pricing adjustments.
Popular & Essential Airbnb Amenities in Girardot (2026)
Amenity Prevalence
Amenity Insights for Girardot
- Essential amenities in Girardot that guests expect include: Free parking on premises, Kitchen, TV. Lacking these (any) could significantly impact bookings.
- Popular amenities like Pool, Essentials, Wifi are common but not universal. Offering these can provide a competitive edge.
- A pool is a highly desired but not standard amenity, making it a key feature for attracting guests seeking leisure in Girardot.
- Warning: Wifi is not universally provided but is considered essential globally. Ensure reliable Wifi is offered.
Recommendations for Hosts
- Ensure your listing includes all essential amenities for Girardot: Free parking on premises, Kitchen, TV.
- Prioritize adding missing essentials: Free parking on premises, Kitchen, TV.
- Consider adding popular differentiators like Pool or Essentials to increase appeal.
- Highlight unique or less common amenities you offer (e.g., hot tub, dedicated workspace, EV charger) in your listing description and photos.
- Regularly check competitor amenities in Girardot to stay competitive.
Girardot Airbnb Guest Demographics & Profile Analysis (2026)
Guest Profile Summary for Girardot
- The typical guest profile for Airbnb in Girardot consists of primarily domestic travelers (91%), often arriving from nearby Bogotá, typically belonging to the Post-2000s (Gen Z/Alpha) group (50%), primarily speaking Spanish or English.
- Domestic travelers account for 91.0% of guests.
- Key international markets include Colombia (91%) and United States (2.7%).
- Top languages spoken are Spanish (64.2%) followed by English (28.4%).
- A significant demographic segment is the Post-2000s (Gen Z/Alpha) group, representing 50% of guests.
Recommendations for Hosts
- Target domestic marketing efforts towards travelers from Bogotá and Bogota.
- Tailor amenities and listing descriptions to appeal to the dominant Post-2000s (Gen Z/Alpha) demographic (e.g., highlight fast WiFi, smart home features, local guides).
- Highlight unique local experiences or amenities relevant to the primary guest profile.
- Consider seasonal promotions aligned with peak travel times for key origin markets.
Nearby Short-Term Rental Market Comparison
How does the Girardot Airbnb market stack up against its neighbors? Compare key performance metrics like average monthly revenue, ADR, and occupancy rates in surrounding areas to understand the broader regional STR landscape.
| Market | Active Properties | Monthly Revenue | Daily Rate | Avg. Occupancy |
|---|---|---|---|---|
| Anapoima | 21 | $2,825 | $410.57 | 25% |
| Cauca Viejo | 29 | $1,992 | $289.99 | 27% |
| Apulo | 95 | $1,687 | $273.35 | 24% |
| Anapoima | 289 | $1,435 | $274.56 | 25% |
| La Peña | 11 | $1,248 | $158.21 | 27% |
| Cundinamarca | 13 | $1,060 | $163.02 | 25% |
| El Imperio | 13 | $936 | $189.25 | 21% |
| Carmen Apicala | 11 | $900 | $189.39 | 19% |
| Villeta | 285 | $851 | $180.73 | 21% |
| Sasaima | 33 | $840 | $138.56 | 25% |