Mosquera Airbnb Market Analysis 2026: Short Term Rental Data & Vacation Rental Statistics in Cundinamarca, Colombia
Is Airbnb profitable in Mosquera in 2026? Explore comprehensive Airbnb analytics for Mosquera, Cundinamarca, Colombia to uncover income potential. This 2026 STR market report for Mosquera, based on AirROI data from February 2025 to January 2026, reveals key trends in the niche market of 28 active listings.
Whether you're considering an Airbnb investment in Mosquera, optimizing your existing vacation rental, or exploring rental arbitrage opportunities, understanding the Mosquera Airbnb data is crucial. Navigating the high regulation landscape is key to maximizing your short term rental income potential. Let's dive into the specifics.
Key Mosquera Airbnb Performance Metrics Overview
Monthly Airbnb Revenue Variations & Income Potential in Mosquera (2026)
Understanding the monthly revenue variations for Airbnb listings in Mosquera is key to maximizing your short term rental income potential. Seasonality significantly impacts earnings. Our analysis, based on data from the past 12 months, shows that the peak revenue month for STRs in Mosquera is typically November, while February often presents the lowest earnings, highlighting opportunities for strategic pricing adjustments during shoulder and low seasons. Explore the typical Airbnb income in Mosquera across different performance tiers:
- Best-in-class properties (Top 10%) achieve $849+ monthly, often utilizing dynamic pricing and superior guest experiences.
- Strong performing properties (Top 25%) earn $601 or more, indicating effective management and desirable locations/amenities.
- Typical properties (Median) generate around $353 per month, representing the average market performance.
- Entry-level properties (Bottom 25%) see earnings around $174, often with potential for optimization.
Average Monthly Airbnb Earnings Trend in Mosquera
Mosquera Airbnb Occupancy Rate Trends (2026)
Maximize your bookings by understanding the Mosquera STR occupancy trends. Seasonal demand shifts significantly influence how often properties are booked. Typically, Aprilsees the highest demand (peak season occupancy), while May experiences the lowest (low season). Effective strategies, like adjusting minimum stays or offering promotions, can boost occupancy during slower periods. Here's how different property tiers perform in Mosquera:
- Best-in-class properties (Top 10%) achieve 74%+ occupancy, indicating high desirability and potentially optimized availability.
- Strong performing properties (Top 25%) maintain 57% or higher occupancy, suggesting good market fit and guest satisfaction.
- Typical properties (Median) have an occupancy rate around 34%.
- Entry-level properties (Bottom 25%) average 16% occupancy, potentially facing higher vacancy.
Average Monthly Occupancy Rate Trend in Mosquera
Average Daily Rate (ADR) Airbnb Trends in Mosquera (2026)
Effective short term rental pricing strategy in Mosquera involves understanding monthly ADR fluctuations. The Average Daily Rate (ADR) for Airbnb in Mosquera typically peaks in July and dips lowest during February. Leveraging Airbnb dynamic pricing tools or strategies based on this seasonality can significantly boost revenue. Here's a look at the typical nightly rates achieved:
- Best-in-class properties (Top 10%) command rates of $71+ per night, often due to premium features or locations.
- Strong performing properties (Top 25%) achieve nightly rates of $42 or more.
- Typical properties (Median) charge around $33 per night.
- Entry-level properties (Bottom 25%) earn around $28 per night.
Average Daily Rate (ADR) Trend by Month in Mosquera
Get Live Mosquera Market Intelligence 👇

Explore Real-time Analytics
Airbnb Seasonality Analysis & Trends in Mosquera (2026)
Peak Season (November, July, September)
- Revenue averages $512 per month
- Occupancy rates average 40.5%
- Daily rates average $50
Shoulder Season
- Revenue averages $434 per month
- Occupancy maintains around 38.8%
- Daily rates hold near $48
Low Season (January, February, May)
- Revenue drops to average $331 per month
- Occupancy decreases to average 33.0%
- Daily rates adjust to average $46
Seasonality Insights for Mosquera
- The Airbnb seasonality in Mosquera shows moderate seasonality with distinct peak and low periods. While the sections above show seasonal averages, it's also insightful to look at the extremes:
- During the high season, the absolute peak month showcases Mosquera's highest earning potential, with monthly revenues capable of climbing to $524, occupancy reaching a high of 45.0%, and ADRs peaking at $52.
- Conversely, the slowest single month of the year, typically falling within the low season, marks the market's lowest point. In this month, revenue might dip to $299, occupancy could drop to 31.5%, and ADRs may adjust down to $44.
- Understanding both the seasonal averages and these monthly peaks and troughs in revenue, occupancy, and ADR is crucial for maximizing your Airbnb profit potential in Mosquera.
Seasonal Strategies for Maximizing Profit
- Peak Season: Maximize revenue through premium pricing and potentially longer minimum stays. Ensure high availability.
- Low Season: Offer competitive pricing, special promotions (e.g., extended stay discounts), and flexible cancellation policies. Target off-season travelers like remote workers or budget-conscious guests.
- Shoulder Seasons: Implement dynamic pricing that balances peak and low rates. Target weekend travelers or specific events. Offer slightly more flexible terms than peak season.
- Regularly analyze your own performance against these Mosquera seasonality benchmarks and adjust your pricing and availability strategy accordingly.
Best Areas for Airbnb Investment in Mosquera (2026)
Exploring the top neighborhoods for short-term rentals in Mosquera? This section highlights key areas, outlining why they are attractive for hosts and guests, along with notable local attractions. Consider these locations based on your target guest profile and investment strategy.
| Neighborhood / Area | Why Host Here? (Target Guests & Appeal) | Key Attractions & Landmarks |
|---|---|---|
| Centro Histórico | The historical center of Mosquera is rich in culture and architecture, attracting visitors interested in exploring its heritage and local life. It offers a vibrant atmosphere with local markets and traditional restaurants. | Plaza de Mosquera, Iglesia de San Agustín, Museo de Mosquera, Parque Principal, Café Rancho, Mercado de Mosquera |
| La Estancia | A residential area that is increasingly popular among tourists looking for a more localized experience away from the hustle and bustle. Its calm ambiance makes it ideal for families and longer stays. | Parque La Estancia, Club Campestre Mosquera, Cafés locales, Panadería La Estancia, Cerro de La Estancia |
| Mosquera Norte | Known for its modern developments and convenience, this area attracts business travelers and families alike, with quick access to major roads and amenities. | Centro Comercial El Progreso, Universidad de Mosquera, Talleres de Cocina, Cafés y restaurantes diversos |
| El Paraíso | An urban yet peaceful neighborhood, El Paraíso offers visitors a blend of nature and modern living, making it ideal for those who want to escape the city while still being nearby. | Parque El Paraíso, Sendero ecológico, Cafés y heladerías, Hermosa vista al atardecer |
| Samaná | A charming area near Mosquera that boasts a relaxed pace and is popular with both locals and expatriates. It features beautiful green spaces and community markets. | Parque Samaná, Mercado campesino, Cafés al aire libre, Caminatas por la naturaleza |
| Los Olivos | An emerging neighborhood favorable for investments due to its growing demand. It blends comfort with accessibility to urban amenities, ideal for short-term rentals. | Plaza de mercado Los Olivos, Restaurantes populares, Cine y entretenimiento, Zonas recreativas |
| Sector La Perla | A strategic location known for its unique housing styles and affordability, making it a favorite among budget travelers and local visitors. | Caminos rurales, Parque recreativo, Eventos comunitarios, Tiendas locales |
| Carrefour Mosquera | A shopping and entertainment hub that attracts many visitors for its variety of eating options and retail shops, making it an ideal location for short stays. | Centro Comercial Carrefour, Cineplex, Plaza de comidas, Juegos para niños |
Understanding Airbnb License Requirements & STR Laws in Mosquera (2026)
Yes, Mosquera, Cundinamarca, Colombia enforces high STR regulations. Obtaining a license and ensuring compliance is almost certainly required according to current 2026 STR laws. Always verify the latest short term rental regulations and Airbnb license requirements directly with local government authorities for Mosquera to ensure full compliance before hosting.
(Source: AirROI data, 2026, based on 93% licensed listings)
Top Performing Airbnb Properties in Mosquera (2026)
Benchmark your potential! Explore examples of top-performing Airbnb properties in Mosquerabased on Trailing Twelve Month (TTM) revenue. Analyze their characteristics, revenue, occupancy rate, and ADR to understand what drives success in this market.
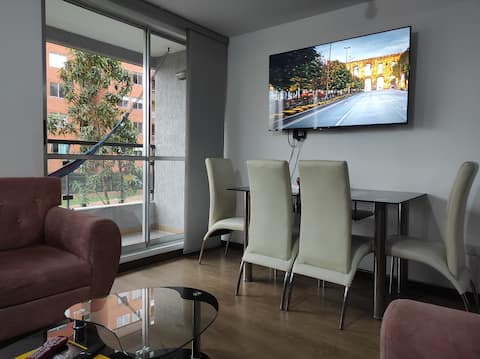
A beautiful family apartment.
Entire Place • 3 bedrooms

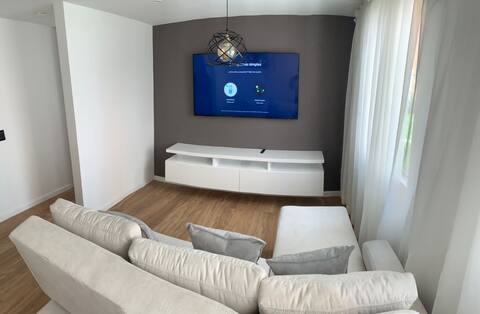
Apartment 20 minutes from Bogotá Airport
Entire Place • 3 bedrooms

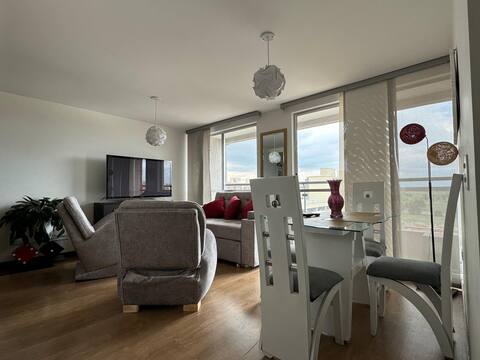
Luxury Best location & Comfortable 15 min to Bogot
Entire Place • 3 bedrooms
New & Cheap Apartment with ALL you need
Entire Place • 1 bedroom

Where everyone wants to go and nobody wants to leave
Entire Place • 3 bedrooms
Beautiful view near the best Mosquera clubs
Entire Place • 3 bedrooms
Note: Performance varies based on location, size, amenities, seasonality, and management quality. Data reflects the past 12 months.
Top Performing Airbnb Hosts in Mosquera (2026)
Learn from the best! This table showcases top-performing Airbnb hosts in Mosquera based on the number of properties managed and estimated total revenue over the past year. Analyze their scale and performance metrics.
| Host Name | Properties | Grossing Revenue | Stay Reviews | Avg Rating |
|---|---|---|---|---|
| Freddy | 1 | $9,866 | 75 | 4.80/5.0 |
| Rafa | 1 | $8,690 | 122 | 4.87/5.0 |
| Diego | 1 | $7,277 | 9 | 4.89/5.0 |
| Thalia | 1 | $6,898 | 93 | 4.97/5.0 |
| German Giovanni | 1 | $6,895 | 68 | 4.90/5.0 |
| Angela | 2 | $6,615 | 54 | 4.74/5.0 |
| Paola | 1 | $6,062 | 43 | 4.86/5.0 |
| Katherine | 1 | $5,706 | 31 | 4.94/5.0 |
| Andres | 1 | $5,351 | 24 | 4.88/5.0 |
| Eddie | 1 | $5,247 | 49 | 4.88/5.0 |
Analyzing the strategies of top hosts, such as their property selection, pricing, and guest communication, can offer valuable lessons for optimizing your own Airbnb operations in Mosquera.
Dive Deeper: Advanced Mosquera STR Market Data (2026)
Ready to unlock more insights? AirROI provides access to advanced metrics and comprehensive Airbnb data for Mosquera. Explore detailed analytics beyond this report to refine your investment strategy, optimize pricing, and maximize your vacation rental profits.
Explore Advanced MetricsMosquera Short-Term Rental Market Composition (2026): Property & Room Types
Room Type Distribution
Property Type Distribution
Market Composition Insights for Mosquera
- The Mosquera Airbnb market composition is heavily skewed towards Entire Home/Apt listings, which make up 92.9% of the 28 active rentals. This indicates strong guest preference for privacy and space.
- Looking at the property type distribution in Mosquera, Apartment/Condo properties are the most common (82.1%), reflecting the local real estate landscape.
- Houses represent a significant 17.9% portion, catering likely to families or larger groups.
Mosquera Airbnb Room Capacity Analysis (2026): Bedroom Distribution
Distribution of Listings by Number of Bedrooms
Room Capacity Insights for Mosquera
- The dominant room capacity in Mosquera is 3 bedrooms listings, making up 60.7% of the market. This suggests a strong demand for properties suitable for families or small groups.
- Together, 3 bedrooms and 2 bedrooms properties represent 82.1% of the active Airbnb listings in Mosquera, indicating a high concentration in these sizes.
- A significant 67.9% of listings offer 3+ bedrooms, catering to larger groups and families seeking more space in Mosquera.
Mosquera Vacation Rental Guest Capacity Trends (2026)
Distribution of Listings by Guest Capacity
Guest Capacity Insights for Mosquera
- The most common guest capacity trend in Mosquera vacation rentals is listings accommodating 4 guests (35.7%). This suggests the primary traveler segment is likely small families or groups.
- Properties designed for 4 guests and 5 guests dominate the Mosquera STR market, accounting for 57.1% of listings.
- 21.5% of properties accommodate 6+ guests, serving the market segment for larger families or group travel in Mosquera.
- On average, properties in Mosquera are equipped to host 4.4 guests.
Mosquera Airbnb Booking Patterns (2026): Available vs. Booked Days
Available Days Distribution
Booked Days Distribution
Booking Pattern Insights for Mosquera
- The most common availability pattern in Mosquera falls within the 181-270 days range, representing 42.9% of listings. This suggests many properties have significant open periods on their calendars.
- Approximately 85.8% of listings show high availability (181+ days open annually), indicating potential for increased bookings or specific owner usage patterns.
- For booked days, the 91-180 days range is most frequent in Mosquera (42.9%), reflecting common guest stay durations or potential owner blocking patterns.
- A notable 14.3% of properties secure long booking periods (181+ days booked per year), highlighting successful long-term rental strategies or significant owner usage.
Mosquera Airbnb Minimum Stay Requirements Analysis
Distribution of Listings by Minimum Night Requirement
1 Night
3 listings
10.7% of total
2 Nights
12 listings
42.9% of total
3 Nights
1 listings
3.6% of total
4-6 Nights
1 listings
3.6% of total
7-29 Nights
3 listings
10.7% of total
30+ Nights
8 listings
28.6% of total
Key Insights
- The most prevalent minimum stay requirement in Mosquera is 2 Nights, adopted by 42.9% of listings. This highlights the market's preference for shorter, flexible bookings.
- A significant segment (28.6%) caters to monthly stays (30+ nights) in Mosquera, pointing to opportunities in the extended-stay market.
Recommendations
- Align with the market by considering a 2 Nights minimum stay, as 42.9% of Mosquera hosts use this setting.
- If feasible, allowing 1-night stays, especially midweek or during low season, could capture last-minute bookings, as only 10.7% currently do.
- A 2-night minimum appears standard (42.9%). Consider this for weekends or peak periods.
- Explore offering discounts for stays of 30+ nights to attract the 28.6% of the market seeking extended stays.
- Adjust minimum nights based on seasonality – potentially shorter during low season and longer during peak demand periods in Mosquera.
Mosquera Airbnb Cancellation Policy Trends Analysis (2026)
Limited
1 listings
3.6% of total
Flexible
8 listings
28.6% of total
Moderate
13 listings
46.4% of total
Firm
4 listings
14.3% of total
Strict
2 listings
7.1% of total
Cancellation Policy Insights for Mosquera
- The prevailing Airbnb cancellation policy trend in Mosquera is Moderate, used by 46.4% of listings.
- The market strongly favors guest-friendly terms, with 75.0% of listings offering Flexible or Moderate policies. This suggests guests in Mosquera may expect booking flexibility.
- Strict cancellation policies are quite rare (7.1%), potentially making listings with this policy less competitive unless justified by high demand or property type.
Recommendations for Hosts
- Consider adopting a Moderate policy to align with the 46.4% market standard in Mosquera.
- Using a Strict policy might deter some guests, as only 7.1% of listings use it. Evaluate if potential revenue protection outweighs possible lower booking rates.
- Regularly review your cancellation policy against competitors and market demand shifts in Mosquera.
Mosquera STR Booking Lead Time Analysis (2026)
Average Booking Lead Time by Month
Booking Lead Time Insights for Mosquera
- The overall average booking lead time for vacation rentals in Mosquera is 19 days.
- Guests book furthest in advance for stays during January (average 18 days), likely coinciding with peak travel demand or local events.
- The shortest booking windows occur for stays in May (average 5 days), indicating more last-minute travel plans during this time.
- Seasonally, Summer (14 days avg.) sees the longest lead times, while Spring (11 days avg.) has the shortest, reflecting typical travel planning cycles.
Recommendations for Hosts
- Use the overall average lead time (19 days) as a baseline for your pricing and availability strategy in Mosquera.
- During May, focus on last-minute booking availability and promotions, as guests book with very short notice (5 days avg.).
- Target marketing efforts for the Summer season well in advance (at least 14 days) to capture early planners.
- Monitor your own booking lead times against these Mosquera averages to identify opportunities for dynamic pricing adjustments.
Popular & Essential Airbnb Amenities in Mosquera (2026)
Amenity Prevalence
Amenity Insights for Mosquera
- Essential amenities in Mosquera that guests expect include: Wifi, Kitchen, TV, Hangers, Hot water. Lacking these (any) could significantly impact bookings.
- Popular amenities like Washer, Cooking basics, Iron are common but not universal. Offering these can provide a competitive edge.
Recommendations for Hosts
- Ensure your listing includes all essential amenities for Mosquera: Wifi, Kitchen, TV, Hangers, Hot water.
- Prioritize adding missing essentials: TV, Hangers, Hot water.
- Consider adding popular differentiators like Washer or Cooking basics to increase appeal.
- Highlight unique or less common amenities you offer (e.g., hot tub, dedicated workspace, EV charger) in your listing description and photos.
- Regularly check competitor amenities in Mosquera to stay competitive.
Mosquera Airbnb Guest Demographics & Profile Analysis (2026)
Guest Profile Summary for Mosquera
- The typical guest profile for Airbnb in Mosquera consists of primarily domestic travelers (77%), often arriving from nearby Bogotá, typically belonging to the Post-2000s (Gen Z/Alpha) group (50%), primarily speaking Spanish or English.
- Domestic travelers account for 77.3% of guests.
- Key international markets include Colombia (77.3%) and United States (11.4%).
- Top languages spoken are Spanish (62%) followed by English (31%).
- A significant demographic segment is the Post-2000s (Gen Z/Alpha) group, representing 50% of guests.
Recommendations for Hosts
- Target domestic marketing efforts towards travelers from Bogotá and Medellín.
- Tailor amenities and listing descriptions to appeal to the dominant Post-2000s (Gen Z/Alpha) demographic (e.g., highlight fast WiFi, smart home features, local guides).
- Highlight unique local experiences or amenities relevant to the primary guest profile.
- Consider seasonal promotions aligned with peak travel times for key origin markets.
Nearby Short-Term Rental Market Comparison
How does the Mosquera Airbnb market stack up against its neighbors? Compare key performance metrics like average monthly revenue, ADR, and occupancy rates in surrounding areas to understand the broader regional STR landscape.
| Market | Active Properties | Monthly Revenue | Daily Rate | Avg. Occupancy |
|---|---|---|---|---|
| Cauca Viejo | 26 | $2,181 | $298.12 | 27% |
| Anapoima | 286 | $1,775 | $279.24 | 26% |
| Apulo | 105 | $1,505 | $270.37 | 22% |
| Cundinamarca | 11 | $1,424 | $201.05 | 23% |
| La Pintada | 20 | $1,381 | $258.80 | 24% |
| Fredonia | 14 | $1,284 | $201.88 | 23% |
| Nilo | 73 | $1,138 | $246.56 | 21% |
| Quebradanegra | 22 | $977 | $189.40 | 16% |
| El Imperio | 14 | $900 | $193.43 | 19% |
| Villeta | 325 | $860 | $181.51 | 20% |