Pacho Airbnb Market Analysis 2026: Short Term Rental Data & Vacation Rental Statistics in Cundinamarca, Colombia
Is Airbnb profitable in Pacho in 2026? Explore comprehensive Airbnb analytics for Pacho, Cundinamarca, Colombia to uncover income potential. This 2026 STR market report for Pacho, based on AirROI data from February 2025 to January 2026, reveals key trends in the niche market of 20 active listings.
Whether you're considering an Airbnb investment in Pacho, optimizing your existing vacation rental, or exploring rental arbitrage opportunities, understanding the Pacho Airbnb data is crucial. Navigating the high regulation landscape is key to maximizing your short term rental income potential. Let's dive into the specifics.
Key Pacho Airbnb Performance Metrics Overview
Monthly Airbnb Revenue Variations & Income Potential in Pacho (2026)
Understanding the monthly revenue variations for Airbnb listings in Pacho is key to maximizing your short term rental income potential. Seasonality significantly impacts earnings. Our analysis, based on data from the past 12 months, shows that the peak revenue month for STRs in Pacho is typically December, while August often presents the lowest earnings, highlighting opportunities for strategic pricing adjustments during shoulder and low seasons. Explore the typical Airbnb income in Pacho across different performance tiers:
- Best-in-class properties (Top 10%) achieve $2,096+ monthly, often utilizing dynamic pricing and superior guest experiences.
- Strong performing properties (Top 25%) earn $754 or more, indicating effective management and desirable locations/amenities.
- Typical properties (Median) generate around $340 per month, representing the average market performance.
- Entry-level properties (Bottom 25%) see earnings around $194, often with potential for optimization.
Average Monthly Airbnb Earnings Trend in Pacho
Pacho Airbnb Occupancy Rate Trends (2026)
Maximize your bookings by understanding the Pacho STR occupancy trends. Seasonal demand shifts significantly influence how often properties are booked. Typically, Decembersees the highest demand (peak season occupancy), while January experiences the lowest (low season). Effective strategies, like adjusting minimum stays or offering promotions, can boost occupancy during slower periods. Here's how different property tiers perform in Pacho:
- Best-in-class properties (Top 10%) achieve 37%+ occupancy, indicating high desirability and potentially optimized availability.
- Strong performing properties (Top 25%) maintain 28% or higher occupancy, suggesting good market fit and guest satisfaction.
- Typical properties (Median) have an occupancy rate around 15%.
- Entry-level properties (Bottom 25%) average 8% occupancy, potentially facing higher vacancy.
Average Monthly Occupancy Rate Trend in Pacho
Average Daily Rate (ADR) Airbnb Trends in Pacho (2026)
Effective short term rental pricing strategy in Pacho involves understanding monthly ADR fluctuations. The Average Daily Rate (ADR) for Airbnb in Pacho typically peaks in January and dips lowest during March. Leveraging Airbnb dynamic pricing tools or strategies based on this seasonality can significantly boost revenue. Here's a look at the typical nightly rates achieved:
- Best-in-class properties (Top 10%) command rates of $152+ per night, often due to premium features or locations.
- Strong performing properties (Top 25%) achieve nightly rates of $115 or more.
- Typical properties (Median) charge around $69 per night.
- Entry-level properties (Bottom 25%) earn around $49 per night.
Average Daily Rate (ADR) Trend by Month in Pacho
Get Live Pacho Market Intelligence 👇

Explore Real-time Analytics
Airbnb Seasonality Analysis & Trends in Pacho (2026)
Peak Season (December, October, July)
- Revenue averages $948 per month
- Occupancy rates average 21.9%
- Daily rates average $98
Shoulder Season
- Revenue averages $648 per month
- Occupancy maintains around 19.1%
- Daily rates hold near $92
Low Season (April, June, August)
- Revenue drops to average $483 per month
- Occupancy decreases to average 18.2%
- Daily rates adjust to average $85
Seasonality Insights for Pacho
- The Airbnb seasonality in Pacho shows highly seasonal trends requiring careful strategy. While the sections above show seasonal averages, it's also insightful to look at the extremes:
- During the high season, the absolute peak month showcases Pacho's highest earning potential, with monthly revenues capable of climbing to $1,162, occupancy reaching a high of 25.5%, and ADRs peaking at $108.
- Conversely, the slowest single month of the year, typically falling within the low season, marks the market's lowest point. In this month, revenue might dip to $468, occupancy could drop to 14.7%, and ADRs may adjust down to $80.
- Understanding both the seasonal averages and these monthly peaks and troughs in revenue, occupancy, and ADR is crucial for maximizing your Airbnb profit potential in Pacho.
Seasonal Strategies for Maximizing Profit
- Peak Season: Maximize revenue through premium pricing and potentially longer minimum stays. Ensure high availability.
- Low Season: Offer competitive pricing, special promotions (e.g., extended stay discounts), and flexible cancellation policies. Target off-season travelers like remote workers or budget-conscious guests.
- Shoulder Seasons: Implement dynamic pricing that balances peak and low rates. Target weekend travelers or specific events. Offer slightly more flexible terms than peak season.
- Regularly analyze your own performance against these Pacho seasonality benchmarks and adjust your pricing and availability strategy accordingly.
Best Areas for Airbnb Investment in Pacho (2026)
Exploring the top neighborhoods for short-term rentals in Pacho? This section highlights key areas, outlining why they are attractive for hosts and guests, along with notable local attractions. Consider these locations based on your target guest profile and investment strategy.
| Neighborhood / Area | Why Host Here? (Target Guests & Appeal) | Key Attractions & Landmarks |
|---|---|---|
| La Calera | A popular destination close to Bogotá, with beautiful views and nature, attracting tourists looking for relaxation or outdoor activities. | Santuario de Monserrate, Parque Natural Chicaque, La Calera Viewpoint, Cascadas de La Chorrera, Cerro de Quebrada Vieja |
| Guatavita | Famous for its stunning lagoon and rich indigenous history, Guatavita draws visitors interested in culture and nature. | Laguna de Guatavita, Guatavita Museum, Santuario de Nuestra Señora de Guatavita, Cervecería de Guatavita, Pueblito Boyacense |
| Choachí | This charming town near Bogotá offers access to beautiful hiking trails and waterfalls, making it an ideal getaway for nature lovers. | Cascadas de Choachí, Parque Natural Chicaque, La Cuchilla del Salto, Sendero de la Salto, Mirador de Choachí |
| Tocaima | Known for its warm climate and hot springs, Tocaima is a popular weekend escape for Bogotá residents seeking relaxation. | Termales de Tocaima, Plaza de Tocaima, Iglesia de San Juan Bautista, Centro de Tocaima, Parque de los Enamorados |
| Zipaquirá | Famous for its Salt Cathedral, Zipaquirá attracts history buffs and tourists interested in unique architectural sites. | Salt Cathedral of Zipaquirá, Plaza de la Independencia, Iglesia del Topo, Parque de la Salud, Puente del Común |
| Sopó | A fashionably rustic escape from the city life, Sopó is known for its outdoor activities and beautiful landscapes. | Parque Natural Chicaque, Cerro de La Novena, Laguna de Guatavita, Chocontá River, Sendero de Sopó |
| Cajicá | This picturesque town offers a mix of small-town charm and modern amenities, attracting visitors looking for tranquility near Bogotá. | Cajicá Town Square, Iglesia de Cajicá, Parque de Cajicá, Centro Comercial El Cielo, Café de la Plaza |
| Chocontá | Offering a mix of cultural heritage and beautiful landscapes, Chocontá is perfect for travelers seeking an authentic Colombian experience. | Iglesia de San Juan Bautista, Río Chocontá, Alameda de Chocontá, Puente del Común, Sendero de Chocontá |
Understanding Airbnb License Requirements & STR Laws in Pacho (2026)
Yes, Pacho, Cundinamarca, Colombia enforces high STR regulations. Obtaining a license and ensuring compliance is almost certainly required according to current 2026 STR laws. Always verify the latest short term rental regulations and Airbnb license requirements directly with local government authorities for Pacho to ensure full compliance before hosting.
(Source: AirROI data, 2026, based on 95% licensed listings)
Top Performing Airbnb Properties in Pacho (2026)
Benchmark your potential! Explore examples of top-performing Airbnb properties in Pachobased on Trailing Twelve Month (TTM) revenue. Analyze their characteristics, revenue, occupancy rate, and ADR to understand what drives success in this market.
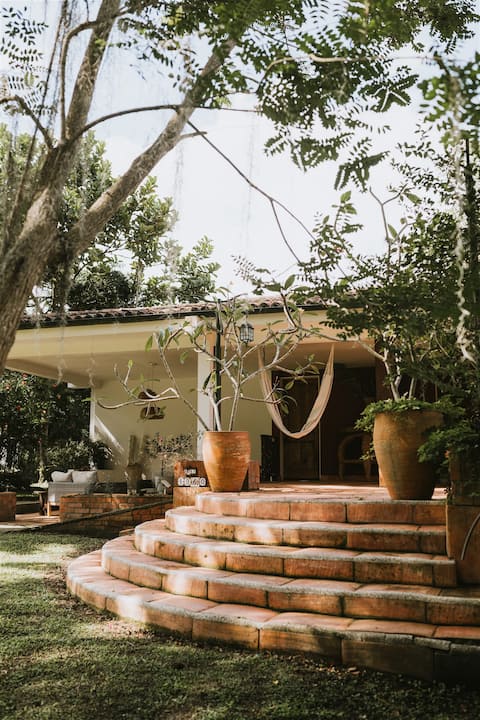
Casa los Naranjos in Estación Bambusa.
Entire Place • 6 bedrooms

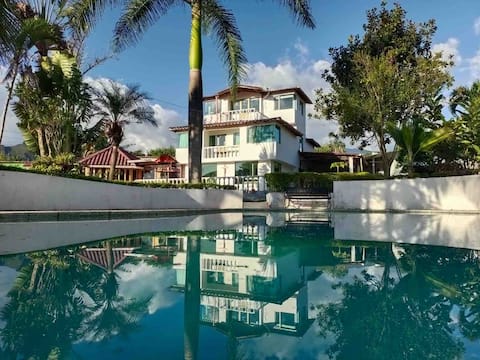
Casa Kolibri: spectacular villa on a private lake
Entire Place • 4 bedrooms
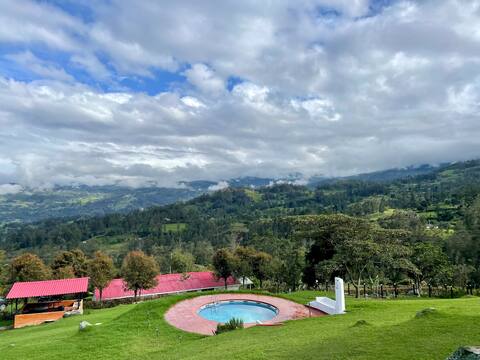
Amazing Views | Renovated house near Bogota
Entire Place • 4 bedrooms
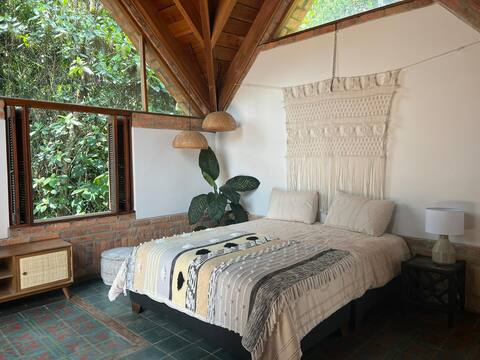
Casa Kolibri: Mountain Suite
Private Room • 1 bedroom
Casa Pajonales
Entire Place • 5 bedrooms

Casa Kolibri: Dragonfly room
Private Room • 1 bedroom
Note: Performance varies based on location, size, amenities, seasonality, and management quality. Data reflects the past 12 months.
Top Performing Airbnb Hosts in Pacho (2026)
Learn from the best! This table showcases top-performing Airbnb hosts in Pacho based on the number of properties managed and estimated total revenue over the past year. Analyze their scale and performance metrics.
| Host Name | Properties | Grossing Revenue | Stay Reviews | Avg Rating |
|---|---|---|---|---|
| Maria | 5 | $46,440 | 89 | 4.96/5.0 |
| Fundacion Yarumo | 1 | $26,696 | 89 | 5.00/5.0 |
| Melissa | 1 | $13,901 | 69 | 5.00/5.0 |
| Gynna | 1 | $7,920 | 8 | 4.38/5.0 |
| Luis | 3 | $4,586 | 19 | 5.00/5.0 |
| Ingrid | 2 | $4,452 | 11 | 4.80/5.0 |
| Michel Stiven | 1 | $2,256 | 6 | 4.67/5.0 |
| @hostora.Co | 1 | $2,218 | 18 | 4.39/5.0 |
| Kristian Felipe | 1 | $1,942 | 40 | 4.90/5.0 |
| Astrid | 1 | $1,575 | 45 | 4.53/5.0 |
Analyzing the strategies of top hosts, such as their property selection, pricing, and guest communication, can offer valuable lessons for optimizing your own Airbnb operations in Pacho.
Dive Deeper: Advanced Pacho STR Market Data (2026)
Ready to unlock more insights? AirROI provides access to advanced metrics and comprehensive Airbnb data for Pacho. Explore detailed analytics beyond this report to refine your investment strategy, optimize pricing, and maximize your vacation rental profits.
Explore Advanced MetricsPacho Short-Term Rental Market Composition (2026): Property & Room Types
Room Type Distribution
Property Type Distribution
Market Composition Insights for Pacho
- The Pacho Airbnb market composition is heavily skewed towards Entire Home/Apt listings, which make up 80% of the 20 active rentals. This indicates strong guest preference for privacy and space.
- Looking at the property type distribution in Pacho, House properties are the most common (50%), reflecting the local real estate landscape.
- Houses represent a significant 50% portion, catering likely to families or larger groups.
Pacho Airbnb Room Capacity Analysis (2026): Bedroom Distribution
Distribution of Listings by Number of Bedrooms
Room Capacity Insights for Pacho
- The dominant room capacity in Pacho is 1 bedroom listings, making up 45% of the market. This suggests a strong demand for properties suitable for couples or solo travelers.
- Together, 1 bedroom and 5+ bedrooms properties represent 60.0% of the active Airbnb listings in Pacho, indicating a high concentration in these sizes.
- A significant 45.0% of listings offer 3+ bedrooms, catering to larger groups and families seeking more space in Pacho.
Pacho Vacation Rental Guest Capacity Trends (2026)
Distribution of Listings by Guest Capacity
Guest Capacity Insights for Pacho
- The most common guest capacity trend in Pacho vacation rentals is listings accommodating 8+ guests (45%). This suggests the primary traveler segment is likely larger groups.
- Properties designed for 8+ guests and 2 guests dominate the Pacho STR market, accounting for 85.0% of listings.
- 45.0% of properties accommodate 6+ guests, serving the market segment for larger families or group travel in Pacho.
- On average, properties in Pacho are equipped to host 5.0 guests.
Pacho Airbnb Booking Patterns (2026): Available vs. Booked Days
Available Days Distribution
Booked Days Distribution
Booking Pattern Insights for Pacho
- The most common availability pattern in Pacho falls within the 271-366 days range, representing 85% of listings. This suggests many properties have significant open periods on their calendars.
- Approximately 100.0% of listings show high availability (181+ days open annually), indicating potential for increased bookings or specific owner usage patterns.
- For booked days, the 1-30 days range is most frequent in Pacho (45%), reflecting common guest stay durations or potential owner blocking patterns.
Pacho Airbnb Minimum Stay Requirements Analysis
Distribution of Listings by Minimum Night Requirement
1 Night
17 listings
85% of total
2 Nights
3 listings
15% of total
Key Insights
- The most prevalent minimum stay requirement in Pacho is 1 Night, adopted by 85% of listings. This highlights the market's preference for shorter, flexible bookings.
- A strong majority (100.0%) of the Pacho Airbnb data shows acceptance of very short stays (1-2 nights), indicating a dynamic, high-turnover market.
Recommendations
- Align with the market by considering a 1 Night minimum stay, as 85% of Pacho hosts use this setting.
- Adjust minimum nights based on seasonality – potentially shorter during low season and longer during peak demand periods in Pacho.
Pacho Airbnb Cancellation Policy Trends Analysis (2026)
Limited
1 listings
5% of total
Flexible
4 listings
20% of total
Moderate
9 listings
45% of total
Firm
5 listings
25% of total
Strict
1 listings
5% of total
Cancellation Policy Insights for Pacho
- The prevailing Airbnb cancellation policy trend in Pacho is Moderate, used by 45% of listings.
- There's a relatively balanced mix between guest-friendly (65.0%) and stricter (30.0%) policies, offering choices for different guest needs.
- Strict cancellation policies are quite rare (5%), potentially making listings with this policy less competitive unless justified by high demand or property type.
Recommendations for Hosts
- Consider adopting a Moderate policy to align with the 45% market standard in Pacho.
- Using a Strict policy might deter some guests, as only 5% of listings use it. Evaluate if potential revenue protection outweighs possible lower booking rates.
- Regularly review your cancellation policy against competitors and market demand shifts in Pacho.
Pacho STR Booking Lead Time Analysis (2026)
Average Booking Lead Time by Month
Booking Lead Time Insights for Pacho
- The overall average booking lead time for vacation rentals in Pacho is 22 days.
- Guests book furthest in advance for stays during January (average 56 days), likely coinciding with peak travel demand or local events.
- The shortest booking windows occur for stays in February (average 11 days), indicating more last-minute travel plans during this time.
- Seasonally, Winter (34 days avg.) sees the longest lead times, while Fall (18 days avg.) has the shortest, reflecting typical travel planning cycles.
Recommendations for Hosts
- Use the overall average lead time (22 days) as a baseline for your pricing and availability strategy in Pacho.
- For January stays, consider implementing length-of-stay discounts or slightly higher rates for bookings made less than 56 days out to capitalize on advance planning.
- During February, focus on last-minute booking availability and promotions, as guests book with very short notice (11 days avg.).
- Target marketing efforts for the Winter season well in advance (at least 34 days) to capture early planners.
- Monitor your own booking lead times against these Pacho averages to identify opportunities for dynamic pricing adjustments.
Popular & Essential Airbnb Amenities in Pacho (2026)
Amenity Prevalence
Amenity Insights for Pacho
- Essential amenities in Pacho that guests expect include: Free parking on premises, Wifi. Lacking these (any) could significantly impact bookings.
- Popular amenities like Outdoor dining area, First aid kit, Fire pit are common but not universal. Offering these can provide a competitive edge.
Recommendations for Hosts
- Ensure your listing includes all essential amenities for Pacho: Free parking on premises, Wifi.
- Prioritize adding missing essentials: Wifi.
- Consider adding popular differentiators like Outdoor dining area or First aid kit to increase appeal.
- Highlight unique or less common amenities you offer (e.g., hot tub, dedicated workspace, EV charger) in your listing description and photos.
- Regularly check competitor amenities in Pacho to stay competitive.
Pacho Airbnb Guest Demographics & Profile Analysis (2026)
Guest Profile Summary for Pacho
- The typical guest profile for Airbnb in Pacho consists of primarily domestic travelers (87%), often arriving from nearby Bogotá, typically belonging to the Post-2000s (Gen Z/Alpha) group (50%), primarily speaking Spanish or English.
- Domestic travelers account for 87.0% of guests.
- Key international markets include Colombia (87%) and Chile (3.7%).
- Top languages spoken are Spanish (43.5%) followed by English (34.8%).
- A significant demographic segment is the Post-2000s (Gen Z/Alpha) group, representing 50% of guests.
Recommendations for Hosts
- Target domestic marketing efforts towards travelers from Bogotá and Bogota.
- Tailor amenities and listing descriptions to appeal to the dominant Post-2000s (Gen Z/Alpha) demographic (e.g., highlight fast WiFi, smart home features, local guides).
- Highlight unique local experiences or amenities relevant to the primary guest profile.
- Consider seasonal promotions aligned with peak travel times for key origin markets.
Nearby Short-Term Rental Market Comparison
How does the Pacho Airbnb market stack up against its neighbors? Compare key performance metrics like average monthly revenue, ADR, and occupancy rates in surrounding areas to understand the broader regional STR landscape.
| Market | Active Properties | Monthly Revenue | Daily Rate | Avg. Occupancy |
|---|---|---|---|---|
| San Nicolás | 18 | $3,446 | $345.13 | 34% |
| Cauca Viejo | 26 | $2,181 | $298.12 | 27% |
| Córdoba | 23 | $1,794 | $269.01 | 22% |
| Anapoima | 286 | $1,775 | $279.24 | 26% |
| Popalito | 10 | $1,529 | $250.41 | 22% |
| Apulo | 105 | $1,505 | $270.37 | 22% |
| Cundinamarca | 11 | $1,424 | $201.05 | 23% |
| La Pintada | 20 | $1,381 | $258.80 | 24% |
| Fredonia | 14 | $1,284 | $201.88 | 23% |
| Antioquia | 13 | $1,267 | $292.11 | 23% |