Pueblo de Choachi Airbnb Market Analysis 2026: Short Term Rental Data & Vacation Rental Statistics in Cundinamarca, Colombia
Is Airbnb profitable in Pueblo de Choachi in 2026? Explore comprehensive Airbnb analytics for Pueblo de Choachi, Cundinamarca, Colombia to uncover income potential. This 2026 STR market report for Pueblo de Choachi, based on AirROI data from February 2025 to January 2026, reveals key trends in the niche market of 21 active listings.
Whether you're considering an Airbnb investment in Pueblo de Choachi, optimizing your existing vacation rental, or exploring rental arbitrage opportunities, understanding the Pueblo de Choachi Airbnb data is crucial. Navigating the high regulation landscape is key to maximizing your short term rental income potential. Let's dive into the specifics.
Key Pueblo de Choachi Airbnb Performance Metrics Overview
Monthly Airbnb Revenue Variations & Income Potential in Pueblo de Choachi (2026)
Understanding the monthly revenue variations for Airbnb listings in Pueblo de Choachi is key to maximizing your short term rental income potential. Seasonality significantly impacts earnings. Our analysis, based on data from the past 12 months, shows that the peak revenue month for STRs in Pueblo de Choachi is typically December, while October often presents the lowest earnings, highlighting opportunities for strategic pricing adjustments during shoulder and low seasons. Explore the typical Airbnb income in Pueblo de Choachi across different performance tiers:
- Best-in-class properties (Top 10%) achieve $657+ monthly, often utilizing dynamic pricing and superior guest experiences.
- Strong performing properties (Top 25%) earn $368 or more, indicating effective management and desirable locations/amenities.
- Typical properties (Median) generate around $164 per month, representing the average market performance.
- Entry-level properties (Bottom 25%) see earnings around $107, often with potential for optimization.
Average Monthly Airbnb Earnings Trend in Pueblo de Choachi
Pueblo de Choachi Airbnb Occupancy Rate Trends (2026)
Maximize your bookings by understanding the Pueblo de Choachi STR occupancy trends. Seasonal demand shifts significantly influence how often properties are booked. Typically, Februarysees the highest demand (peak season occupancy), while October experiences the lowest (low season). Effective strategies, like adjusting minimum stays or offering promotions, can boost occupancy during slower periods. Here's how different property tiers perform in Pueblo de Choachi:
- Best-in-class properties (Top 10%) achieve 32%+ occupancy, indicating high desirability and potentially optimized availability.
- Strong performing properties (Top 25%) maintain 21% or higher occupancy, suggesting good market fit and guest satisfaction.
- Typical properties (Median) have an occupancy rate around 15%.
- Entry-level properties (Bottom 25%) average 10% occupancy, potentially facing higher vacancy.
Average Monthly Occupancy Rate Trend in Pueblo de Choachi
Average Daily Rate (ADR) Airbnb Trends in Pueblo de Choachi (2026)
Effective short term rental pricing strategy in Pueblo de Choachi involves understanding monthly ADR fluctuations. The Average Daily Rate (ADR) for Airbnb in Pueblo de Choachi typically peaks in December and dips lowest during February. Leveraging Airbnb dynamic pricing tools or strategies based on this seasonality can significantly boost revenue. Here's a look at the typical nightly rates achieved:
- Best-in-class properties (Top 10%) command rates of $86+ per night, often due to premium features or locations.
- Strong performing properties (Top 25%) achieve nightly rates of $68 or more.
- Typical properties (Median) charge around $38 per night.
- Entry-level properties (Bottom 25%) earn around $30 per night.
Average Daily Rate (ADR) Trend by Month in Pueblo de Choachi
Get Live Pueblo de Choachi Market Intelligence 👇

Explore Real-time Analytics
Airbnb Seasonality Analysis & Trends in Pueblo de Choachi (2026)
Peak Season (December, May, February)
- Revenue averages $373 per month
- Occupancy rates average 22.0%
- Daily rates average $48
Shoulder Season
- Revenue averages $298 per month
- Occupancy maintains around 17.8%
- Daily rates hold near $48
Low Season (September, October, November)
- Revenue drops to average $228 per month
- Occupancy decreases to average 13.2%
- Daily rates adjust to average $49
Seasonality Insights for Pueblo de Choachi
- The Airbnb seasonality in Pueblo de Choachi shows moderate seasonality with distinct peak and low periods. While the sections above show seasonal averages, it's also insightful to look at the extremes:
- During the high season, the absolute peak month showcases Pueblo de Choachi's highest earning potential, with monthly revenues capable of climbing to $388, occupancy reaching a high of 25.9%, and ADRs peaking at $50.
- Conversely, the slowest single month of the year, typically falling within the low season, marks the market's lowest point. In this month, revenue might dip to $201, occupancy could drop to 11.2%, and ADRs may adjust down to $44.
- Understanding both the seasonal averages and these monthly peaks and troughs in revenue, occupancy, and ADR is crucial for maximizing your Airbnb profit potential in Pueblo de Choachi.
Seasonal Strategies for Maximizing Profit
- Peak Season: Maximize revenue through premium pricing and potentially longer minimum stays. Ensure high availability.
- Low Season: Offer competitive pricing, special promotions (e.g., extended stay discounts), and flexible cancellation policies. Target off-season travelers like remote workers or budget-conscious guests.
- Shoulder Seasons: Implement dynamic pricing that balances peak and low rates. Target weekend travelers or specific events. Offer slightly more flexible terms than peak season.
- Regularly analyze your own performance against these Pueblo de Choachi seasonality benchmarks and adjust your pricing and availability strategy accordingly.
Best Areas for Airbnb Investment in Pueblo de Choachi (2026)
Exploring the top neighborhoods for short-term rentals in Pueblo de Choachi? This section highlights key areas, outlining why they are attractive for hosts and guests, along with notable local attractions. Consider these locations based on your target guest profile and investment strategy.
| Neighborhood / Area | Why Host Here? (Target Guests & Appeal) | Key Attractions & Landmarks |
|---|---|---|
| Centro | The heart of Pueblo de Choachi, offering a mix of local culture, shops, and restaurants. Ideal for travelers wanting to experience authentic Colombian life with easy access to attractions. | Plaza de Mercado, Iglesia de San Juan Bautista, Parque Principal, local artisan shops, traditional restaurants |
| La Calera | Nearby town known for its beautiful landscapes and proximity to the capital, Bogotá. Attracts visitors who enjoy nature and outdoor activities, making it a great spot for eco-tourism. | La Calera Lookout, Cerro de Monserrate, nature trails, local farms, scenic viewpoints |
| Suesca | A popular destination for rock climbing and adventure sports. Draws thrill-seekers and nature lovers, creating opportunities for adventure tourism accommodations. | Suesca Rocks, Outdoor adventure tours, scenic hiking trails, natural parks |
| Guatavita | Famous for the legend of El Dorado and picturesque landscapes. Offers a unique cultural and historical experience, making it a great location for Airbnb hosting. | Laguna de Guatavita, Guatavita Park, Museo Indigena, town's colonial architecture |
| La Mesa | Known for its pleasant weather and beautiful countryside. Popular among tourists seeking relaxation and nature-related activities. | Cascadas del Chizo, La Mesa's parks, local coffee farms, hiking routes |
| Tena | Known for its natural beauty and diverse ecosystems, Tena attracts eco-tourists and those interested in wildlife and adventure activities. | Tena River, ecosystem tours, waterfall hikes, nature reserves |
| Cajicá | Close to Bogotá, Cajicá offers a tranquil setting with rich cultural heritage, attracting visitors looking for a weekend getaway from the city. | Cajicá's old town, local festivals, art galleries, historical sites |
| Chipaque | A small town with serene environment, great for those interested in authenticity and tranquility away from the hustle of larger cities. | local farms, natural landscapes, sustainable tourism experiences |
Understanding Airbnb License Requirements & STR Laws in Pueblo de Choachi (2026)
Yes, Pueblo de Choachi, Cundinamarca, Colombia enforces high STR regulations. Obtaining a license and ensuring compliance is almost certainly required according to current 2026 STR laws. Always verify the latest short term rental regulations and Airbnb license requirements directly with local government authorities for Pueblo de Choachi to ensure full compliance before hosting.
(Source: AirROI data, 2026, based on 95% licensed listings)
Top Performing Airbnb Properties in Pueblo de Choachi (2026)
Benchmark your potential! Explore examples of top-performing Airbnb properties in Pueblo de Choachibased on Trailing Twelve Month (TTM) revenue. Analyze their characteristics, revenue, occupancy rate, and ADR to understand what drives success in this market.

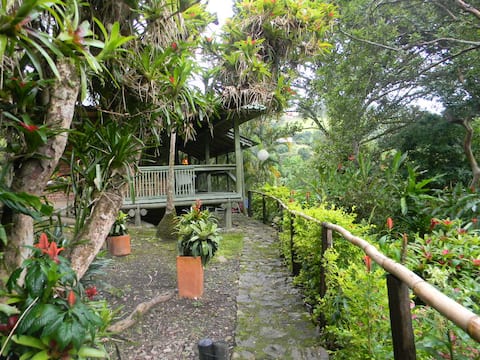
Bohío Huitaca "Jungle House"
Entire Place • 2 bedrooms

Villa del Pilar: Cozy full house in Choachi
Entire Place • 3 bedrooms

Colonial house 10 people 3 rooms
Entire Place • 3 bedrooms
Vista Hermosa Apartment.
Entire Place • 4 bedrooms
El Amanecer Apartment
Entire Place • 2 bedrooms
BEAUTIFUL COUNTRY STUDIO IN CHOACHI
Entire Place • 1 bedroom
Note: Performance varies based on location, size, amenities, seasonality, and management quality. Data reflects the past 12 months.
Top Performing Airbnb Hosts in Pueblo de Choachi (2026)
Learn from the best! This table showcases top-performing Airbnb hosts in Pueblo de Choachi based on the number of properties managed and estimated total revenue over the past year. Analyze their scale and performance metrics.
| Host Name | Properties | Grossing Revenue | Stay Reviews | Avg Rating |
|---|---|---|---|---|
| Piedad | 2 | $16,198 | 48 | 4.87/5.0 |
| Oscar Miguel | 4 | $8,654 | 83 | 4.94/5.0 |
| Pilar | 4 | $8,042 | 139 | 4.98/5.0 |
| Ines Cortes | 2 | $3,980 | 182 | 4.88/5.0 |
| Carmen | 1 | $3,693 | 11 | 5.00/5.0 |
| Lucía | 1 | $3,427 | 20 | 4.85/5.0 |
| Paola | 1 | $1,527 | 73 | 4.85/5.0 |
| Yolanda | 2 | $1,505 | 54 | 4.88/5.0 |
| Carlos | 1 | $601 | 14 | 4.79/5.0 |
| Fran | 1 | $368 | 8 | 5.00/5.0 |
Analyzing the strategies of top hosts, such as their property selection, pricing, and guest communication, can offer valuable lessons for optimizing your own Airbnb operations in Pueblo de Choachi.
Dive Deeper: Advanced Pueblo de Choachi STR Market Data (2026)
Ready to unlock more insights? AirROI provides access to advanced metrics and comprehensive Airbnb data for Pueblo de Choachi. Explore detailed analytics beyond this report to refine your investment strategy, optimize pricing, and maximize your vacation rental profits.
Explore Advanced MetricsPueblo de Choachi Short-Term Rental Market Composition (2026): Property & Room Types
Room Type Distribution
Property Type Distribution
Market Composition Insights for Pueblo de Choachi
- The Pueblo de Choachi Airbnb market composition is heavily skewed towards Entire Home/Apt listings, which make up 52.4% of the 21 active rentals. This indicates strong guest preference for privacy and space.
- However, a notable 42.9% share for Private Rooms suggests opportunities for budget-conscious travelers or hosts renting out spare rooms.
- Looking at the property type distribution in Pueblo de Choachi, House properties are the most common (66.7%), reflecting the local real estate landscape.
- Houses represent a significant 66.7% portion, catering likely to families or larger groups.
- The presence of 9.5% Hotel/Boutique listings indicates integration with traditional hospitality.
Pueblo de Choachi Airbnb Room Capacity Analysis (2026): Bedroom Distribution
Distribution of Listings by Number of Bedrooms
Room Capacity Insights for Pueblo de Choachi
- The dominant room capacity in Pueblo de Choachi is 2 bedrooms listings, making up 23.8% of the market. This suggests a strong demand for properties suitable for couples or solo travelers.
- Together, 2 bedrooms and 3 bedrooms properties represent 42.8% of the active Airbnb listings in Pueblo de Choachi, indicating a high concentration in these sizes.
- A significant 23.8% of listings offer 3+ bedrooms, catering to larger groups and families seeking more space in Pueblo de Choachi.
Pueblo de Choachi Vacation Rental Guest Capacity Trends (2026)
Distribution of Listings by Guest Capacity
Guest Capacity Insights for Pueblo de Choachi
- The most common guest capacity trend in Pueblo de Choachi vacation rentals is listings accommodating 8+ guests (19%). This suggests the primary traveler segment is likely larger groups.
- Properties designed for 8+ guests and 2 guests dominate the Pueblo de Choachi STR market, accounting for 33.3% of listings.
- 28.5% of properties accommodate 6+ guests, serving the market segment for larger families or group travel in Pueblo de Choachi.
- On average, properties in Pueblo de Choachi are equipped to host 3.1 guests.
Pueblo de Choachi Airbnb Booking Patterns (2026): Available vs. Booked Days
Available Days Distribution
Booked Days Distribution
Booking Pattern Insights for Pueblo de Choachi
- The most common availability pattern in Pueblo de Choachi falls within the 271-366 days range, representing 95.2% of listings. This suggests many properties have significant open periods on their calendars.
- Approximately 100.0% of listings show high availability (181+ days open annually), indicating potential for increased bookings or specific owner usage patterns.
- For booked days, the 31-90 days range is most frequent in Pueblo de Choachi (52.4%), reflecting common guest stay durations or potential owner blocking patterns.
Pueblo de Choachi Airbnb Minimum Stay Requirements Analysis
Distribution of Listings by Minimum Night Requirement
1 Night
16 listings
76.2% of total
2 Nights
4 listings
19% of total
30+ Nights
1 listings
4.8% of total
Key Insights
- The most prevalent minimum stay requirement in Pueblo de Choachi is 1 Night, adopted by 76.2% of listings. This highlights the market's preference for shorter, flexible bookings.
- A strong majority (95.2%) of the Pueblo de Choachi Airbnb data shows acceptance of very short stays (1-2 nights), indicating a dynamic, high-turnover market.
Recommendations
- Align with the market by considering a 1 Night minimum stay, as 76.2% of Pueblo de Choachi hosts use this setting.
- Adjust minimum nights based on seasonality – potentially shorter during low season and longer during peak demand periods in Pueblo de Choachi.
Pueblo de Choachi Airbnb Cancellation Policy Trends Analysis (2026)
Flexible
6 listings
28.6% of total
Moderate
12 listings
57.1% of total
Firm
3 listings
14.3% of total
Cancellation Policy Insights for Pueblo de Choachi
- The prevailing Airbnb cancellation policy trend in Pueblo de Choachi is Moderate, used by 57.1% of listings.
- The market strongly favors guest-friendly terms, with 85.7% of listings offering Flexible or Moderate policies. This suggests guests in Pueblo de Choachi may expect booking flexibility.
Recommendations for Hosts
- Consider adopting a Moderate policy to align with the 57.1% market standard in Pueblo de Choachi.
- Regularly review your cancellation policy against competitors and market demand shifts in Pueblo de Choachi.
Pueblo de Choachi STR Booking Lead Time Analysis (2026)
Average Booking Lead Time by Month
Booking Lead Time Insights for Pueblo de Choachi
- The overall average booking lead time for vacation rentals in Pueblo de Choachi is 18 days.
- Guests book furthest in advance for stays during December (average 39 days), likely coinciding with peak travel demand or local events.
- The shortest booking windows occur for stays in September (average 6 days), indicating more last-minute travel plans during this time.
- Seasonally, Winter (25 days avg.) sees the longest lead times, while Fall (12 days avg.) has the shortest, reflecting typical travel planning cycles.
Recommendations for Hosts
- Use the overall average lead time (18 days) as a baseline for your pricing and availability strategy in Pueblo de Choachi.
- For December stays, consider implementing length-of-stay discounts or slightly higher rates for bookings made less than 39 days out to capitalize on advance planning.
- During September, focus on last-minute booking availability and promotions, as guests book with very short notice (6 days avg.).
- Target marketing efforts for the Winter season well in advance (at least 25 days) to capture early planners.
- Monitor your own booking lead times against these Pueblo de Choachi averages to identify opportunities for dynamic pricing adjustments.
Popular & Essential Airbnb Amenities in Pueblo de Choachi (2026)
Amenity Prevalence
Amenity Insights for Pueblo de Choachi
- Essential amenities in Pueblo de Choachi that guests expect include: Wifi, Kitchen. Lacking these (any) could significantly impact bookings.
- Popular amenities like TV, Hot water, Essentials are common but not universal. Offering these can provide a competitive edge.
Recommendations for Hosts
- Ensure your listing includes all essential amenities for Pueblo de Choachi: Wifi, Kitchen.
- Prioritize adding missing essentials: Kitchen.
- Consider adding popular differentiators like TV or Hot water to increase appeal.
- Highlight unique or less common amenities you offer (e.g., hot tub, dedicated workspace, EV charger) in your listing description and photos.
- Regularly check competitor amenities in Pueblo de Choachi to stay competitive.
Pueblo de Choachi Airbnb Guest Demographics & Profile Analysis (2026)
Guest Profile Summary for Pueblo de Choachi
- The typical guest profile for Airbnb in Pueblo de Choachi consists of primarily domestic travelers (70%), often arriving from nearby Bogotá, typically belonging to the Post-2000s (Gen Z/Alpha) group (50%), primarily speaking Spanish or English.
- Domestic travelers account for 69.9% of guests.
- Key international markets include Colombia (69.9%) and United States (17.8%).
- Top languages spoken are Spanish (42.7%) followed by English (36.6%).
- A significant demographic segment is the Post-2000s (Gen Z/Alpha) group, representing 50% of guests.
Recommendations for Hosts
- Target domestic marketing efforts towards travelers from Bogotá and Bogota.
- Tailor amenities and listing descriptions to appeal to the dominant Post-2000s (Gen Z/Alpha) demographic (e.g., highlight fast WiFi, smart home features, local guides).
- Highlight unique local experiences or amenities relevant to the primary guest profile.
- Consider seasonal promotions aligned with peak travel times for key origin markets.
Nearby Short-Term Rental Market Comparison
How does the Pueblo de Choachi Airbnb market stack up against its neighbors? Compare key performance metrics like average monthly revenue, ADR, and occupancy rates in surrounding areas to understand the broader regional STR landscape.
| Market | Active Properties | Monthly Revenue | Daily Rate | Avg. Occupancy |
|---|---|---|---|---|
| Anapoima | 286 | $1,775 | $279.24 | 26% |
| Apulo | 105 | $1,505 | $270.37 | 22% |
| Cundinamarca | 11 | $1,424 | $201.05 | 23% |
| Nilo | 73 | $1,138 | $246.56 | 21% |
| Quebradanegra | 22 | $977 | $189.40 | 16% |
| El Imperio | 14 | $900 | $193.43 | 19% |
| Villeta | 325 | $860 | $181.51 | 20% |
| Nimaima | 34 | $843 | $195.06 | 19% |
| Sasaima | 42 | $810 | $132.40 | 22% |
| Vergara | 11 | $773 | $106.11 | 25% |