Soacha Airbnb Market Analysis 2026: Short Term Rental Data & Vacation Rental Statistics in Cundinamarca, Colombia
Is Airbnb profitable in Soacha in 2026? Explore comprehensive Airbnb analytics for Soacha, Cundinamarca, Colombia to uncover income potential. This 2026 STR market report for Soacha, based on AirROI data from February 2025 to January 2026, reveals key trends in the niche market of 19 active listings.
Whether you're considering an Airbnb investment in Soacha, optimizing your existing vacation rental, or exploring rental arbitrage opportunities, understanding the Soacha Airbnb data is crucial. Navigating the high regulation landscape is key to maximizing your short term rental income potential. Let's dive into the specifics.
Key Soacha Airbnb Performance Metrics Overview
Monthly Airbnb Revenue Variations & Income Potential in Soacha (2026)
Understanding the monthly revenue variations for Airbnb listings in Soacha is key to maximizing your short term rental income potential. Seasonality significantly impacts earnings. Our analysis, based on data from the past 12 months, shows that the peak revenue month for STRs in Soacha is typically November, while February often presents the lowest earnings, highlighting opportunities for strategic pricing adjustments during shoulder and low seasons. Explore the typical Airbnb income in Soacha across different performance tiers:
- Best-in-class properties (Top 10%) achieve $631+ monthly, often utilizing dynamic pricing and superior guest experiences.
- Strong performing properties (Top 25%) earn $511 or more, indicating effective management and desirable locations/amenities.
- Typical properties (Median) generate around $278 per month, representing the average market performance.
- Entry-level properties (Bottom 25%) see earnings around $114, often with potential for optimization.
Average Monthly Airbnb Earnings Trend in Soacha
Soacha Airbnb Occupancy Rate Trends (2026)
Maximize your bookings by understanding the Soacha STR occupancy trends. Seasonal demand shifts significantly influence how often properties are booked. Typically, Novembersees the highest demand (peak season occupancy), while July experiences the lowest (low season). Effective strategies, like adjusting minimum stays or offering promotions, can boost occupancy during slower periods. Here's how different property tiers perform in Soacha:
- Best-in-class properties (Top 10%) achieve 80%+ occupancy, indicating high desirability and potentially optimized availability.
- Strong performing properties (Top 25%) maintain 63% or higher occupancy, suggesting good market fit and guest satisfaction.
- Typical properties (Median) have an occupancy rate around 38%.
- Entry-level properties (Bottom 25%) average 17% occupancy, potentially facing higher vacancy.
Average Monthly Occupancy Rate Trend in Soacha
Average Daily Rate (ADR) Airbnb Trends in Soacha (2026)
Effective short term rental pricing strategy in Soacha involves understanding monthly ADR fluctuations. The Average Daily Rate (ADR) for Airbnb in Soacha typically peaks in January and dips lowest during February. Leveraging Airbnb dynamic pricing tools or strategies based on this seasonality can significantly boost revenue. Here's a look at the typical nightly rates achieved:
- Best-in-class properties (Top 10%) command rates of $31+ per night, often due to premium features or locations.
- Strong performing properties (Top 25%) achieve nightly rates of $27 or more.
- Typical properties (Median) charge around $24 per night.
- Entry-level properties (Bottom 25%) earn around $19 per night.
Average Daily Rate (ADR) Trend by Month in Soacha
Get Live Soacha Market Intelligence 👇

Explore Real-time Analytics
Airbnb Seasonality Analysis & Trends in Soacha (2026)
Peak Season (November, March, June)
- Revenue averages $433 per month
- Occupancy rates average 54.3%
- Daily rates average $23
Shoulder Season
- Revenue averages $333 per month
- Occupancy maintains around 40.0%
- Daily rates hold near $24
Low Season (January, February, July)
- Revenue drops to average $253 per month
- Occupancy decreases to average 36.2%
- Daily rates adjust to average $23
Seasonality Insights for Soacha
- The Airbnb seasonality in Soacha shows highly seasonal trends requiring careful strategy. While the sections above show seasonal averages, it's also insightful to look at the extremes:
- During the high season, the absolute peak month showcases Soacha's highest earning potential, with monthly revenues capable of climbing to $499, occupancy reaching a high of 58.1%, and ADRs peaking at $26.
- Conversely, the slowest single month of the year, typically falling within the low season, marks the market's lowest point. In this month, revenue might dip to $238, occupancy could drop to 31.7%, and ADRs may adjust down to $20.
- Understanding both the seasonal averages and these monthly peaks and troughs in revenue, occupancy, and ADR is crucial for maximizing your Airbnb profit potential in Soacha.
Seasonal Strategies for Maximizing Profit
- Peak Season: Maximize revenue through premium pricing and potentially longer minimum stays. Ensure high availability.
- Low Season: Offer competitive pricing, special promotions (e.g., extended stay discounts), and flexible cancellation policies. Target off-season travelers like remote workers or budget-conscious guests.
- Shoulder Seasons: Implement dynamic pricing that balances peak and low rates. Target weekend travelers or specific events. Offer slightly more flexible terms than peak season.
- Regularly analyze your own performance against these Soacha seasonality benchmarks and adjust your pricing and availability strategy accordingly.
Best Areas for Airbnb Investment in Soacha (2026)
Exploring the top neighborhoods for short-term rentals in Soacha? This section highlights key areas, outlining why they are attractive for hosts and guests, along with notable local attractions. Consider these locations based on your target guest profile and investment strategy.
| Neighborhood / Area | Why Host Here? (Target Guests & Appeal) | Key Attractions & Landmarks |
|---|---|---|
| Centro de Soacha | The main commercial and cultural hub of Soacha, offering easy access to public transportation and a vibrant local atmosphere. Ideal for both business and leisure travelers looking to explore the area. | Parque Principal de Soacha, Centro Comercial Soacha, Iglesia de San Bernardino, Parque Olaya Herrera |
| Ciudad Verde | A modern and rapidly growing residential area known for its parks and family-friendly environment. Popular with locals and tourists seeking a quieter stay, yet close to amenities. | Parque de Ciudad Verde, Centro Comercial Plaza de las Flores, Iglesia de Ciudad Verde, Parque El Mayor |
| San Francisco | A zone with a mix of residential and commercial spaces, well-connected to Bogotá and other parts of Soacha. Attractive for travelers who want to explore nearby cities easily. | Parque de San Francisco, Parque El Virrey, Iglesia de San Francisco, Shopping en Puente Aranda |
| La Isla | A unique area featuring natural landscapes and access to river recreation, appealing to nature lovers and those seeking a peaceful getaway near urban amenities. | Río Soacha, Parque La Isla, senderos ecológicos, ciclorrutas |
| El Altico | A suburban area with a growing community, ideal for families and those looking for spacious accommodations away from the city bustle. Offers a local feel with parks and schools nearby. | Parque El Altico, Iglesia de San Vicente, centros educativos, comercios locales |
| Soacha Centro Histórico | Historic center with traditional architecture and local culture, perfect for guests interested in history and authenticity in their stay, with many local eateries and shops. | Museo de Soacha, Plaza de Mercado, Edificio de la Alcaldía, Casco Antiguo |
| Altos de Cazucá | An area undergoing development, attracting attention due to its affordability and potential for growth. Suitable for budget travelers and locals alike. | Parque Altos de Cazucá, Proyectos de vivienda nueva, comercios emergentes, caminos de acceso a Bogotá |
| La Paz | A well-established neighborhood with many amenities and a friendly community atmosphere, appealing to travelers looking for long-term stays or family visits. | Parque La Paz, Iglesia de La Paz, centros comerciales cercanos, zonas recreativas |
Understanding Airbnb License Requirements & STR Laws in Soacha (2026)
Yes, Soacha, Cundinamarca, Colombia enforces high STR regulations. Obtaining a license and ensuring compliance is almost certainly required according to current 2026 STR laws. Always verify the latest short term rental regulations and Airbnb license requirements directly with local government authorities for Soacha to ensure full compliance before hosting.
(Source: AirROI data, 2026, based on 95% licensed listings)
Top Performing Airbnb Properties in Soacha (2026)
Benchmark your potential! Explore examples of top-performing Airbnb properties in Soachabased on Trailing Twelve Month (TTM) revenue. Analyze their characteristics, revenue, occupancy rate, and ADR to understand what drives success in this market.
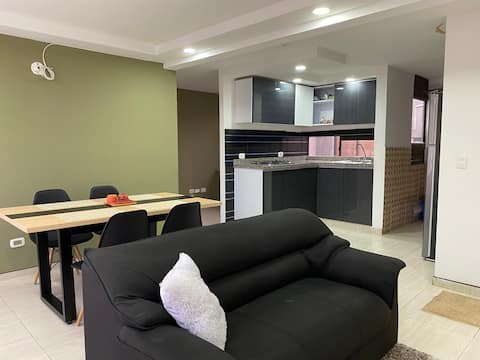
Modern and cozy 70 m² home near Bogotá
Entire Place • 3 bedrooms
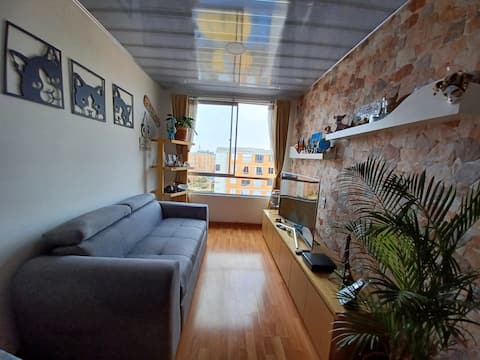
Apartment with an excellent location, modern
Entire Place • 3 bedrooms
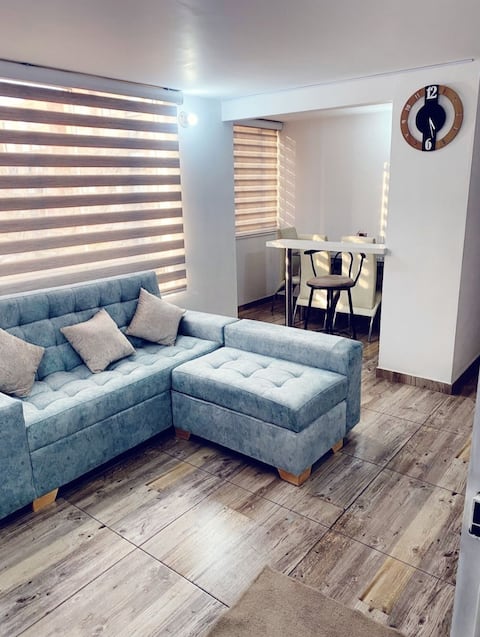
Beautiful apartment in Soacha.
Entire Place • 2 bedrooms

Cozy apartment with an industrial touch.
Entire Place • 2 bedrooms

Living san Michel
Entire Place • 3 bedrooms

ciudad verde naranjo
Entire Place • 3 bedrooms
Note: Performance varies based on location, size, amenities, seasonality, and management quality. Data reflects the past 12 months.
Top Performing Airbnb Hosts in Soacha (2026)
Learn from the best! This table showcases top-performing Airbnb hosts in Soacha based on the number of properties managed and estimated total revenue over the past year. Analyze their scale and performance metrics.
| Host Name | Properties | Grossing Revenue | Stay Reviews | Avg Rating |
|---|---|---|---|---|
| Dayana | 2 | $8,482 | 67 | 4.91/5.0 |
| Paola | 1 | $7,427 | 20 | 4.80/5.0 |
| Freddy | 1 | $5,835 | 20 | 4.80/5.0 |
| Freydden | 1 | $4,893 | 18 | 4.83/5.0 |
| Diana Y Nelson | 2 | $4,499 | 40 | 4.83/5.0 |
| Gloria | 1 | $2,632 | 21 | 4.81/5.0 |
| Alejandro | 1 | $2,615 | 15 | 4.93/5.0 |
| Crhistian | 1 | $2,172 | 20 | 4.65/5.0 |
| Hector Hugo | 1 | $1,728 | 36 | 4.69/5.0 |
| María Cristina | 1 | $1,615 | 8 | 4.50/5.0 |
Analyzing the strategies of top hosts, such as their property selection, pricing, and guest communication, can offer valuable lessons for optimizing your own Airbnb operations in Soacha.
Dive Deeper: Advanced Soacha STR Market Data (2026)
Ready to unlock more insights? AirROI provides access to advanced metrics and comprehensive Airbnb data for Soacha. Explore detailed analytics beyond this report to refine your investment strategy, optimize pricing, and maximize your vacation rental profits.
Explore Advanced MetricsSoacha Short-Term Rental Market Composition (2026): Property & Room Types
Room Type Distribution
Property Type Distribution
Market Composition Insights for Soacha
- The Soacha Airbnb market composition is heavily skewed towards Entire Home/Apt listings, which make up 84.2% of the 19 active rentals. This indicates strong guest preference for privacy and space.
- Looking at the property type distribution in Soacha, Apartment/Condo properties are the most common (89.5%), reflecting the local real estate landscape.
Soacha Airbnb Room Capacity Analysis (2026): Bedroom Distribution
Distribution of Listings by Number of Bedrooms
Room Capacity Insights for Soacha
- The dominant room capacity in Soacha is 2 bedrooms listings, making up 42.1% of the market. This suggests a strong demand for properties suitable for couples or solo travelers.
- Together, 2 bedrooms and 3 bedrooms properties represent 78.9% of the active Airbnb listings in Soacha, indicating a high concentration in these sizes.
- A significant 36.8% of listings offer 3+ bedrooms, catering to larger groups and families seeking more space in Soacha.
Soacha Vacation Rental Guest Capacity Trends (2026)
Distribution of Listings by Guest Capacity
Guest Capacity Insights for Soacha
- The most common guest capacity trend in Soacha vacation rentals is listings accommodating 4 guests (26.3%). This suggests the primary traveler segment is likely small families or groups.
- Properties designed for 4 guests and 5 guests dominate the Soacha STR market, accounting for 52.6% of listings.
- On average, properties in Soacha are equipped to host 3.2 guests.
Soacha Airbnb Booking Patterns (2026): Available vs. Booked Days
Available Days Distribution
Booked Days Distribution
Booking Pattern Insights for Soacha
- The most common availability pattern in Soacha falls within the 271-366 days range, representing 57.9% of listings. This suggests many properties have significant open periods on their calendars.
- Approximately 79.0% of listings show high availability (181+ days open annually), indicating potential for increased bookings or specific owner usage patterns.
- For booked days, the 31-90 days range is most frequent in Soacha (42.1%), reflecting common guest stay durations or potential owner blocking patterns.
- A notable 21.1% of properties secure long booking periods (181+ days booked per year), highlighting successful long-term rental strategies or significant owner usage.
Soacha Airbnb Minimum Stay Requirements Analysis
Distribution of Listings by Minimum Night Requirement
1 Night
6 listings
31.6% of total
2 Nights
6 listings
31.6% of total
3 Nights
1 listings
5.3% of total
30+ Nights
6 listings
31.6% of total
Key Insights
- The most prevalent minimum stay requirement in Soacha is 1 Night, adopted by 31.6% of listings. This highlights the market's preference for shorter, flexible bookings.
- A strong majority (63.2%) of the Soacha Airbnb data shows acceptance of very short stays (1-2 nights), indicating a dynamic, high-turnover market.
- A significant segment (31.6%) caters to monthly stays (30+ nights) in Soacha, pointing to opportunities in the extended-stay market.
Recommendations
- Align with the market by considering a 1 Night minimum stay, as 31.6% of Soacha hosts use this setting.
- Explore offering discounts for stays of 30+ nights to attract the 31.6% of the market seeking extended stays.
- Adjust minimum nights based on seasonality – potentially shorter during low season and longer during peak demand periods in Soacha.
Soacha Airbnb Cancellation Policy Trends Analysis (2026)
Flexible
9 listings
47.4% of total
Moderate
3 listings
15.8% of total
Firm
5 listings
26.3% of total
Strict
2 listings
10.5% of total
Cancellation Policy Insights for Soacha
- The prevailing Airbnb cancellation policy trend in Soacha is Flexible, used by 47.4% of listings.
- There's a relatively balanced mix between guest-friendly (63.2%) and stricter (36.8%) policies, offering choices for different guest needs.
Recommendations for Hosts
- Consider adopting a Flexible policy to align with the 47.4% market standard in Soacha.
- Using a Strict policy might deter some guests, as only 10.5% of listings use it. Evaluate if potential revenue protection outweighs possible lower booking rates.
- Regularly review your cancellation policy against competitors and market demand shifts in Soacha.
Soacha STR Booking Lead Time Analysis (2026)
Average Booking Lead Time by Month
Booking Lead Time Insights for Soacha
- The overall average booking lead time for vacation rentals in Soacha is 30 days.
- Guests book furthest in advance for stays during December (average 41 days), likely coinciding with peak travel demand or local events.
- The shortest booking windows occur for stays in March (average 5 days), indicating more last-minute travel plans during this time.
- Seasonally, Winter (21 days avg.) sees the longest lead times, while Spring (7 days avg.) has the shortest, reflecting typical travel planning cycles.
Recommendations for Hosts
- Use the overall average lead time (30 days) as a baseline for your pricing and availability strategy in Soacha.
- For December stays, consider implementing length-of-stay discounts or slightly higher rates for bookings made less than 41 days out to capitalize on advance planning.
- During March, focus on last-minute booking availability and promotions, as guests book with very short notice (5 days avg.).
- Target marketing efforts for the Winter season well in advance (at least 21 days) to capture early planners.
- Monitor your own booking lead times against these Soacha averages to identify opportunities for dynamic pricing adjustments.
Popular & Essential Airbnb Amenities in Soacha (2026)
Amenity Prevalence
Amenity Insights for Soacha
- Essential amenities in Soacha that guests expect include: Wifi. Lacking these (this) could significantly impact bookings.
- Popular amenities like TV, Kitchen, Washer are common but not universal. Offering these can provide a competitive edge.
Recommendations for Hosts
- Ensure your listing includes all essential amenities for Soacha: Wifi.
- Consider adding popular differentiators like TV or Kitchen to increase appeal.
- Highlight unique or less common amenities you offer (e.g., hot tub, dedicated workspace, EV charger) in your listing description and photos.
- Regularly check competitor amenities in Soacha to stay competitive.
Soacha Airbnb Guest Demographics & Profile Analysis (2026)
Guest Profile Summary for Soacha
- The typical guest profile for Airbnb in Soacha consists of a mix of domestic (58%) and international guests, often arriving from nearby Cartagena, typically belonging to the Post-2000s (Gen Z/Alpha) group (50%), primarily speaking Spanish or English.
- Domestic travelers account for 57.9% of guests.
- Key international markets include Colombia (57.9%) and Mexico (21.1%).
- Top languages spoken are Spanish (55%) followed by English (20%).
- A significant demographic segment is the Post-2000s (Gen Z/Alpha) group, representing 50% of guests.
Recommendations for Hosts
- Balance marketing efforts between domestic and international channels based on the guest mix.
- Tailor amenities and listing descriptions to appeal to the dominant Post-2000s (Gen Z/Alpha) demographic (e.g., highlight fast WiFi, smart home features, local guides).
- Highlight unique local experiences or amenities relevant to the primary guest profile.
- Consider seasonal promotions aligned with peak travel times for key origin markets.
Nearby Short-Term Rental Market Comparison
How does the Soacha Airbnb market stack up against its neighbors? Compare key performance metrics like average monthly revenue, ADR, and occupancy rates in surrounding areas to understand the broader regional STR landscape.
| Market | Active Properties | Monthly Revenue | Daily Rate | Avg. Occupancy |
|---|---|---|---|---|
| Cauca Viejo | 26 | $2,181 | $298.12 | 27% |
| Anapoima | 286 | $1,775 | $279.24 | 26% |
| Apulo | 105 | $1,505 | $270.37 | 22% |
| Cundinamarca | 11 | $1,424 | $201.05 | 23% |
| La Pintada | 20 | $1,381 | $258.80 | 24% |
| Fredonia | 14 | $1,284 | $201.88 | 23% |
| Nilo | 73 | $1,138 | $246.56 | 21% |
| Quebradanegra | 22 | $977 | $189.40 | 16% |
| El Imperio | 14 | $900 | $193.43 | 19% |
| Villeta | 325 | $860 | $181.51 | 20% |