Zipaquirá, Cundinamarca Airbnb Market Data 2025: STR Report & Statistics
How much can you earn on Airbnb in Zipaquirá, Cundinamarca? Based on AirROI's 2025 dataset (June 2024 – May 2025), the short answer is $2,385 per year — at a $52 nightly rate, 29.4% occupancy, and a N/A RevPAR.
With just 23 active listings, Zipaquirá is a micro-market where selective demand that rewards strong listing quality and pricing strategy. Supply grew 64.3% year over year, and the market is recalibrating around a new competitive baseline. This is the stage where hosts who invest in amenities, guest experience, and dynamic pricing build durable advantages that compound as the market matures.
Regulation is high, and hosts should factor licensing costs and compliance timelines into their launch plan. In a market this size, differentiated listings with strong reviews can capture outsized returns relative to the competition.

Table of Contents [hide] [show]
What Are the Key Airbnb Metrics in Zipaquirá?
In Zipaquirá, the headline Airbnb metrics are $2,385 in average annual revenue,29.4% occupancy, $52 ADR, and $0 in RevPAR, and guests book about 20 days in advance.
How Much Do Airbnb Hosts Earn Monthly in Zipaquirá?
Understanding the monthly revenue variations for Airbnb listings in Zipaquirá is key to maximizing your short term rental income potential. Seasonality significantly impacts earnings. Our analysis, based on data from the past 12 months, shows that the peak revenue month for STRs in Zipaquirá is typically April, while August often presents the lowest earnings, highlighting opportunities for strategic pricing adjustments during shoulder and low seasons. Explore the typical Airbnb income in Zipaquirá across different performance tiers:
- Best-in-class properties (Top 10%) achieve $776+ monthly, often utilizing dynamic pricing and superior guest experiences.
- Strong performing properties (Top 25%) earn $405 or more, indicating effective management and desirable locations/amenities.
- Typical properties (Median) generate around $236 per month, representing the average market performance.
- Entry-level properties (Bottom 25%) see earnings around $119, often with potential for optimization.
Average Monthly Airbnb Earnings Trend in Zipaquirá
What Is the Monthly Airbnb Occupancy Rate in Zipaquirá?
Maximize your bookings by understanding the Zipaquirá STR occupancy trends. Seasonal demand shifts significantly influence how often properties are booked. Typically, Januarysees the highest demand (peak season occupancy), while August experiences the lowest (low season). Effective strategies, like adjusting minimum stays or offering promotions, can boost occupancy during slower periods. Here's how different property tiers perform in Zipaquirá:
- Best-in-class properties (Top 10%) achieve 62%+ occupancy, indicating high desirability and potentially optimized availability.
- Strong performing properties (Top 25%) maintain 41% or higher occupancy, suggesting good market fit and guest satisfaction.
- Typical properties (Median) have an occupancy rate around 22%.
- Entry-level properties (Bottom 25%) average 9% occupancy, potentially facing higher vacancy.
Average Monthly Occupancy Rate Trend in Zipaquirá
What Is the Average Airbnb Nightly Rate in Zipaquirá?
Effective short term rental pricing strategy in Zipaquirá involves understanding monthly ADR fluctuations. The Average Daily Rate (ADR) for Airbnb in Zipaquirá typically peaks in May and dips lowest during December. Leveraging Airbnb dynamic pricing tools or strategies based on this seasonality can significantly boost revenue. Here's a look at the typical nightly rates achieved:
- Best-in-class properties (Top 10%) command rates of $104+ per night, often due to premium features or locations.
- Strong performing properties (Top 25%) achieve nightly rates of $62 or more.
- Typical properties (Median) charge around $37 per night.
- Entry-level properties (Bottom 25%) earn around $20 per night.
Average Daily Rate (ADR) Trend by Month in Zipaquirá
What Is the RevPAR for Airbnb in Zipaquirá?
RevPAR in Zipaquirá is currently N/A. Because RevPAR combines nightly rates with realized occupancy, it is one of the cleanest ways to compare how efficiently listings turn demand into revenue across the market.
- Entry-level properties (Bottom 25%) see N/A RevPAR.
- Typical properties (Median) generate N/A RevPAR.
- Strong performers (Top 25%) earn N/A RevPAR.
- Best-in-class (Top 10%) achieve N/A RevPAR.
Average Monthly RevPAR Trend in Zipaquirá
RevPAR Insights for Zipaquirá
- RevPAR peaks in Jan and bottoms out in Jan, mirroring the broader seasonal demand pattern and suggesting opportunities for dynamic pricing.
Recommendations for Hosts
- Track your own RevPAR monthly against these Zipaquir�á benchmarks. If your RevPAR falls below the median of N/A, examine whether low occupancy or low ADR is the primary drag.
- Use RevPAR rather than revenue alone when comparing properties of different sizes — it normalizes for available nights and gives a more accurate picture of performance.
Get Live Zipaquirá Market Intelligence 👇
Explore Real-time Analytics
When Is the Peak Season for Airbnb in Zipaquirá?
Zipaquirá's peak Airbnb season falls in April, January, September, while the softest stretch is May, August, October. Overall, the market shows moderate seasonality with distinct peak and low periods, which should guide pricing, minimum stays, and cash-flow planning.
Peak Season (April, January, September)
- Revenue averages $387 per month
- Occupancy rates average 34.7%
- Daily rates average $52
Shoulder Season
- Revenue averages $323 per month
- Occupancy maintains around 30.4%
- Daily rates hold near $49
Low Season (May, August, October)
- Revenue drops to average $258 per month
- Occupancy decreases to average 20.6%
- Daily rates adjust to average $50
Seasonality Insights for Zipaquirá
- The Airbnb seasonality pattern in Zipaquirá shows moderate seasonality with distinct peak and low periods. While the sections above show seasonal averages, it is also insightful to look at the extremes:
- During the high season, the absolute peak month showcases Zipaquirá's highest earning potential, with monthly revenues climbing to $428, occupancy reaching 40.7%, and ADRs peaking at $57.
- Conversely, the slowest single month marks the market's lowest point — revenue may dip to $238, occupancy could drop to 16.5%, and ADRs may adjust to $45.
- Lower occupancy paired with meaningful seasonality means hosts in Zipaquirá need to maximize every peak-season booking and seriously consider whether off-season pricing adjustments or minimum-stay changes can capture incremental revenue.
Seasonal Strategies for Maximizing Profit
- Peak Season: Maximize revenue through premium pricing. In a high-regulation market like Zipaquirá, ensure your permit covers the number of nights you plan to book — some jurisdictions cap annual rental days.
- Low Season: Offer competitive pricing, extended-stay discounts, and flexible cancellation policies. Target off-season travelers like remote workers, budget-conscious guests, and travelers with flexible schedules.
- Shoulder Seasons: Implement dynamic pricing that bridges peak and low rates. Target weekend travelers, local events, and business visitors. Slightly more flexible terms than peak season can help maintain occupancy without deep discounting.
- Regularly analyze your own performance against these Zipaquirá seasonality benchmarks and adjust your pricing and availability strategy accordingly.
Do You Need a License for Airbnb in Zipaquirá?
Zipaquirá, Cundinamarca, Colombia has a high regulation classification, yet only 57% of listings show registration evidence. That gap between regulation on the books and compliance on the ground can shift quickly — municipalities often tighten enforcement in waves, putting unregistered operators at risk of fines or delisting. Always verify the latest short-term rental regulations and Airbnb license requirements directly with local government authorities for Zipaquirá to ensure full compliance before hosting.
(Source: AirROI data, 2026, based on 57% licensed listings)
What Are the Best Neighborhoods for Airbnb in Zipaquirá?
With a compact short-term rental market, Zipaquirá gives early-mover hosts an advantage in the right neighborhoods. The areas listed below are where guest demand and local attractions converge — a useful lens for investors evaluating whether to enter this market and where to position their listing.
| Neighborhood / Area | Why Host Here? (Target Guests & Appeal) | Key Attractions & Landmarks |
|---|---|---|
| Catedral de Sal | A UNESCO World Heritage Site, this stunning underground cathedral attracts many tourists, offering a unique and historical experience. Perfect for visitors looking to explore the architectural marvel of Zipaquirá. | Salt Cathedral, Underground Lake, Zipaquirá History Museum |
| Plaza de los Comuneros | The vibrant main square of Zipaquirá, surrounded by cafes and shops, making it a hub for local culture and gatherings. Ideal for those wanting to experience the local community atmosphere. | Church of Santa Barbara, Local cafes and shops, Artisan market |
| Cerro de Candelaria | A scenic spot offering breathtaking views of Zipaquirá and the countryside, great for nature lovers and hikers. Attracts visitors looking for outdoor activities and a peaceful environment. | Hiking trails, Natural viewpoints, Eco-tourism activities |
| Parque Ecoturístico Bío Zipa | An ecological park that promotes nature conservation and offers recreational activities. Popular for families and those looking to relax in nature, suitable for eco-conscious tourists. | Nature trails, Bird watching, Family picnics |
| Monserrate | Located nearby, Monserrate offers stunning views of Bogotá and the surrounding areas, making it a popular day trip for visitors. Good for those wanting to explore the region beyond Zipaquirá. | Monserrate Sanctuary, Cable Car, Panoramic views of Bogotá |
| Museo del Oro Zipaquirá | A museum showcasing the rich history of gold in Colombia, appealing to visitors interested in culture and history. Provides educational opportunities for tourists. | Gold artifacts, Cultural exhibits, Historical tours |
| Estadio de Zipaquirá | Home to local sports events, this stadium is a great spot for sports enthusiasts. Attracts visitors during game days and events, often bustling with local energy. | Football matches, Local events, Community gatherings |
| La Candelaria neighborhood | A charming and picturesque area with colonial architecture, attracting those who appreciate history and culture. Great for leisurely walks and exploration. | Colorful streets, Cafes and restaurants, Art galleries |
Because Zipaquirá has a high regulation profile, confirming that short-term rental permits are available in your target neighborhood is a critical first step before committing to a property purchase. Regulation can vary at the neighborhood or district level even within the same city.
What Types of Properties Are on Airbnb in Zipaquirá?
Room Type Distribution
Property Type Distribution
Market Composition Insights for Zipaquirá
- The Zipaquirá Airbnb market composition is heavily skewed towards Entire Home/Apt listings, which make up 87% of the 23 active rentals. This indicates strong guest preference for privacy and space.
- Looking at the property type distribution in Zipaquirá, Apartment/Condo properties are the most common (52.2%), reflecting the local real estate landscape.
- The presence of 8.7% Hotel/Boutique listings indicates integration with traditional hospitality.
Zipaquirá Airbnb Room Capacity Analysis (2026): Bedroom Distribution
Distribution of Listings by Number of Bedrooms
Room Capacity Insights for Zipaquirá
- The dominant room capacity in Zipaquirá is 1 bedroom listings, making up 34.8% of the market. This suggests a strong demand for properties suitable for couples or solo travelers.
- Together, 1 bedroom and 3 bedrooms properties represent 69.6% of the active Airbnb listings in Zipaquirá, indicating a high concentration in these sizes.
- A significant 39.1% of listings offer 3+ bedrooms, catering to larger groups and families seeking more space in Zipaquirá.
Zipaquirá Vacation Rental Guest Capacity Trends (2026)
Distribution of Listings by Guest Capacity
Guest Capacity Insights for Zipaquirá
- The most common guest capacity trend in Zipaquirá vacation rentals is listings accommodating 5 guests (21.7%). This suggests the primary traveler segment is likely larger groups.
- Properties designed for 5 guests and 4 guests dominate the Zipaquirá STR market, accounting for 43.4% of listings.
- 30.3% of properties accommodate 6+ guests, serving the market segment for larger families or group travel in Zipaquirá.
- On average, properties in Zipaquirá are equipped to host 4.7 guests.
What Amenities Do Airbnb Guests Expect in Zipaquirá?
Amenity Prevalence
Amenity Insights for Zipaquirá
- Essential amenities in Zipaquirá that guests expect include: Kitchen, Wifi. Lacking these (any) could significantly impact bookings.
- Popular amenities like TV, Hot water, Essentials are common but not universal. Offering these can provide a competitive edge.
Recommendations for Hosts
- Ensure your listing includes all essential amenities for Zipaquirá: Kitchen, Wifi.
- Prioritize adding missing essentials: Kitchen, Wifi.
- Consider adding popular differentiators like TV or Hot water to increase appeal.
- Highlight unique or less common amenities you offer (e.g., hot tub, dedicated workspace, EV charger) in your listing description and photos.
- Regularly check competitor amenities in Zipaquirá to stay competitive.
Dive Deeper: Advanced Zipaquirá STR Market Data (2026)
Ready to unlock more insights? AirROI provides access to advanced metrics and comprehensive Airbnb data for Zipaquirá. Explore detailed analytics beyond this report to refine your investment strategy, optimize pricing, and maximize your vacation rental profits.
Explore Advanced MetricsZipaquirá Airbnb Guest Demographics & Profile Analysis (2026)
Guest Profile Summary for Zipaquirá
- The typical guest profile for Airbnb in Zipaquirá consists of primarily domestic travelers (70%), often arriving from nearby Bogotá, typically belonging to the Post-2000s (Gen Z/Alpha) group (50%), primarily speaking Spanish or English.
- Domestic travelers account for 69.9% of guests.
- Key international markets include Colombia (69.9%) and United States (12.6%).
- Top languages spoken are Spanish (50.8%) followed by English (32.5%).
- A significant demographic segment is the Post-2000s (Gen Z/Alpha) group, representing 50% of guests.
Recommendations for Hosts
- Target domestic marketing efforts towards travelers from Bogotá and Bogota.
- Tailor amenities and listing descriptions to appeal to the dominant Post-2000s (Gen Z/Alpha) demographic (e.g., highlight fast WiFi, smart home features, local guides).
- Highlight unique local experiences or amenities relevant to the primary guest profile.
- Consider seasonal promotions aligned with peak travel times for key origin markets.
Zipaquirá Airbnb Booking Patterns (2026): Available vs. Booked Days
Available Days Distribution
Booked Days Distribution
Booking Pattern Insights for Zipaquirá
- The most common availability pattern in Zipaquirá falls within the 271-366 days range, representing 73.9% of listings. This suggests many properties have significant open periods on their calendars.
- Approximately 95.6% of listings show high availability (181+ days open annually), indicating potential for increased bookings or specific owner usage patterns.
- For booked days, the 31-90 days range is most frequent in Zipaquirá (39.1%), reflecting common guest stay durations or potential owner blocking patterns.
- A notable 4.3% of properties secure long booking periods (181+ days booked per year), highlighting successful long-term rental strategies or significant owner usage.
How Far in Advance Do Guests Book Airbnb in Zipaquirá?
Average Booking Lead Time by Month
Booking Lead Time Insights for Zipaquirá
- The overall average booking lead time for vacation rentals in Zipaquirá is 20 days.
- Guests book furthest in advance for stays during December (average 36 days), likely coinciding with peak travel demand or local events.
- The shortest booking windows occur for stays in July (average 8 days), indicating more last-minute travel plans during this time.
- Seasonally, Winter (23 days avg.) sees the longest lead times, while Summer (12 days avg.) has the shortest, reflecting typical travel planning cycles.
Recommendations for Hosts
- Use the overall average lead time (20 days) as a baseline for your pricing and availability strategy in Zipaquirá.
- For December stays, consider implementing length-of-stay discounts or slightly higher rates for bookings made less than 36 days out to capitalize on advance planning.
- During July, focus on last-minute booking availability and promotions, as guests book with very short notice (8 days avg.).
- Target marketing efforts for the Winter season well in advance (at least 23 days) to capture early planners.
- Monitor your own booking lead times against these Zipaquirá averages to identify opportunities for dynamic pricing adjustments.
Zipaquirá Airbnb Minimum Stay Requirements Analysis
Distribution of Listings by Minimum Night Requirement
1 Night
11 listings
50% of total
2 Nights
5 listings
22.7% of total
3 Nights
1 listings
4.5% of total
7-29 Nights
3 listings
13.6% of total
30+ Nights
2 listings
9.1% of total
Key Insights
- The most prevalent minimum stay requirement in Zipaquirá is 1 Night, adopted by 50% of listings. This highlights the market's preference for shorter, flexible bookings.
- A strong majority (72.7%) of the Zipaquirá Airbnb data shows acceptance of very short stays (1-2 nights), indicating a dynamic, high-turnover market.
Recommendations
- Align with the market by considering a 1 Night minimum stay, as 50% of Zipaquirá hosts use this setting.
- Explore offering discounts for stays of 30+ nights to attract the 9.1% of the market seeking extended stays.
- Adjust minimum nights based on seasonality – potentially shorter during low season and longer during peak demand periods in Zipaquirá.
Zipaquirá Airbnb Cancellation Policy Trends Analysis (2026)
Limited
1 listings
5.6% of total
Flexible
8 listings
44.4% of total
Moderate
6 listings
33.3% of total
Firm
2 listings
11.1% of total
Strict
1 listings
5.6% of total
Cancellation Policy Insights for Zipaquirá
- The prevailing Airbnb cancellation policy trend in Zipaquirá is Flexible, used by 44.4% of listings.
- The market strongly favors guest-friendly terms, with 77.7% of listings offering Flexible or Moderate policies. This suggests guests in Zipaquirá may expect booking flexibility.
- Strict cancellation policies are quite rare (5.6%), potentially making listings with this policy less competitive unless justified by high demand or property type.
Recommendations for Hosts
- Consider adopting a Flexible policy to align with the 44.4% market standard in Zipaquirá.
- Using a Strict policy might deter some guests, as only 5.6% of listings use it. Evaluate if potential revenue protection outweighs possible lower booking rates.
- Regularly review your cancellation policy against competitors and market demand shifts in Zipaquirá.
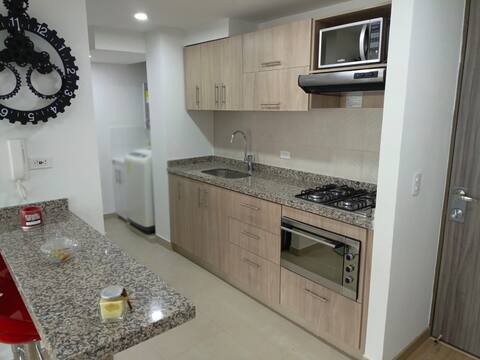
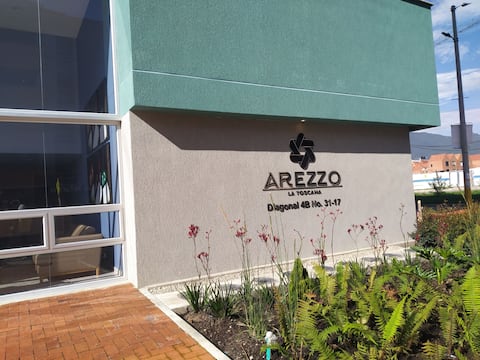
What Do the Top Airbnb Listings in Zipaquirá Look Like?
Benchmark your potential! Explore examples of top-performing Airbnb properties in Zipaquirábased on Trailing Twelve Month (TTM) revenue. Analyze their characteristics, revenue, occupancy rate, and ADR to understand what drives success in this market.
All the best in Zipaquirá
Entire Place • 3 bedrooms
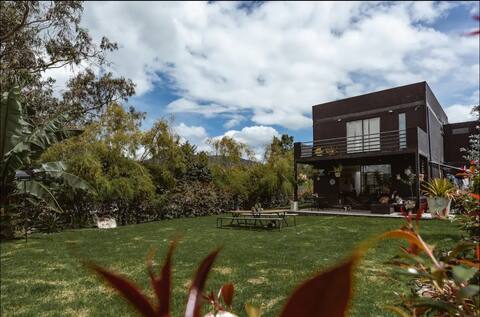
Casa de campo con Turco y tina
Entire Place • 3 bedrooms

Lujoso Apartamento - mejor zona de Zipaquirá
Entire Place • 3 bedrooms

K1 - 10,000 feet
Entire Place • 2 bedrooms
Beautiful apt in the best sector of Zipaquira
Entire Place • 2 bedrooms
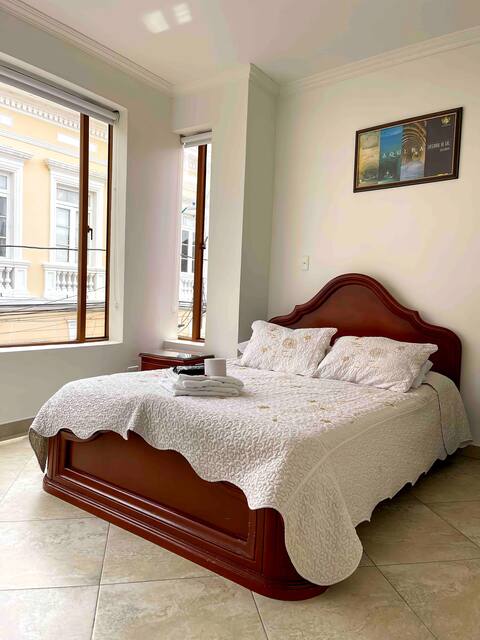
Unmissable Studio - Historic Center View 202 Historic
Entire Place • 1 bedroom
Note: Performance varies based on location, size, amenities, seasonality, and management quality. Data reflects the past 12 months.
Who Are the Top Airbnb Hosts in Zipaquirá?
Learn from the best! This table showcases top-performing Airbnb hosts in Zipaquirá based on the number of properties managed and estimated total revenue over the past year. Analyze their scale and performance metrics.
| Host Name | Properties | Grossing Revenue | Stay Reviews | Avg Rating |
|---|---|---|---|---|
| Diego | 1 | $6,288 | 42 | 4.93/5.0 |
| Host #77772969 | 1 | $5,806 | 2 | Not Rated |
| Arnold | 2 | $5,083 | 166 | 4.77/5.0 |
| Host #15617795 | 1 | $5,025 | 0 | Not Rated |
| Esteban | 1 | $4,705 | 109 | 4.94/5.0 |
| Mercedes | 1 | $3,374 | 9 | 4.89/5.0 |
| Diana | 1 | $2,640 | 51 | 4.94/5.0 |
| Luis Eduardo | 1 | $2,567 | 9 | 5.00/5.0 |
| Edgar | 1 | $2,430 | 31 | 4.94/5.0 |
| Lida Liliana | 2 | $2,368 | 16 | 4.76/5.0 |
Analyzing the strategies of top hosts, such as their property selection, pricing, and guest communication, can offer valuable lessons for optimizing your own Airbnb operations in Zipaquirá.
How Does Zipaquirá's Airbnb Market Compare to Nearby Cities?
How does the Zipaquirá Airbnb market stack up against its neighbors? Compare key performance metrics like average monthly revenue, ADR, and occupancy rates in surrounding areas to understand the broader regional STR landscape.
Compared with San Nicolás, Zipaquirá has 1 percentage points higher occupancy and about $350 lower ADR. That helps frame whether this market is winning more on demand, pricing, or both.
| Market | Active Properties | Monthly Revenue | Daily Rate | Avg. Occupancy |
|---|---|---|---|---|
| Anapoima | 21 | $2,825 | $410.57 | 25% |
| San Nicolás | 26 | $2,366 | $401.36 | 28% |
| Cauca Viejo | 29 | $1,992 | $289.99 | 27% |
| Antioquia | 13 | $1,975 | $320.99 | 27% |
| Apulo | 95 | $1,687 | $273.35 | 24% |
| Córdoba | 25 | $1,497 | $282.94 | 24% |
| Anapoima | 289 | $1,435 | $274.56 | 25% |
| La Peña | 11 | $1,248 | $158.21 | 27% |
| Cundinamarca | 13 | $1,060 | $163.02 | 25% |
| Olaya | 20 | $1,041 | $208.12 | 21% |
Frequently Asked Questions About Airbnb in Zipaquirá
These quick answers summarize the most common investor and operator questions using AirROI's latest market data for Zipaquirá.
How much do Airbnb hosts make in Zipaquirá?
Zipaquirá hosts earn about $2,385 per year on average, with an average nightly rate of $52 and RevPAR of N/A. Those figures describe the typical revenue environment for active listings in Zipaquirá, Cundinamarca, not the ceiling for the best operators. Source: AirROI 2025 data, Zipaquirá market, June 2024 to May 2025.
What is the average Airbnb occupancy rate in Zipaquirá?
The average Airbnb occupancy rate in Zipaquirá is 29.4%. April is the strongest month and August is the softest, so hosts should expect demand to move meaningfully throughout the year rather than stay flat.
What is the average Airbnb daily rate in Zipaquirá?
Listings in Zipaquirá average $52 per night. The broader pricing spread also matters: lower-performing listings cluster closer to the lower quartiles, while premium homes can price materially above the city average when demand spikes or listing quality stands out.
How many Airbnb listings are active in Zipaquirá?
Zipaquirá currently has about 23 active Airbnb listings in AirROI's market dataset. That supply count helps explain how competitive the market is, how much depth there is for benchmarking, and whether the market behaves like a niche destination or a scaled urban market.
How strict are short-term rental regulations in Zipaquirá?
AirROI currently classifies the short-term rental regulation level in Zipaquirá as High. The dataset also shows about 56.5% of listings with registration evidence. That is a market signal, not legal advice, so hosts should still confirm current licensing and compliance rules locally before listing.
What is the RevPAR for Airbnb in Zipaquirá?
RevPAR in Zipaquirá is about N/A. That metric combines pricing and occupancy into one efficiency number, so it is often a better quick benchmark than ADR alone when investors want to compare how well listings convert nightly rates into realized revenue.
Is Airbnb profitable in Zipaquirá?
Occupancy of 29.4% means Zipaquirá is a more selective market. Profitability is achievable but requires careful cost management, premium positioning, or targeting longer stays to reduce turnover. Average annual revenue is $2,385, but individual returns depend on property type, location within the city, and the host's operating efficiency.
How far in advance do guests book Airbnb in Zipaquirá?
The average booking lead time in Zipaquirá is about 20 days — a relatively short booking window, meaning most guests decide within a few weeks of their trip — dynamic pricing can capture late demand. Hosts who understand their market's booking cadence can adjust minimum stays and pricing windows accordingly.
What are the best neighborhoods for Airbnb in Zipaquirá?
Based on AirROI's analysis, some of the top neighborhoods for short-term rentals in Zipaquirá include Catedral de Sal, Plaza de los Comuneros, Cerro de Candelaria. Each area attracts different guest profiles — from business travelers to leisure visitors — so the best location depends on the property type and target audience a host is aiming for. See the full neighborhood breakdown above.
What type of property performs best on Airbnb in Zipaquirá?
entire_home listings make up 87.0% of the active supply in Zipaquirá. The most common configuration does not always mean the most profitable — operators who identify underserved property types or bedroom counts can sometimes outperform the market average by filling a gap in local supply.
How does Zipaquirá compare to nearby Airbnb markets?
Among neighboring markets, Anapoima posts $33,898 in average annual revenue with 25.0% occupancy, compared to Zipaquirá's $2,385 and 29.4%. Comparing nearby markets helps investors understand whether a destination's performance reflects local demand or broader regional trends.
When is the peak season for Airbnb in Zipaquirá?
April is the highest-revenue month in Zipaquirá, while August is the softest. The revenue spread between them indicates moderate seasonality with a clear peak period, giving hosts opportunities to maximize rates during high demand without facing dramatic off-season drops.
About AirROI Market Data
AirROI tracks over 20 million properties across 190+ countries and maintains 15+ years of historical performance data, making it one of the deepest Airbnb and STR intelligence platforms available. The analytics pipeline aggregates listing-level data monthly — revenue, occupancy, nightly rates, RevPAR, guest demographics, booking patterns, and competitive supply — so investors and operators can benchmark any market against its own history and against neighboring destinations.
Real estate investors, property managers, financial institutions, hedge funds, tourism boards, hospitality consultants, tech platforms, and academic researchers rely on AirROI data to underwrite acquisitions, optimize pricing, model macro trends, and conduct peer-reviewed research. Data is available through in-depth market reports like this one and the Airbnb API with 22 endpoints and an Airbnb MCP Server for AI agents.
AirROI proprietary analytics as of 2025-05-31. Metrics reflect trailing twelve-month aggregates from active listings. Revenue figures are market averages, not projections. Neighborhood descriptions are AI-generated and reviewed for accuracy. For full methodology, see the data methodology page.