Uribia Airbnb Market Analysis 2026: Short Term Rental Data & Vacation Rental Statistics in La Guajira, Colombia
Is Airbnb profitable in Uribia in 2026? Explore comprehensive Airbnb analytics for Uribia, La Guajira, Colombia to uncover income potential. This 2026 STR market report for Uribia, based on AirROI data from May 2024 to April 2025, reveals key trends in the niche market of 21 active listings.
Whether you're considering an Airbnb investment in Uribia, optimizing your existing vacation rental, or exploring rental arbitrage opportunities, understanding the Uribia Airbnb data is crucial. Navigating the high regulation landscape is key to maximizing your short term rental income potential. Let's dive into the specifics.
Key Uribia Airbnb Performance Metrics Overview
Monthly Airbnb Revenue Variations & Income Potential in Uribia (2026)
Understanding the monthly revenue variations for Airbnb listings in Uribia is key to maximizing your short term rental income potential. Seasonality significantly impacts earnings. Our analysis, based on data from the past 12 months, shows that the peak revenue month for STRs in Uribia is typically May, while April often presents the lowest earnings, highlighting opportunities for strategic pricing adjustments during shoulder and low seasons. Explore the typical Airbnb income in Uribia across different performance tiers:
- Best-in-class properties (Top 10%) achieve $1,901+ monthly, often utilizing dynamic pricing and superior guest experiences.
- Strong performing properties (Top 25%) earn $532 or more, indicating effective management and desirable locations/amenities.
- Typical properties (Median) generate around $290 per month, representing the average market performance.
- Entry-level properties (Bottom 25%) see earnings around $127, often with potential for optimization.
Average Monthly Airbnb Earnings Trend in Uribia
Uribia Airbnb Occupancy Rate Trends (2026)
Maximize your bookings by understanding the Uribia STR occupancy trends. Seasonal demand shifts significantly influence how often properties are booked. Typically, Novembersees the highest demand (peak season occupancy), while September experiences the lowest (low season). Effective strategies, like adjusting minimum stays or offering promotions, can boost occupancy during slower periods. Here's how different property tiers perform in Uribia:
- Best-in-class properties (Top 10%) achieve 51%+ occupancy, indicating high desirability and potentially optimized availability.
- Strong performing properties (Top 25%) maintain 38% or higher occupancy, suggesting good market fit and guest satisfaction.
- Typical properties (Median) have an occupancy rate around 22%.
- Entry-level properties (Bottom 25%) average 11% occupancy, potentially facing higher vacancy.
Average Monthly Occupancy Rate Trend in Uribia
Average Daily Rate (ADR) Airbnb Trends in Uribia (2026)
Effective short term rental pricing strategy in Uribia involves understanding monthly ADR fluctuations. The Average Daily Rate (ADR) for Airbnb in Uribia typically peaks in July and dips lowest during January. Leveraging Airbnb dynamic pricing tools or strategies based on this seasonality can significantly boost revenue. Here's a look at the typical nightly rates achieved:
- Best-in-class properties (Top 10%) command rates of $60+ per night, often due to premium features or locations.
- Strong performing properties (Top 25%) achieve nightly rates of $41 or more.
- Typical properties (Median) charge around $19 per night.
- Entry-level properties (Bottom 25%) earn around $13 per night.
Average Daily Rate (ADR) Trend by Month in Uribia
Get Live Uribia Market Intelligence 👇
Explore Real-time Analytics
Airbnb Seasonality Analysis & Trends in Uribia (2025)
Peak Season (May, October, September)
- Revenue averages $1,138 per month
- Occupancy rates average 17.8%
- Daily rates average $34
Shoulder Season
- Revenue averages $604 per month
- Occupancy maintains around 34.3%
- Daily rates hold near $33
Low Season (January, February, April)
- Revenue drops to average $141 per month
- Occupancy decreases to average 19.6%
- Daily rates adjust to average $30
Seasonality Insights for Uribia
- The Airbnb seasonality in Uribia shows highly seasonal trends requiring careful strategy. While the sections above show seasonal averages, it's also insightful to look at the extremes:
- During the high season, the absolute peak month showcases Uribia's highest earning potential, with monthly revenues capable of climbing to $1,248, occupancy reaching a high of 62.1%, and ADRs peaking at $35.
- Conversely, the slowest single month of the year, typically falling within the low season, marks the market's lowest point. In this month, revenue might dip to $117, occupancy could drop to 8.3%, and ADRs may adjust down to $30.
- Understanding both the seasonal averages and these monthly peaks and troughs in revenue, occupancy, and ADR is crucial for maximizing your Airbnb profit potential in Uribia.
Seasonal Strategies for Maximizing Profit
- Peak Season: Maximize revenue through premium pricing and potentially longer minimum stays. Ensure high availability.
- Low Season: Offer competitive pricing, special promotions (e.g., extended stay discounts), and flexible cancellation policies. Target off-season travelers like remote workers or budget-conscious guests.
- Shoulder Seasons: Implement dynamic pricing that balances peak and low rates. Target weekend travelers or specific events. Offer slightly more flexible terms than peak season.
- Regularly analyze your own performance against these Uribia seasonality benchmarks and adjust your pricing and availability strategy accordingly.
Best Areas for Airbnb Investment in Uribia (2026)
Exploring the top neighborhoods for short-term rentals in Uribia? This section highlights key areas, outlining why they are attractive for hosts and guests, along with notable local attractions. Consider these locations based on your target guest profile and investment strategy.
| Neighborhood / Area | Why Host Here? (Target Guests & Appeal) | Key Attractions & Landmarks |
|---|---|---|
| Riohacha Beach | A stunning beach destination close to Uribia, Riohacha offers beautiful landscapes and a vibrant local culture. It's perfect for tourists seeking relaxation by the Caribbean Sea. | Riohacha Pier, Cabo de la Vela, Cabo de la Vela beach, Wayuu indigenous culture, Natural pools in the region |
| La Guajira Desert | The unique desert landscape offers adventurous travelers a chance to explore an off-the-beaten-path destination. Perfect for those looking to experience the natural beauty of Colombia. | Punta Gallinas, El Desierto de la Guajira, Cabo de la Vela, Wayuu indigenous communities, Laguna de los Cangrejos |
| Palomino | A little farther from Uribia, Palomino is known for its beautiful beaches and the Sierra Nevada mountains that loom in the background. Ideal for beachgoers and nature lovers. | Palomino Beach, Sierra Nevada mountains, Tayrona National Park, Rio Palomino, Wildlife watching |
| Puerto Estrella | A small paradise known for its relaxing beaches and palm trees, Puerto Estrella is an ideal retreat for families and couples looking for peace and tranquility. | Beach activities, Relaxing atmosphere, Local seafood restaurants, Natural beauty, Wildlife observation |
| Minca | Nestled in the mountains, Minca is a coffee-growing area known for its lush greenery and stunning views. It offers a cooler climate and many eco-friendly tourism options. | Coffee plantations, Hiking trails, Waterfalls, Birdwatching, Scenic viewpoints |
| Tayrona National Park | One of Colombia's most famous natural parks, Tayrona offers pristine beaches, tropical rainforest, and diverse wildlife, attracting nature lovers and adventure seekers. | Beaches, Hiking trails, Cultural heritage, Wildlife diversity, Camping areas |
| Wayuu Communities | Immersing in the Wayuu culture provides tourists a unique and enriching experience through local traditions and crafts. Great for cultural tourism. | Wayuu handicrafts, Local traditions, Cultural interactions, Traditional food, Community experiences |
| Cabo de la Vela | A remote coastal area known for its breathtaking views and rich wayuu culture. It's a hotspot for windsurfing and local cultural interactions. | Kite surfing, Cultural interactions, Beautiful beaches, Sunsets, Natural landscapes |
Understanding Airbnb License Requirements & STR Laws in Uribia (2026)
Yes, Uribia, La Guajira, Colombia enforces high STR regulations. Obtaining a license and ensuring compliance is almost certainly required according to current 2026 STR laws. Always verify the latest short term rental regulations and Airbnb license requirements directly with local government authorities for Uribia to ensure full compliance before hosting.
(Source: AirROI data, 2026, based on 38% licensed listings)
Top Performing Airbnb Properties in Uribia (2026)
Benchmark your potential! Explore examples of top-performing Airbnb properties in Uribiabased on Trailing Twelve Month (TTM) revenue. Analyze their characteristics, revenue, occupancy rate, and ADR to understand what drives success in this market.

NEW, unique, and cozy place located in Uribia
Entire Place • 3 bedrooms

Suite Principal
Private Room • 1 bedroom

Doble de lujo
Private Room • 1 bedroom
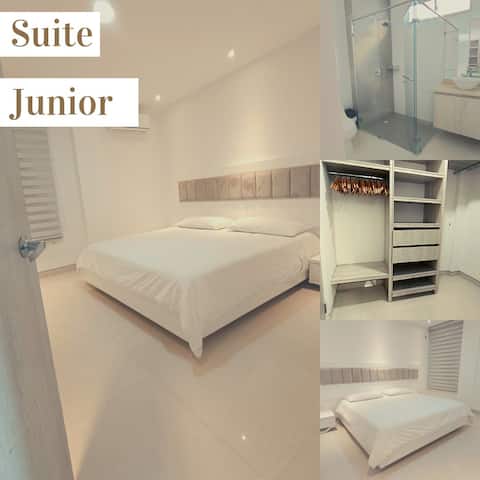
Junior Suite
Private Room • 1 bedroom
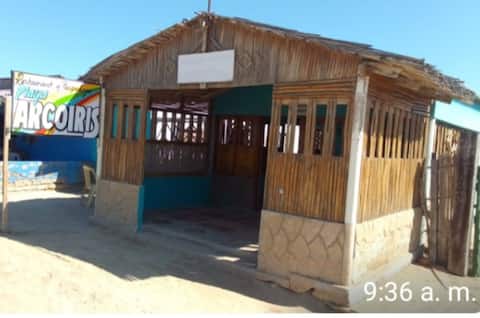
Hospedaje Playa Arcoiris
Private Room • 1 bedroom
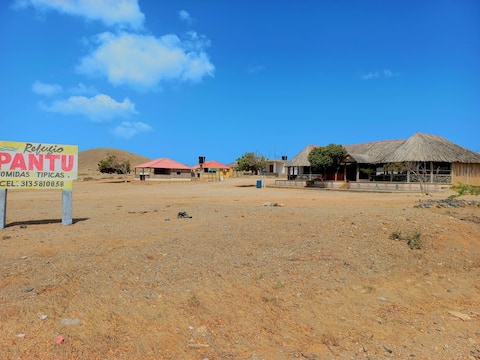
Habitación familiar; Refugio Pantu
Private Room • 1 bedroom
Note: Performance varies based on location, size, amenities, seasonality, and management quality. Data reflects the past 12 months.
Top Performing Airbnb Hosts in Uribia (2026)
Learn from the best! This table showcases top-performing Airbnb hosts in Uribia based on the number of properties managed and estimated total revenue over the past year. Analyze their scale and performance metrics.
| Host Name | Properties | Grossing Revenue | Stay Reviews | Avg Rating |
|---|---|---|---|---|
| Host #247212065 | 3 | $12,911 | 0 | 0.00/5.0 |
| Host #44925077 | 1 | $10,729 | 0 | 0.00/5.0 |
| Host #466446984 | 4 | $7,661 | 1 | 0.00/5.0 |
| Host #380457925 | 1 | $2,676 | 0 | 0.00/5.0 |
| Marlon | 3 | $1,881 | 37 | 2.70/5.0 |
| Hostal | 4 | $1,725 | 86 | 4.55/5.0 |
| Jorge Luis | 1 | $1,398 | 15 | 4.67/5.0 |
| Host #432796371 | 1 | $1,363 | 0 | 0.00/5.0 |
| Host #488480951 | 1 | $1,128 | 0 | 0.00/5.0 |
| Host #471647942 | 1 | $693 | 0 | 0.00/5.0 |
Analyzing the strategies of top hosts, such as their property selection, pricing, and guest communication, can offer valuable lessons for optimizing your own Airbnb operations in Uribia.
Dive Deeper: Advanced Uribia STR Market Data (2026)
Ready to unlock more insights? AirROI provides access to advanced metrics and comprehensive Airbnb data for Uribia. Explore detailed analytics beyond this report to refine your investment strategy, optimize pricing, and maximize your vacation rental profits.
Explore Advanced MetricsUribia Short-Term Rental Market Composition (2026): Property & Room Types
Room Type Distribution
Property Type Distribution
Market Composition Insights for Uribia
- The Uribia Airbnb market composition is heavily skewed towards Private Room listings, which make up 76.2% of the 21 active rentals. This indicates strong guest preference for privacy and space.
- Looking at the property type distribution in Uribia, Hotel/Boutique properties are the most common (42.9%), reflecting the local real estate landscape.
- Houses represent a significant 19% portion, catering likely to families or larger groups.
- The presence of 42.9% Hotel/Boutique listings indicates integration with traditional hospitality.
- Smaller segments like apartment/condo (combined 4.8%) offer potential for unique stay experiences.
Uribia Airbnb Room Capacity Analysis (2026): Bedroom Distribution
Distribution of Listings by Number of Bedrooms
Room Capacity Insights for Uribia
- The dominant room capacity in Uribia is 1 bedroom listings, making up 52.4% of the market. This suggests a strong demand for properties suitable for couples or solo travelers.
- Together, 1 bedroom and 2 bedrooms properties represent 66.7% of the active Airbnb listings in Uribia, indicating a high concentration in these sizes.
- With over half the market (52.4%) consisting of studios or 1-bedroom units, Uribia is particularly well-suited for individuals or couples.
Uribia Vacation Rental Guest Capacity Trends (2026)
Distribution of Listings by Guest Capacity
Guest Capacity Insights for Uribia
- The most common guest capacity trend in Uribia vacation rentals is listings accommodating 2 guests (33.3%). This suggests the primary traveler segment is likely couples or solo travelers.
- Properties designed for 2 guests and 8+ guests dominate the Uribia STR market, accounting for 52.3% of listings.
- 33.3% of properties accommodate 6+ guests, serving the market segment for larger families or group travel in Uribia.
- On average, properties in Uribia are equipped to host 3.8 guests.
Uribia Airbnb Booking Patterns (2026): Available vs. Booked Days
Available Days Distribution
Booked Days Distribution
Booking Pattern Insights for Uribia
- The most common availability pattern in Uribia falls within the 271-366 days range, representing 85.7% of listings. This suggests many properties have significant open periods on their calendars.
- Approximately 100.0% of listings show high availability (181+ days open annually), indicating potential for increased bookings or specific owner usage patterns.
- For booked days, the 31-90 days range is most frequent in Uribia (66.7%), reflecting common guest stay durations or potential owner blocking patterns.
Uribia Airbnb Minimum Stay Requirements Analysis
Distribution of Listings by Minimum Night Requirement
1 Night
18 listings
90% of total
3 Nights
1 listings
5% of total
30+ Nights
1 listings
5% of total
Key Insights
- The most prevalent minimum stay requirement in Uribia is 1 Night, adopted by 90% of listings. This highlights the market's preference for shorter, flexible bookings.
- A strong majority (90.0%) of the Uribia Airbnb data shows acceptance of very short stays (1-2 nights), indicating a dynamic, high-turnover market.
Recommendations
- Align with the market by considering a 1 Night minimum stay, as 90% of Uribia hosts use this setting.
- Adjust minimum nights based on seasonality – potentially shorter during low season and longer during peak demand periods in Uribia.
Uribia Airbnb Cancellation Policy Trends Analysis (2026)
Flexible
4 listings
50% of total
Strict
4 listings
50% of total
Cancellation Policy Insights for Uribia
- The prevailing Airbnb cancellation policy trend in Uribia is Flexible, used by 50% of listings.
- There's a relatively balanced mix between guest-friendly (50.0%) and stricter (50.0%) policies, offering choices for different guest needs.
Recommendations for Hosts
- Consider adopting a Flexible policy to align with the 50% market standard in Uribia.
- With 50% using Strict terms, this is a viable option in Uribia, particularly for high-value properties or during peak demand periods.
- Regularly review your cancellation policy against competitors and market demand shifts in Uribia.
Uribia STR Booking Lead Time Analysis (2026)
Average Booking Lead Time by Month
Booking Lead Time Insights for Uribia
- The overall average booking lead time for vacation rentals in Uribia is 31 days.
- Guests book furthest in advance for stays during May (average 220 days), likely coinciding with peak travel demand or local events.
- The shortest booking windows occur for stays in June (average 3 days), indicating more last-minute travel plans during this time.
- Seasonally, Spring (90 days avg.) sees the longest lead times, while Summer (7 days avg.) has the shortest, reflecting typical travel planning cycles.
Recommendations for Hosts
- Use the overall average lead time (31 days) as a baseline for your pricing and availability strategy in Uribia.
- For May stays, consider implementing length-of-stay discounts or slightly higher rates for bookings made less than 220 days out to capitalize on advance planning.
- During June, focus on last-minute booking availability and promotions, as guests book with very short notice (3 days avg.).
- Target marketing efforts for the Spring season well in advance (at least 90 days) to capture early planners.
- Monitor your own booking lead times against these Uribia averages to identify opportunities for dynamic pricing adjustments.
Popular & Essential Airbnb Amenities in Uribia (2026)
Amenity Prevalence
Amenity Insights for Uribia
- Popular amenities like Free parking on premises, Wifi, Essentials are common but not universal. Offering these can provide a competitive edge.
- Warning: Wifi is not universally provided but is considered essential globally. Ensure reliable Wifi is offered.
Recommendations for Hosts
- Consider adding popular differentiators like Free parking on premises or Wifi to increase appeal.
- Highlight unique or less common amenities you offer (e.g., hot tub, dedicated workspace, EV charger) in your listing description and photos.
- Regularly check competitor amenities in Uribia to stay competitive.
Uribia Airbnb Guest Demographics & Profile Analysis (2026)
Guest Profile Summary for Uribia
- The typical guest profile for Airbnb in Uribia consists of predominantly international visitors (70%), with top international origins including France, typically belonging to the Post-2000s (Gen Z/Alpha) group (50%), primarily speaking English or Spanish.
- Domestic travelers account for 30.0% of guests.
- Key international markets include Colombia (30%) and France (20%).
- Top languages spoken are English (35.5%) followed by Spanish (22.6%).
- A significant demographic segment is the Post-2000s (Gen Z/Alpha) group, representing 50% of guests.
Recommendations for Hosts
- Focus marketing internationally, particularly towards travelers from France.
- Tailor amenities and listing descriptions to appeal to the dominant Post-2000s (Gen Z/Alpha) demographic (e.g., highlight fast WiFi, smart home features, local guides).
- Highlight unique local experiences or amenities relevant to the primary guest profile.
- Consider seasonal promotions aligned with peak travel times for key origin markets.
Nearby Short-Term Rental Market Comparison
How does the Uribia Airbnb market stack up against its neighbors? Compare key performance metrics like average monthly revenue, ADR, and occupancy rates in surrounding areas to understand the broader regional STR landscape.
| Market | Active Properties | Monthly Revenue | Daily Rate | Avg. Occupancy |
|---|---|---|---|---|
| Marquetalia | 11 | $1,186 | $87.41 | 33% |
| Guachaca | 41 | $1,046 | $96.54 | 33% |
| Buritaca | 30 | $852 | $108.34 | 24% |
| Magdalena | 10 | $658 | $53.18 | 30% |
| Dibulla | 319 | $632 | $77.29 | 28% |
| Colinas de Calabazo | 74 | $458 | $91.99 | 23% |
| Riohacha | 187 | $294 | $45.54 | 24% |