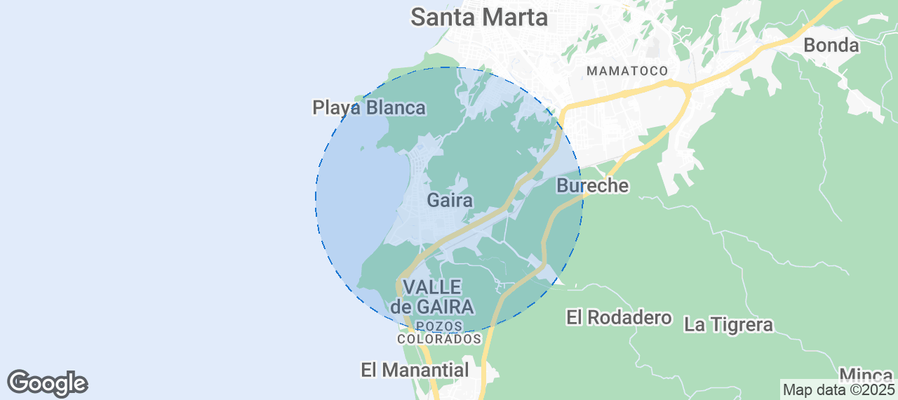
Gaira Airbnb Market Analysis 2026: Short Term Rental Data & Vacation Rental Statistics in Magdalena, Colombia
Is Airbnb profitable in Gaira in 2026? Explore comprehensive Airbnb analytics for Gaira, Magdalena, Colombia to uncover income potential. This 2026 STR market report for Gaira, based on AirROI data from February 2025 to January 2026, reveals key trends in the niche market of 147 active listings.
Whether you're considering an Airbnb investment in Gaira, optimizing your existing vacation rental, or exploring rental arbitrage opportunities, understanding the Gaira Airbnb data is crucial. Navigating the high regulation landscape is key to maximizing your short term rental income potential. Let's dive into the specifics.
Key Gaira Airbnb Performance Metrics Overview
Monthly Airbnb Revenue Variations & Income Potential in Gaira (2026)
Understanding the monthly revenue variations for Airbnb listings in Gaira is key to maximizing your short term rental income potential. Seasonality significantly impacts earnings. Our analysis, based on data from the past 12 months, shows that the peak revenue month for STRs in Gaira is typically January, while May often presents the lowest earnings, highlighting opportunities for strategic pricing adjustments during shoulder and low seasons. Explore the typical Airbnb income in Gaira across different performance tiers:
- Best-in-class properties (Top 10%) achieve $1,594+ monthly, often utilizing dynamic pricing and superior guest experiences.
- Strong performing properties (Top 25%) earn $1,062 or more, indicating effective management and desirable locations/amenities.
- Typical properties (Median) generate around $581 per month, representing the average market performance.
- Entry-level properties (Bottom 25%) see earnings around $279, often with potential for optimization.
Average Monthly Airbnb Earnings Trend in Gaira
Gaira Airbnb Occupancy Rate Trends (2026)
Maximize your bookings by understanding the Gaira STR occupancy trends. Seasonal demand shifts significantly influence how often properties are booked. Typically, Junesees the highest demand (peak season occupancy), while May experiences the lowest (low season). Effective strategies, like adjusting minimum stays or offering promotions, can boost occupancy during slower periods. Here's how different property tiers perform in Gaira:
- Best-in-class properties (Top 10%) achieve 69%+ occupancy, indicating high desirability and potentially optimized availability.
- Strong performing properties (Top 25%) maintain 54% or higher occupancy, suggesting good market fit and guest satisfaction.
- Typical properties (Median) have an occupancy rate around 35%.
- Entry-level properties (Bottom 25%) average 17% occupancy, potentially facing higher vacancy.
Average Monthly Occupancy Rate Trend in Gaira
Average Daily Rate (ADR) Airbnb Trends in Gaira (2026)
Effective short term rental pricing strategy in Gaira involves understanding monthly ADR fluctuations. The Average Daily Rate (ADR) for Airbnb in Gaira typically peaks in January and dips lowest during August. Leveraging Airbnb dynamic pricing tools or strategies based on this seasonality can significantly boost revenue. Here's a look at the typical nightly rates achieved:
- Best-in-class properties (Top 10%) command rates of $112+ per night, often due to premium features or locations.
- Strong performing properties (Top 25%) achieve nightly rates of $84 or more.
- Typical properties (Median) charge around $62 per night.
- Entry-level properties (Bottom 25%) earn around $41 per night.
Average Daily Rate (ADR) Trend by Month in Gaira
Get Live Gaira Market Intelligence 👇
Explore Real-time Analytics
Airbnb Seasonality Analysis & Trends in Gaira (2026)
Peak Season (January, June, December)
- Revenue averages $1,043 per month
- Occupancy rates average 41.7%
- Daily rates average $79
Shoulder Season
- Revenue averages $633 per month
- Occupancy maintains around 34.6%
- Daily rates hold near $64
Low Season (February, March, April)
- Revenue drops to average $0 per month
- Occupancy decreases to average 0.0%
- Daily rates adjust to average $66
Seasonality Insights for Gaira
- The Airbnb seasonality in Gaira shows highly seasonal trends requiring careful strategy. While the sections above show seasonal averages, it's also insightful to look at the extremes:
- During the high season, the absolute peak month showcases Gaira's highest earning potential, with monthly revenues capable of climbing to $1,106, occupancy reaching a high of 50.9%, and ADRs peaking at $86.
- Conversely, the slowest single month of the year, typically falling within the low season, marks the market's lowest point. In this month, revenue might dip to $0, occupancy could drop to 0.0%, and ADRs may adjust down to $56.
- Understanding both the seasonal averages and these monthly peaks and troughs in revenue, occupancy, and ADR is crucial for maximizing your Airbnb profit potential in Gaira.
Seasonal Strategies for Maximizing Profit
- Peak Season: Maximize revenue through premium pricing and potentially longer minimum stays. Ensure high availability.
- Low Season: Offer competitive pricing, special promotions (e.g., extended stay discounts), and flexible cancellation policies. Target off-season travelers like remote workers or budget-conscious guests.
- Shoulder Seasons: Implement dynamic pricing that balances peak and low rates. Target weekend travelers or specific events. Offer slightly more flexible terms than peak season.
- Regularly analyze your own performance against these Gaira seasonality benchmarks and adjust your pricing and availability strategy accordingly.
Best Areas for Airbnb Investment in Gaira (2026)
Exploring the top neighborhoods for short-term rentals in Gaira? This section highlights key areas, outlining why they are attractive for hosts and guests, along with notable local attractions. Consider these locations based on your target guest profile and investment strategy.
| Neighborhood / Area | Why Host Here? (Target Guests & Appeal) | Key Attractions & Landmarks |
|---|---|---|
| La Playa | A beautiful beachfront area known for its stunning views and relaxed atmosphere. It's ideal for families and tourists seeking sun, sea, and sand. | Playa de Gaira, La Kodak, Parque de los Novios, Palace of the Caribbean, Ciudades de Plata |
| Taganga | A charming fishing village popular for diving and water sports. Attracts backpackers and adventure seekers looking for an authentic coastal experience. | Taganga Beach, Diving and snorkeling spots, Natural Park Tayrona, Santa Marta Bay, Local seafood restaurants |
| Rodadero | A lively tourist district known for its vibrant nightlife and family-friendly beaches. It’s a hub for visitors looking for entertainment and relaxation by the sea. | Rodadero Beach, Acuario Rodadero, Playa Blanca, Nightclubs and bars, Shopping mall of Rodadero |
| Centro Historico | The historic center of Santa Marta rich in culture and colonial architecture. Perfect for tourists interested in history and local culture. | Cathedral of Santa Marta, Parque de los Novios, Museo del Oro, Santa Marta Marina, Teatro Santa Marta |
| Bonda | A tranquil area close to nature and the Sierra Nevada mountains. It appeals to those looking for eco-tourism and outdoor activities. | Rio Bonda, Hiking trails, Coffee plantations, Natural reserves, Cultural experience with locals |
| Minca | Located in the hills above Santa Marta, Minca is known for its cooler climate and lush nature. Popular with eco-tourists and those seeking a retreat. | Pozo Azul, Minca Coffee Farm, Waterfalls, Hiking trails, Birdwatching |
| El Rodadero Bajo | A quieter section of Rodadero, offering a more local atmosphere while still close to the beach. Ideal for those looking for a more relaxed stay. | Rodadero Beach, Local markets, Water sports, Scenic views, Sandy beach access |
| La Cienaga | A laid-back area known for its natural beauty and proximity to the lagoon. Suitable for those wanting to escape the tourist hustle. | La Cienaga de Santa Marta, Birdwatching, Fishing, Nature walks, Tranquil environment |
Understanding Airbnb License Requirements & STR Laws in Gaira (2026)
Yes, Gaira, Magdalena, Colombia enforces high STR regulations. Obtaining a license and ensuring compliance is almost certainly required according to current 2026 STR laws. Always verify the latest short term rental regulations and Airbnb license requirements directly with local government authorities for Gaira to ensure full compliance before hosting.
(Source: AirROI data, 2026, based on 95% licensed listings)
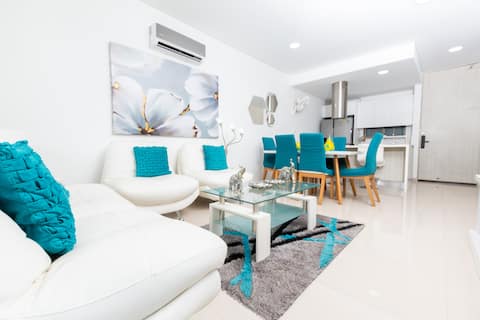
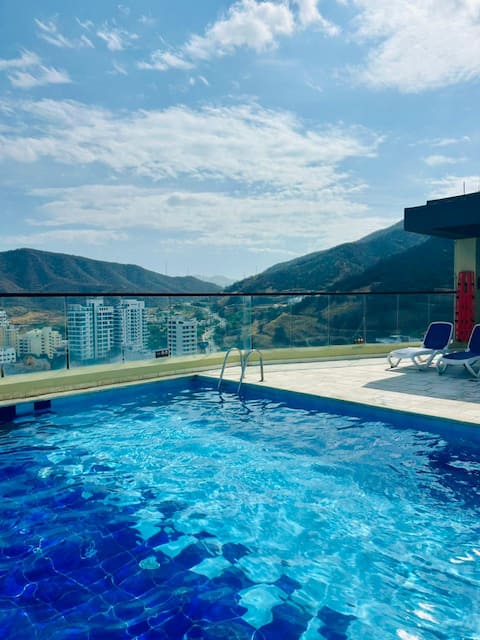
Top Performing Airbnb Properties in Gaira (2026)
Benchmark your potential! Explore examples of top-performing Airbnb properties in Gairabased on Trailing Twelve Month (TTM) revenue. Analyze their characteristics, revenue, occupancy rate, and ADR to understand what drives success in this market.

Spectacular Penthouse with Jacuzzi and Ocean View
Entire Place • 3 bedrooms
Samaria Beach Club - Oceanview
Entire Place • 3 bedrooms

Samaria Top Penthouse.
Entire Place • 3 bedrooms

Beautiful Samaria Club 136 Ocean View Apartment
Entire Place • 2 bedrooms

Oceanfront with a nice view
Entire Place • 4 bedrooms
Rodadero VITA 945 Apartment with Ocean View 148
Entire Place • 2 bedrooms
Note: Performance varies based on location, size, amenities, seasonality, and management quality. Data reflects the past 12 months.
Top Performing Airbnb Hosts in Gaira (2026)
Learn from the best! This table showcases top-performing Airbnb hosts in Gaira based on the number of properties managed and estimated total revenue over the past year. Analyze their scale and performance metrics.
| Host Name | Properties | Grossing Revenue | Stay Reviews | Avg Rating |
|---|---|---|---|---|
| Daniela | 7 | $61,478 | 48 | 4.41/5.0 |
| Angelica | 12 | $49,293 | 124 | 4.77/5.0 |
| AR Rentals - Cortas Estadías | 2 | $39,823 | 25 | 4.92/5.0 |
| Angela Maria | 7 | $33,411 | 292 | 4.12/5.0 |
| Albert | 1 | $26,011 | 18 | 4.83/5.0 |
| Sandra | 4 | $25,774 | 51 | 4.65/5.0 |
| Catrina | 3 | $24,554 | 34 | 4.99/5.0 |
| Omar | 3 | $24,324 | 26 | 4.60/5.0 |
| Jose | 1 | $22,850 | 5 | 5.00/5.0 |
| Danp | 5 | $22,324 | 18 | 4.57/5.0 |
Analyzing the strategies of top hosts, such as their property selection, pricing, and guest communication, can offer valuable lessons for optimizing your own Airbnb operations in Gaira.
Dive Deeper: Advanced Gaira STR Market Data (2026)
Ready to unlock more insights? AirROI provides access to advanced metrics and comprehensive Airbnb data for Gaira. Explore detailed analytics beyond this report to refine your investment strategy, optimize pricing, and maximize your vacation rental profits.
Explore Advanced MetricsGaira Short-Term Rental Market Composition (2026): Property & Room Types
Room Type Distribution
Property Type Distribution
Market Composition Insights for Gaira
- The Gaira Airbnb market composition is heavily skewed towards Entire Home/Apt listings, which make up 90.5% of the 147 active rentals. This indicates strong guest preference for privacy and space.
- Looking at the property type distribution in Gaira, Apartment/Condo properties are the most common (92.5%), reflecting the local real estate landscape.
- Smaller segments like hotel/boutique, house (combined 7.5%) offer potential for unique stay experiences.
Gaira Airbnb Room Capacity Analysis (2026): Bedroom Distribution
Distribution of Listings by Number of Bedrooms
Room Capacity Insights for Gaira
- The dominant room capacity in Gaira is 2 bedrooms listings, making up 36.7% of the market. This suggests a strong demand for properties suitable for couples or solo travelers.
- Together, 2 bedrooms and 1 bedroom properties represent 70.0% of the active Airbnb listings in Gaira, indicating a high concentration in these sizes.
Gaira Vacation Rental Guest Capacity Trends (2026)
Distribution of Listings by Guest Capacity
Guest Capacity Insights for Gaira
- The most common guest capacity trend in Gaira vacation rentals is listings accommodating 4 guests (26.5%). This suggests the primary traveler segment is likely small families or groups.
- Properties designed for 4 guests and 8+ guests dominate the Gaira STR market, accounting for 48.3% of listings.
- 46.9% of properties accommodate 6+ guests, serving the market segment for larger families or group travel in Gaira.
- On average, properties in Gaira are equipped to host 5.1 guests.
Gaira Airbnb Booking Patterns (2026): Available vs. Booked Days
Available Days Distribution
Booked Days Distribution
Booking Pattern Insights for Gaira
- The most common availability pattern in Gaira falls within the 271-366 days range, representing 59.9% of listings. This suggests many properties have significant open periods on their calendars.
- Approximately 97.3% of listings show high availability (181+ days open annually), indicating potential for increased bookings or specific owner usage patterns.
- For booked days, the 31-90 days range is most frequent in Gaira (40.1%), reflecting common guest stay durations or potential owner blocking patterns.
- A notable 2.7% of properties secure long booking periods (181+ days booked per year), highlighting successful long-term rental strategies or significant owner usage.
Gaira Airbnb Minimum Stay Requirements Analysis
Distribution of Listings by Minimum Night Requirement
1 Night
41 listings
27.9% of total
2 Nights
54 listings
36.7% of total
3 Nights
5 listings
3.4% of total
7-29 Nights
2 listings
1.4% of total
30+ Nights
45 listings
30.6% of total
Key Insights
- The most prevalent minimum stay requirement in Gaira is 2 Nights, adopted by 36.7% of listings. This highlights the market's preference for shorter, flexible bookings.
- A strong majority (64.6%) of the Gaira Airbnb data shows acceptance of very short stays (1-2 nights), indicating a dynamic, high-turnover market.
- A significant segment (30.6%) caters to monthly stays (30+ nights) in Gaira, pointing to opportunities in the extended-stay market.
Recommendations
- Align with the market by considering a 2 Nights minimum stay, as 36.7% of Gaira hosts use this setting.
- If feasible, allowing 1-night stays, especially midweek or during low season, could capture last-minute bookings, as only 27.9% currently do.
- Explore offering discounts for stays of 30+ nights to attract the 30.6% of the market seeking extended stays.
- Adjust minimum nights based on seasonality – potentially shorter during low season and longer during peak demand periods in Gaira.
Gaira Airbnb Cancellation Policy Trends Analysis (2026)
Limited
19 listings
12.9% of total
Flexible
55 listings
37.4% of total
Moderate
35 listings
23.8% of total
Firm
33 listings
22.4% of total
Strict
5 listings
3.4% of total
Cancellation Policy Insights for Gaira
- The prevailing Airbnb cancellation policy trend in Gaira is Flexible, used by 37.4% of listings.
- There's a relatively balanced mix between guest-friendly (61.2%) and stricter (25.8%) policies, offering choices for different guest needs.
- Strict cancellation policies are quite rare (3.4%), potentially making listings with this policy less competitive unless justified by high demand or property type.
Recommendations for Hosts
- Consider adopting a Flexible policy to align with the 37.4% market standard in Gaira.
- Using a Strict policy might deter some guests, as only 3.4% of listings use it. Evaluate if potential revenue protection outweighs possible lower booking rates.
- Regularly review your cancellation policy against competitors and market demand shifts in Gaira.
Gaira STR Booking Lead Time Analysis (2026)
Average Booking Lead Time by Month
Booking Lead Time Insights for Gaira
- The overall average booking lead time for vacation rentals in Gaira is 28 days.
- Guests book furthest in advance for stays during January (average 36 days), likely coinciding with peak travel demand or local events.
- The shortest booking windows occur for stays in April (average 0 days), indicating more last-minute travel plans during this time.
- Seasonally, Fall (33 days avg.) sees the longest lead times, while Spring (1 days avg.) has the shortest, reflecting typical travel planning cycles.
Recommendations for Hosts
- Use the overall average lead time (28 days) as a baseline for your pricing and availability strategy in Gaira.
- During April, focus on last-minute booking availability and promotions, as guests book with very short notice (0 days avg.).
- Target marketing efforts for the Fall season well in advance (at least 33 days) to capture early planners.
- Monitor your own booking lead times against these Gaira averages to identify opportunities for dynamic pricing adjustments.
Popular & Essential Airbnb Amenities in Gaira (2026)
Amenity Prevalence
Amenity Insights for Gaira
- Essential amenities in Gaira that guests expect include: Air conditioning, TV, Wifi, Kitchen. Lacking these (any) could significantly impact bookings.
- Popular amenities like Cooking basics, Free parking on premises, Dishes and silverware are common but not universal. Offering these can provide a competitive edge.
Recommendations for Hosts
- Ensure your listing includes all essential amenities for Gaira: Air conditioning, TV, Wifi, Kitchen.
- Prioritize adding missing essentials: Air conditioning, TV, Wifi, Kitchen.
- Consider adding popular differentiators like Cooking basics or Free parking on premises to increase appeal.
- Highlight unique or less common amenities you offer (e.g., hot tub, dedicated workspace, EV charger) in your listing description and photos.
- Regularly check competitor amenities in Gaira to stay competitive.
Gaira Airbnb Guest Demographics & Profile Analysis (2026)
Guest Profile Summary for Gaira
- The typical guest profile for Airbnb in Gaira consists of primarily domestic travelers (70%), often arriving from nearby Bogotá, typically belonging to the Post-2000s (Gen Z/Alpha) group (50%), primarily speaking Spanish or English.
- Domestic travelers account for 70.4% of guests.
- Key international markets include Colombia (70.4%) and United States (10.1%).
- Top languages spoken are Spanish (52.2%) followed by English (34.9%).
- A significant demographic segment is the Post-2000s (Gen Z/Alpha) group, representing 50% of guests.
Recommendations for Hosts
- Target domestic marketing efforts towards travelers from Bogotá and Bogota.
- Tailor amenities and listing descriptions to appeal to the dominant Post-2000s (Gen Z/Alpha) demographic (e.g., highlight fast WiFi, smart home features, local guides).
- Highlight unique local experiences or amenities relevant to the primary guest profile.
- Consider seasonal promotions aligned with peak travel times for key origin markets.
Nearby Short-Term Rental Market Comparison
How does the Gaira Airbnb market stack up against its neighbors? Compare key performance metrics like average monthly revenue, ADR, and occupancy rates in surrounding areas to understand the broader regional STR landscape.
| Market | Active Properties | Monthly Revenue | Daily Rate | Avg. Occupancy |
|---|---|---|---|---|
| El Pueblito | 37 | $1,723 | $454.65 | 20% |
| Cartagena | 7,862 | $1,497 | $153.84 | 40% |
| Marquetalia | 10 | $1,011 | $93.30 | 33% |
| Provincia de Cartagena | 25 | $943 | $136.60 | 31% |
| Sabanilla | 16 | $905 | $194.05 | 19% |
| Guachaca | 34 | $818 | $118.47 | 29% |
| Manzanillo del Mar | 29 | $790 | $110.84 | 34% |
| Juan de Acosta | 21 | $769 | $205.60 | 20% |
| Palomino | 12 | $728 | $116.43 | 31% |
| Salinas Del Rey | 16 | $669 | $195.33 | 21% |