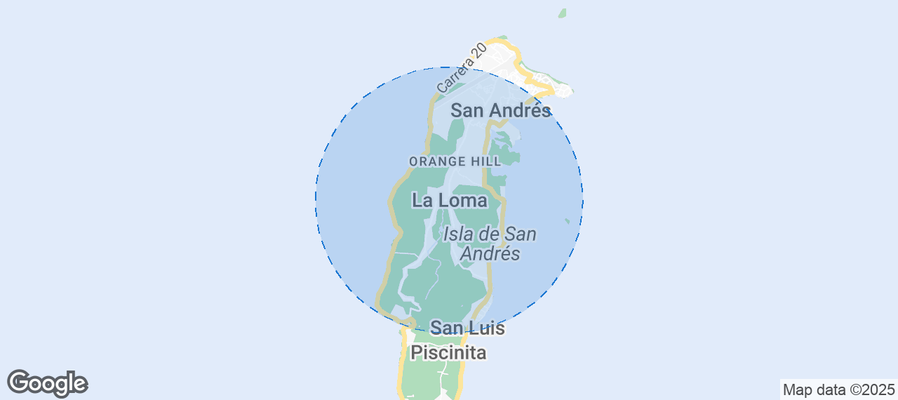
La Loma Airbnb Market Analysis 2026: Short Term Rental Data & Vacation Rental Statistics in San Andrés and Providencia, Colombia
Is Airbnb profitable in La Loma in 2026? Explore comprehensive Airbnb analytics for La Loma, San Andrés and Providencia, Colombia to uncover income potential. This 2026 STR market report for La Loma, based on AirROI data from February 2025 to January 2026, reveals key trends in the niche market of 21 active listings.
Whether you're considering an Airbnb investment in La Loma, optimizing your existing vacation rental, or exploring rental arbitrage opportunities, understanding the La Loma Airbnb data is crucial. Navigating the high regulation landscape is key to maximizing your short term rental income potential. Let's dive into the specifics.
Key La Loma Airbnb Performance Metrics Overview
Monthly Airbnb Revenue Variations & Income Potential in La Loma (2026)
Understanding the monthly revenue variations for Airbnb listings in La Loma is key to maximizing your short term rental income potential. Seasonality significantly impacts earnings. Our analysis, based on data from the past 12 months, shows that the peak revenue month for STRs in La Loma is typically January, while November often presents the lowest earnings, highlighting opportunities for strategic pricing adjustments during shoulder and low seasons. Explore the typical Airbnb income in La Loma across different performance tiers:
- Best-in-class properties (Top 10%) achieve $786+ monthly, often utilizing dynamic pricing and superior guest experiences.
- Strong performing properties (Top 25%) earn $392 or more, indicating effective management and desirable locations/amenities.
- Typical properties (Median) generate around $205 per month, representing the average market performance.
- Entry-level properties (Bottom 25%) see earnings around $130, often with potential for optimization.
Average Monthly Airbnb Earnings Trend in La Loma
La Loma Airbnb Occupancy Rate Trends (2026)
Maximize your bookings by understanding the La Loma STR occupancy trends. Seasonal demand shifts significantly influence how often properties are booked. Typically, Februarysees the highest demand (peak season occupancy), while November experiences the lowest (low season). Effective strategies, like adjusting minimum stays or offering promotions, can boost occupancy during slower periods. Here's how different property tiers perform in La Loma:
- Best-in-class properties (Top 10%) achieve 55%+ occupancy, indicating high desirability and potentially optimized availability.
- Strong performing properties (Top 25%) maintain 36% or higher occupancy, suggesting good market fit and guest satisfaction.
- Typical properties (Median) have an occupancy rate around 23%.
- Entry-level properties (Bottom 25%) average 14% occupancy, potentially facing higher vacancy.
Average Monthly Occupancy Rate Trend in La Loma
Average Daily Rate (ADR) Airbnb Trends in La Loma (2026)
Effective short term rental pricing strategy in La Loma involves understanding monthly ADR fluctuations. The Average Daily Rate (ADR) for Airbnb in La Loma typically peaks in January and dips lowest during March. Leveraging Airbnb dynamic pricing tools or strategies based on this seasonality can significantly boost revenue. Here's a look at the typical nightly rates achieved:
- Best-in-class properties (Top 10%) command rates of $67+ per night, often due to premium features or locations.
- Strong performing properties (Top 25%) achieve nightly rates of $51 or more.
- Typical properties (Median) charge around $35 per night.
- Entry-level properties (Bottom 25%) earn around $24 per night.
Average Daily Rate (ADR) Trend by Month in La Loma
Get Live La Loma Market Intelligence 👇
Explore Real-time Analytics
Airbnb Seasonality Analysis & Trends in La Loma (2026)
Peak Season (January, October, December)
- Revenue averages $478 per month
- Occupancy rates average 31.6%
- Daily rates average $43
Shoulder Season
- Revenue averages $308 per month
- Occupancy maintains around 30.6%
- Daily rates hold near $38
Low Season (July, September, November)
- Revenue drops to average $188 per month
- Occupancy decreases to average 19.0%
- Daily rates adjust to average $40
Seasonality Insights for La Loma
- The Airbnb seasonality in La Loma shows highly seasonal trends requiring careful strategy. While the sections above show seasonal averages, it's also insightful to look at the extremes:
- During the high season, the absolute peak month showcases La Loma's highest earning potential, with monthly revenues capable of climbing to $558, occupancy reaching a high of 39.6%, and ADRs peaking at $43.
- Conversely, the slowest single month of the year, typically falling within the low season, marks the market's lowest point. In this month, revenue might dip to $106, occupancy could drop to 13.3%, and ADRs may adjust down to $37.
- Understanding both the seasonal averages and these monthly peaks and troughs in revenue, occupancy, and ADR is crucial for maximizing your Airbnb profit potential in La Loma.
Seasonal Strategies for Maximizing Profit
- Peak Season: Maximize revenue through premium pricing and potentially longer minimum stays. Ensure high availability.
- Low Season: Offer competitive pricing, special promotions (e.g., extended stay discounts), and flexible cancellation policies. Target off-season travelers like remote workers or budget-conscious guests.
- Shoulder Seasons: Implement dynamic pricing that balances peak and low rates. Target weekend travelers or specific events. Offer slightly more flexible terms than peak season.
- Regularly analyze your own performance against these La Loma seasonality benchmarks and adjust your pricing and availability strategy accordingly.
Best Areas for Airbnb Investment in La Loma (2026)
Exploring the top neighborhoods for short-term rentals in La Loma? This section highlights key areas, outlining why they are attractive for hosts and guests, along with notable local attractions. Consider these locations based on your target guest profile and investment strategy.
| Neighborhood / Area | Why Host Here? (Target Guests & Appeal) | Key Attractions & Landmarks |
|---|---|---|
| San Andrés Island Center | The vibrant heart of San Andrés, offering stunning beaches, shopping, and nightlife. A prime spot for tourists looking to enjoy the island's culture and attractions. | Spratt Bight Beach, Johnny Cay, Cayo Acuario, Island Shopping Center, San Andres Lookout |
| Providencia Island | A serene and less commercialized alternative to San Andrés, known for its natural beauty and tranquility. Attracts travelers seeking a peaceful escape in a picturesque setting. | Big Pond, Cayo Cangrejo, South West Bay, Manta Rota Beach, Manzanillo Beach |
| Rocky Cay | Famous for its stunning beaches and clear waters, this area attracts visitors for its natural beauty and recreational activities. Ideal for those interested in water sports and relaxation. | Rocky Cay Beach, La Piscinita, Cayo Sucre, Cayo Bolivar, East Side Beach |
| West View | Known for its calm waters and snorkeling opportunities, West View is perfect for families and adventure seekers alike. Offers a more local experience away from the bustling tourist spots. | West View Beach, Casa Museo Isleña, Snorkeling spots, Natural swimming pools, Cultural tours |
| South West Bay | A quieter beach area on Providencia, perfect for those looking for escape and relaxation. Ideal for couples and nature lovers who want to enjoy the island's unspoiled beauty. | South West Bay Beach, Horseback riding, Trekking trails, Local eateries, Bird watching |
| Johnny Cay | A small private island off San Andrés, known for its white sandy beaches and turquoise waters. Perfect for day trips and enjoying a slice of paradise. | Johnny Cay Beach, Snorkeling, Palm trees, Local seafood, Relaxation spots |
| El Cove | A charming area located away from the main tourist attractions, offering a more intimate experience with local culture. A hidden gem for those who want to explore local life. | Cove Beach, Local markets, Cultural experiences, Sunset views, Fishing spots |
| Beautiful Beaches | Characteristic of the entire San Andrés and Providencia region, these scenic locations are perfect for hosting travelers looking to unwind and enjoy stunning natural surroundings. | Bounty Beach, La Loma Beach, Coastal paths, Natural parks, Historical sites |
Understanding Airbnb License Requirements & STR Laws in La Loma (2026)
Yes, La Loma, San Andrés and Providencia, Colombia enforces high STR regulations. Obtaining a license and ensuring compliance is almost certainly required according to current 2026 STR laws. Always verify the latest short term rental regulations and Airbnb license requirements directly with local government authorities for La Loma to ensure full compliance before hosting.
(Source: AirROI data, 2026, based on 100% licensed listings)
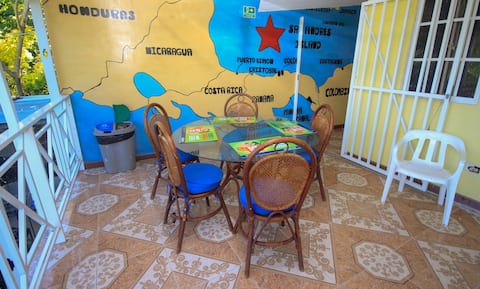
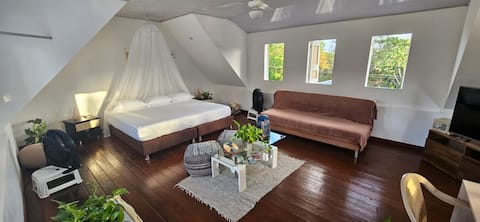
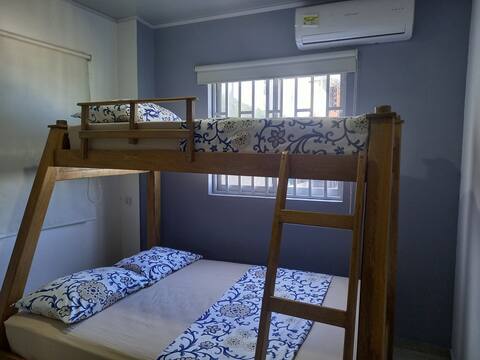
Top Performing Airbnb Properties in La Loma (2026)
Benchmark your potential! Explore examples of top-performing Airbnb properties in La Lomabased on Trailing Twelve Month (TTM) revenue. Analyze their characteristics, revenue, occupancy rate, and ADR to understand what drives success in this market.

comfort 2
Entire Place • 4 bedrooms

Beautiful apartment Our island for 2
Entire Place • 1 bedroom
Posada Nativa Derma's Inn (6)
Private Room • N/A
House of the sun(attic space) IG:@houseofthesunadz
Private Room • N/A

Cove Hill Paradise
Entire Place • 2 bedrooms
Beautiful apartment "Island dreamers" for 5
Entire Place • 2 bedrooms
Note: Performance varies based on location, size, amenities, seasonality, and management quality. Data reflects the past 12 months.
Top Performing Airbnb Hosts in La Loma (2026)
Learn from the best! This table showcases top-performing Airbnb hosts in La Loma based on the number of properties managed and estimated total revenue over the past year. Analyze their scale and performance metrics.
| Host Name | Properties | Grossing Revenue | Stay Reviews | Avg Rating |
|---|---|---|---|---|
| Maria Clemencia | 3 | $13,377 | 29 | 4.93/5.0 |
| Luz | 2 | $7,845 | 47 | 4.93/5.0 |
| Janeth | 3 | $3,820 | 38 | 4.91/5.0 |
| Martha | 2 | $3,162 | 255 | 4.86/5.0 |
| Efi | 1 | $2,664 | 9 | 5.00/5.0 |
| Mel | 1 | $1,150 | 109 | 4.92/5.0 |
| Luisa Fernanda | 1 | $1,119 | 18 | 4.56/5.0 |
| Elvira | 1 | $1,022 | 42 | 4.74/5.0 |
| Alejandro | 1 | $909 | 12 | 5.00/5.0 |
| Garland | 1 | $735 | 1 | Not Rated |
Analyzing the strategies of top hosts, such as their property selection, pricing, and guest communication, can offer valuable lessons for optimizing your own Airbnb operations in La Loma.
Dive Deeper: Advanced La Loma STR Market Data (2026)
Ready to unlock more insights? AirROI provides access to advanced metrics and comprehensive Airbnb data for La Loma. Explore detailed analytics beyond this report to refine your investment strategy, optimize pricing, and maximize your vacation rental profits.
Explore Advanced MetricsLa Loma Short-Term Rental Market Composition (2026): Property & Room Types
Room Type Distribution
Property Type Distribution
Market Composition Insights for La Loma
- The La Loma Airbnb market composition is heavily skewed towards Private Room listings, which make up 61.9% of the 21 active rentals. This indicates strong guest preference for privacy and space.
- Looking at the property type distribution in La Loma, House properties are the most common (42.9%), reflecting the local real estate landscape.
- Houses represent a significant 42.9% portion, catering likely to families or larger groups.
- The presence of 19% Hotel/Boutique listings indicates integration with traditional hospitality.
La Loma Airbnb Room Capacity Analysis (2026): Bedroom Distribution
Distribution of Listings by Number of Bedrooms
Room Capacity Insights for La Loma
- The dominant room capacity in La Loma is 1 bedroom listings, making up 38.1% of the market. This suggests a strong demand for properties suitable for couples or solo travelers.
- Together, 1 bedroom and 2 bedrooms properties represent 52.4% of the active Airbnb listings in La Loma, indicating a high concentration in these sizes.
- Listings with 3+ bedrooms (9.6%) represent a smaller niche, potentially indicating an underserved market for larger group accommodations in La Loma.
La Loma Vacation Rental Guest Capacity Trends (2026)
Distribution of Listings by Guest Capacity
Guest Capacity Insights for La Loma
- The most common guest capacity trend in La Loma vacation rentals is listings accommodating 5 guests (19%). This suggests the primary traveler segment is likely larger groups.
- Properties designed for 5 guests and 2 guests dominate the La Loma STR market, accounting for 33.3% of listings.
- On average, properties in La Loma are equipped to host 2.5 guests.
La Loma Airbnb Booking Patterns (2026): Available vs. Booked Days
Available Days Distribution
Booked Days Distribution
Booking Pattern Insights for La Loma
- The most common availability pattern in La Loma falls within the 271-366 days range, representing 81% of listings. This suggests many properties have significant open periods on their calendars.
- Approximately 100.0% of listings show high availability (181+ days open annually), indicating potential for increased bookings or specific owner usage patterns.
- For booked days, the 1-30 days range is most frequent in La Loma (57.1%), reflecting common guest stay durations or potential owner blocking patterns.
- A notable 4.8% of properties secure long booking periods (181+ days booked per year), highlighting successful long-term rental strategies or significant owner usage.
La Loma Airbnb Minimum Stay Requirements Analysis
Distribution of Listings by Minimum Night Requirement
1 Night
4 listings
19% of total
2 Nights
12 listings
57.1% of total
3 Nights
3 listings
14.3% of total
30+ Nights
2 listings
9.5% of total
Key Insights
- The most prevalent minimum stay requirement in La Loma is 2 Nights, adopted by 57.1% of listings. This highlights the market's preference for shorter, flexible bookings.
- A strong majority (76.1%) of the La Loma Airbnb data shows acceptance of very short stays (1-2 nights), indicating a dynamic, high-turnover market.
Recommendations
- Align with the market by considering a 2 Nights minimum stay, as 57.1% of La Loma hosts use this setting.
- If feasible, allowing 1-night stays, especially midweek or during low season, could capture last-minute bookings, as only 19% currently do.
- A 2-night minimum appears standard (57.1%). Consider this for weekends or peak periods.
- Explore offering discounts for stays of 30+ nights to attract the 9.5% of the market seeking extended stays.
- Adjust minimum nights based on seasonality – potentially shorter during low season and longer during peak demand periods in La Loma.
La Loma Airbnb Cancellation Policy Trends Analysis (2026)
Flexible
14 listings
66.7% of total
Moderate
4 listings
19% of total
Firm
3 listings
14.3% of total
Cancellation Policy Insights for La Loma
- The prevailing Airbnb cancellation policy trend in La Loma is Flexible, used by 66.7% of listings.
- The market strongly favors guest-friendly terms, with 85.7% of listings offering Flexible or Moderate policies. This suggests guests in La Loma may expect booking flexibility.
Recommendations for Hosts
- Consider adopting a Flexible policy to align with the 66.7% market standard in La Loma.
- Given the high prevalence of Flexible policies (66.7%), offering this can enhance booking appeal, especially during shoulder seasons.
- Regularly review your cancellation policy against competitors and market demand shifts in La Loma.
La Loma STR Booking Lead Time Analysis (2026)
Average Booking Lead Time by Month
Booking Lead Time Insights for La Loma
- The overall average booking lead time for vacation rentals in La Loma is 26 days.
- Guests book furthest in advance for stays during August (average 53 days), likely coinciding with peak travel demand or local events.
- The shortest booking windows occur for stays in July (average 7 days), indicating more last-minute travel plans during this time.
- Seasonally, Summer (23 days avg.) sees the longest lead times, while Spring (16 days avg.) has the shortest, reflecting typical travel planning cycles.
Recommendations for Hosts
- Use the overall average lead time (26 days) as a baseline for your pricing and availability strategy in La Loma.
- For August stays, consider implementing length-of-stay discounts or slightly higher rates for bookings made less than 53 days out to capitalize on advance planning.
- During July, focus on last-minute booking availability and promotions, as guests book with very short notice (7 days avg.).
- Target marketing efforts for the Summer season well in advance (at least 23 days) to capture early planners.
- Monitor your own booking lead times against these La Loma averages to identify opportunities for dynamic pricing adjustments.
Popular & Essential Airbnb Amenities in La Loma (2026)
Amenity Prevalence
Amenity Insights for La Loma
- Essential amenities in La Loma that guests expect include: TV. Lacking these (this) could significantly impact bookings.
- Popular amenities like First aid kit, Wifi, Fire extinguisher are common but not universal. Offering these can provide a competitive edge.
- Warning: Wifi is not universally provided but is considered essential globally. Ensure reliable Wifi is offered.
Recommendations for Hosts
- Ensure your listing includes all essential amenities for La Loma: TV.
- Consider adding popular differentiators like First aid kit or Wifi to increase appeal.
- Highlight unique or less common amenities you offer (e.g., hot tub, dedicated workspace, EV charger) in your listing description and photos.
- Regularly check competitor amenities in La Loma to stay competitive.
La Loma Airbnb Guest Demographics & Profile Analysis (2026)
Guest Profile Summary for La Loma
- The typical guest profile for Airbnb in La Loma consists of predominantly international visitors (79%), with top international origins including United States, typically belonging to the Post-2000s (Gen Z/Alpha) group (50%), primarily speaking English or Spanish.
- Domestic travelers account for 21.1% of guests.
- Key international markets include Colombia (21.1%) and United States (21.1%).
- Top languages spoken are English (41.4%) followed by Spanish (20.7%).
- A significant demographic segment is the Post-2000s (Gen Z/Alpha) group, representing 50% of guests.
Recommendations for Hosts
- Focus marketing internationally, particularly towards travelers from United States.
- Tailor amenities and listing descriptions to appeal to the dominant Post-2000s (Gen Z/Alpha) demographic (e.g., highlight fast WiFi, smart home features, local guides).
- Highlight unique local experiences or amenities relevant to the primary guest profile.
- Consider seasonal promotions aligned with peak travel times for key origin markets.
Nearby Short-Term Rental Market Comparison
How does the La Loma Airbnb market stack up against its neighbors? Compare key performance metrics like average monthly revenue, ADR, and occupancy rates in surrounding areas to understand the broader regional STR landscape.
| Market | Active Properties | Monthly Revenue | Daily Rate | Avg. Occupancy |
|---|---|---|---|---|
| San Luis | 202 | $1,067 | $122.42 | 33% |
| San Andrés | 1,254 | $1,047 | $96.45 | 41% |
| Rocky Point | 30 | $771 | $156.27 | 30% |
| San Felipe Lazy Hill | 28 | $547 | $85.86 | 25% |
| Freetown | 16 | $500 | $79.07 | 29% |
| Corn Island (Municipio) | 33 | $431 | $71.84 | 28% |