Barbosa Airbnb Market Analysis 2026: Short Term Rental Data & Vacation Rental Statistics in Santander, Colombia
Is Airbnb profitable in Barbosa in 2026? Explore comprehensive Airbnb analytics for Barbosa, Santander, Colombia to uncover income potential. This 2026 STR market report for Barbosa, based on AirROI data from February 2025 to January 2026, reveals key trends in the niche market of 22 active listings.
Whether you're considering an Airbnb investment in Barbosa, optimizing your existing vacation rental, or exploring rental arbitrage opportunities, understanding the Barbosa Airbnb data is crucial. Navigating the high regulation landscape is key to maximizing your short term rental income potential. Let's dive into the specifics.
Key Barbosa Airbnb Performance Metrics Overview
Monthly Airbnb Revenue Variations & Income Potential in Barbosa (2026)
Understanding the monthly revenue variations for Airbnb listings in Barbosa is key to maximizing your short term rental income potential. Seasonality significantly impacts earnings. Our analysis, based on data from the past 12 months, shows that the peak revenue month for STRs in Barbosa is typically December, while August often presents the lowest earnings, highlighting opportunities for strategic pricing adjustments during shoulder and low seasons. Explore the typical Airbnb income in Barbosa across different performance tiers:
- Best-in-class properties (Top 10%) achieve $828+ monthly, often utilizing dynamic pricing and superior guest experiences.
- Strong performing properties (Top 25%) earn $442 or more, indicating effective management and desirable locations/amenities.
- Typical properties (Median) generate around $164 per month, representing the average market performance.
- Entry-level properties (Bottom 25%) see earnings around $84, often with potential for optimization.
Average Monthly Airbnb Earnings Trend in Barbosa
Barbosa Airbnb Occupancy Rate Trends (2026)
Maximize your bookings by understanding the Barbosa STR occupancy trends. Seasonal demand shifts significantly influence how often properties are booked. Typically, Junesees the highest demand (peak season occupancy), while October experiences the lowest (low season). Effective strategies, like adjusting minimum stays or offering promotions, can boost occupancy during slower periods. Here's how different property tiers perform in Barbosa:
- Best-in-class properties (Top 10%) achieve 34%+ occupancy, indicating high desirability and potentially optimized availability.
- Strong performing properties (Top 25%) maintain 21% or higher occupancy, suggesting good market fit and guest satisfaction.
- Typical properties (Median) have an occupancy rate around 11%.
- Entry-level properties (Bottom 25%) average 5% occupancy, potentially facing higher vacancy.
Average Monthly Occupancy Rate Trend in Barbosa
Average Daily Rate (ADR) Airbnb Trends in Barbosa (2026)
Effective short term rental pricing strategy in Barbosa involves understanding monthly ADR fluctuations. The Average Daily Rate (ADR) for Airbnb in Barbosa typically peaks in January and dips lowest during February. Leveraging Airbnb dynamic pricing tools or strategies based on this seasonality can significantly boost revenue. Here's a look at the typical nightly rates achieved:
- Best-in-class properties (Top 10%) command rates of $157+ per night, often due to premium features or locations.
- Strong performing properties (Top 25%) achieve nightly rates of $88 or more.
- Typical properties (Median) charge around $64 per night.
- Entry-level properties (Bottom 25%) earn around $39 per night.
Average Daily Rate (ADR) Trend by Month in Barbosa
Get Live Barbosa Market Intelligence 👇

Explore Real-time Analytics
Airbnb Seasonality Analysis & Trends in Barbosa (2026)
Peak Season (December, November, January)
- Revenue averages $509 per month
- Occupancy rates average 15.8%
- Daily rates average $97
Shoulder Season
- Revenue averages $317 per month
- Occupancy maintains around 15.7%
- Daily rates hold near $64
Low Season (August, September, October)
- Revenue drops to average $184 per month
- Occupancy decreases to average 13.2%
- Daily rates adjust to average $73
Seasonality Insights for Barbosa
- The Airbnb seasonality in Barbosa shows highly seasonal trends requiring careful strategy. While the sections above show seasonal averages, it's also insightful to look at the extremes:
- During the high season, the absolute peak month showcases Barbosa's highest earning potential, with monthly revenues capable of climbing to $543, occupancy reaching a high of 18.5%, and ADRs peaking at $103.
- Conversely, the slowest single month of the year, typically falling within the low season, marks the market's lowest point. In this month, revenue might dip to $145, occupancy could drop to 8.7%, and ADRs may adjust down to $62.
- Understanding both the seasonal averages and these monthly peaks and troughs in revenue, occupancy, and ADR is crucial for maximizing your Airbnb profit potential in Barbosa.
Seasonal Strategies for Maximizing Profit
- Peak Season: Maximize revenue through premium pricing and potentially longer minimum stays. Ensure high availability.
- Low Season: Offer competitive pricing, special promotions (e.g., extended stay discounts), and flexible cancellation policies. Target off-season travelers like remote workers or budget-conscious guests.
- Shoulder Seasons: Implement dynamic pricing that balances peak and low rates. Target weekend travelers or specific events. Offer slightly more flexible terms than peak season.
- Regularly analyze your own performance against these Barbosa seasonality benchmarks and adjust your pricing and availability strategy accordingly.
Best Areas for Airbnb Investment in Barbosa (2026)
Exploring the top neighborhoods for short-term rentals in Barbosa? This section highlights key areas, outlining why they are attractive for hosts and guests, along with notable local attractions. Consider these locations based on your target guest profile and investment strategy.
| Neighborhood / Area | Why Host Here? (Target Guests & Appeal) | Key Attractions & Landmarks |
|---|---|---|
| Parque de la Cultura | Located in the heart of Barbosa, this vibrant park is a cultural hub that attracts locals and tourists alike. It offers outdoor activities, cultural events, and a picturesque setting for relaxation. | Cultural events, Open-air concerts, Children's playground, Gardens, Local food stalls |
| The Main Square (Plaza Principal) | The central square of Barbosa, ideal for those looking to experience local life, cafés, and shops. It’s a meeting point for community events and a great place for socializing. | Church of San José, Local markets, Street performers, Cafés, Cultural exhibitions |
| Cerro del Santísimo | This mountain offers stunning views of Barbosa and is a popular pilgrimage site. Ideal for eco-tourism and adventure travelers seeking hiking and outdoor experiences. | Monument to Christ, Hiking trails, Scenic viewpoints, Nature walks, Photography opportunities |
| Calle de la 10 | A lively street known for its shops, bars, and restaurants. It’s vibrant during the day and nightlife makes it popular among younger crowds and tourists looking for fun. | Local restaurants, Nightclubs, Shops, Street food, Social events |
| La Playa | An urban beach area along the river, perfect for families and leisure seekers. It’s a popular spot for locals to relax and enjoy activities by the water. | River activities, Picnic areas, Playgrounds, Food vendors, Relaxation spots |
| Valle de San Nicolás | A scenic valley just outside Barbosa, ideal for nature lovers. It draws hikers and those looking to escape the urban environment without being far from the city. | Hiking, Natural landscapes, Camping, Wildlife viewing, Rural tourism |
| The Artisan Market | Barbosa's artisan market showcases local crafts and foods. Perfect for tourists who appreciate unique souvenirs and cultural experiences. | Handmade crafts, Local gastronomy, Cultural exhibitions, Workshops, Fresh produce |
| Cafes en el Parque | This area is known for its cozy cafés and casual dining spots. A great choice for tourists looking to unwind and enjoy the local coffee culture. | Local coffee shops, Patio dining, Art galleries, Relaxation spots, Local pastries |
Understanding Airbnb License Requirements & STR Laws in Barbosa (2026)
Yes, Barbosa, Santander, Colombia enforces high STR regulations. Obtaining a license and ensuring compliance is almost certainly required according to current 2026 STR laws. Always verify the latest short term rental regulations and Airbnb license requirements directly with local government authorities for Barbosa to ensure full compliance before hosting.
(Source: AirROI data, 2026, based on 95% licensed listings)
Top Performing Airbnb Properties in Barbosa (2026)
Benchmark your potential! Explore examples of top-performing Airbnb properties in Barbosabased on Trailing Twelve Month (TTM) revenue. Analyze their characteristics, revenue, occupancy rate, and ADR to understand what drives success in this market.
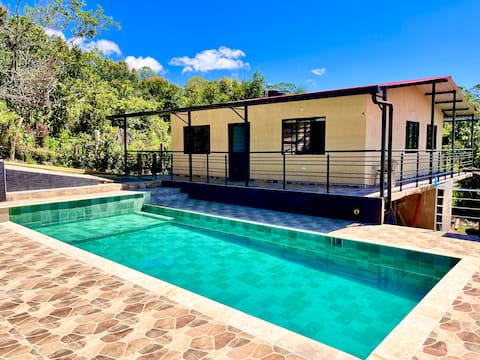
El Diamante: Private Estate with a Pool in Barbosa
Entire Place • 3 bedrooms
Sinadán, a place to dream
Entire Place • 4 bedrooms
El Limonar Cabin
Entire Place • 4 bedrooms

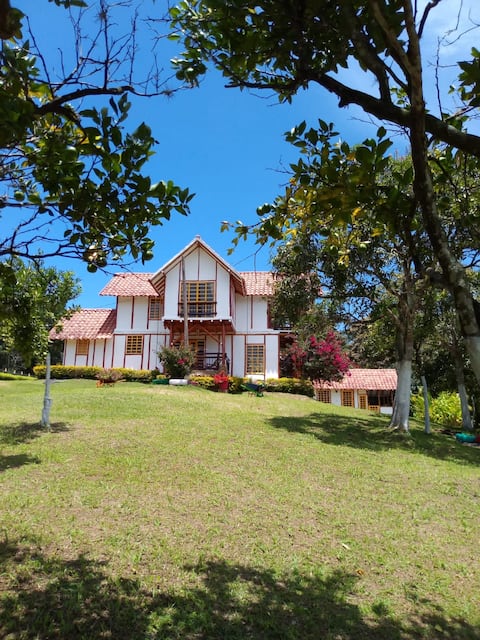
Casa de campo en Barbosa - a 3 minutos del centro
Entire Place • 3 bedrooms

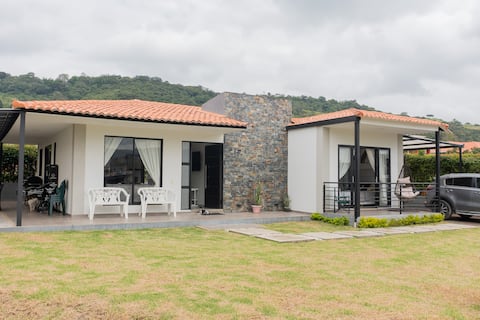
Farmhouse in Barbosa, capacity 8 people
Entire Place • 3 bedrooms

Casa Barbosa
Entire Place • 5 bedrooms
Note: Performance varies based on location, size, amenities, seasonality, and management quality. Data reflects the past 12 months.
Top Performing Airbnb Hosts in Barbosa (2026)
Learn from the best! This table showcases top-performing Airbnb hosts in Barbosa based on the number of properties managed and estimated total revenue over the past year. Analyze their scale and performance metrics.
| Host Name | Properties | Grossing Revenue | Stay Reviews | Avg Rating |
|---|---|---|---|---|
| Jonathan | 1 | $13,059 | 3 | 5.00/5.0 |
| Aura | 1 | $5,290 | 13 | 4.85/5.0 |
| Sandro Rod | 1 | $5,108 | 11 | 5.00/5.0 |
| Alirio | 1 | $3,800 | 10 | 4.30/5.0 |
| Fredy Orlando | 1 | $2,758 | 2 | Not Rated |
| Julio César | 2 | $2,717 | 32 | 4.91/5.0 |
| Lina | 1 | $2,266 | 15 | 4.87/5.0 |
| Richard | 1 | $2,011 | 6 | 5.00/5.0 |
| David | 3 | $1,662 | 22 | 4.55/5.0 |
| Rafael | 1 | $1,650 | 37 | 4.68/5.0 |
Analyzing the strategies of top hosts, such as their property selection, pricing, and guest communication, can offer valuable lessons for optimizing your own Airbnb operations in Barbosa.
Dive Deeper: Advanced Barbosa STR Market Data (2026)
Ready to unlock more insights? AirROI provides access to advanced metrics and comprehensive Airbnb data for Barbosa. Explore detailed analytics beyond this report to refine your investment strategy, optimize pricing, and maximize your vacation rental profits.
Explore Advanced MetricsBarbosa Short-Term Rental Market Composition (2026): Property & Room Types
Room Type Distribution
Property Type Distribution
Market Composition Insights for Barbosa
- The Barbosa Airbnb market composition is heavily skewed towards Entire Home/Apt listings, which make up 81.8% of the 22 active rentals. This indicates strong guest preference for privacy and space.
- Looking at the property type distribution in Barbosa, House properties are the most common (36.4%), reflecting the local real estate landscape.
- Houses represent a significant 36.4% portion, catering likely to families or larger groups.
- The presence of 18.2% Hotel/Boutique listings indicates integration with traditional hospitality.
Barbosa Airbnb Room Capacity Analysis (2026): Bedroom Distribution
Distribution of Listings by Number of Bedrooms
Room Capacity Insights for Barbosa
- The dominant room capacity in Barbosa is 3 bedrooms listings, making up 45.5% of the market. This suggests a strong demand for properties suitable for families or small groups.
- Together, 3 bedrooms and 2 bedrooms properties represent 63.7% of the active Airbnb listings in Barbosa, indicating a high concentration in these sizes.
- A significant 68.2% of listings offer 3+ bedrooms, catering to larger groups and families seeking more space in Barbosa.
Barbosa Vacation Rental Guest Capacity Trends (2026)
Distribution of Listings by Guest Capacity
Guest Capacity Insights for Barbosa
- The most common guest capacity trend in Barbosa vacation rentals is listings accommodating 8+ guests (40.9%). This suggests the primary traveler segment is likely larger groups.
- Properties designed for 8+ guests and 2 guests dominate the Barbosa STR market, accounting for 54.5% of listings.
- 63.6% of properties accommodate 6+ guests, serving the market segment for larger families or group travel in Barbosa.
- On average, properties in Barbosa are equipped to host 5.7 guests.
Barbosa Airbnb Booking Patterns (2026): Available vs. Booked Days
Available Days Distribution
Booked Days Distribution
Booking Pattern Insights for Barbosa
- The most common availability pattern in Barbosa falls within the 271-366 days range, representing 100% of listings. This suggests many properties have significant open periods on their calendars.
- Approximately 100.0% of listings show high availability (181+ days open annually), indicating potential for increased bookings or specific owner usage patterns.
- For booked days, the 1-30 days range is most frequent in Barbosa (72.7%), reflecting common guest stay durations or potential owner blocking patterns.
Barbosa Airbnb Minimum Stay Requirements Analysis
Distribution of Listings by Minimum Night Requirement
1 Night
16 listings
72.7% of total
2 Nights
4 listings
18.2% of total
30+ Nights
2 listings
9.1% of total
Key Insights
- The most prevalent minimum stay requirement in Barbosa is 1 Night, adopted by 72.7% of listings. This highlights the market's preference for shorter, flexible bookings.
- A strong majority (90.9%) of the Barbosa Airbnb data shows acceptance of very short stays (1-2 nights), indicating a dynamic, high-turnover market.
Recommendations
- Align with the market by considering a 1 Night minimum stay, as 72.7% of Barbosa hosts use this setting.
- Explore offering discounts for stays of 30+ nights to attract the 9.1% of the market seeking extended stays.
- Adjust minimum nights based on seasonality – potentially shorter during low season and longer during peak demand periods in Barbosa.
Barbosa Airbnb Cancellation Policy Trends Analysis (2026)
Limited
1 listings
4.5% of total
Flexible
11 listings
50% of total
Moderate
6 listings
27.3% of total
Firm
4 listings
18.2% of total
Cancellation Policy Insights for Barbosa
- The prevailing Airbnb cancellation policy trend in Barbosa is Flexible, used by 50% of listings.
- The market strongly favors guest-friendly terms, with 77.3% of listings offering Flexible or Moderate policies. This suggests guests in Barbosa may expect booking flexibility.
Recommendations for Hosts
- Consider adopting a Flexible policy to align with the 50% market standard in Barbosa.
- Regularly review your cancellation policy against competitors and market demand shifts in Barbosa.
Barbosa STR Booking Lead Time Analysis (2026)
Average Booking Lead Time by Month
Booking Lead Time Insights for Barbosa
- The overall average booking lead time for vacation rentals in Barbosa is 27 days.
- Guests book furthest in advance for stays during May (average 51 days), likely coinciding with peak travel demand or local events.
- The shortest booking windows occur for stays in September (average 4 days), indicating more last-minute travel plans during this time.
- Seasonally, Spring (24 days avg.) sees the longest lead times, while Summer (8 days avg.) has the shortest, reflecting typical travel planning cycles.
Recommendations for Hosts
- Use the overall average lead time (27 days) as a baseline for your pricing and availability strategy in Barbosa.
- For May stays, consider implementing length-of-stay discounts or slightly higher rates for bookings made less than 51 days out to capitalize on advance planning.
- During September, focus on last-minute booking availability and promotions, as guests book with very short notice (4 days avg.).
- Target marketing efforts for the Spring season well in advance (at least 24 days) to capture early planners.
- Monitor your own booking lead times against these Barbosa averages to identify opportunities for dynamic pricing adjustments.
Popular & Essential Airbnb Amenities in Barbosa (2026)
Amenity Prevalence
Amenity Insights for Barbosa
- Essential amenities in Barbosa that guests expect include: TV. Lacking these (this) could significantly impact bookings.
- Popular amenities like Wifi, Free parking on premises, Kitchen are common but not universal. Offering these can provide a competitive edge.
- Warning: Wifi is not universally provided but is considered essential globally. Ensure reliable Wifi is offered.
Recommendations for Hosts
- Ensure your listing includes all essential amenities for Barbosa: TV.
- Consider adding popular differentiators like Wifi or Free parking on premises to increase appeal.
- Highlight unique or less common amenities you offer (e.g., hot tub, dedicated workspace, EV charger) in your listing description and photos.
- Regularly check competitor amenities in Barbosa to stay competitive.
Barbosa Airbnb Guest Demographics & Profile Analysis (2026)
Guest Profile Summary for Barbosa
- The typical guest profile for Airbnb in Barbosa consists of primarily domestic travelers (71%), often arriving from nearby Bogotá, typically belonging to the Post-2000s (Gen Z/Alpha) group (50%), primarily speaking Spanish or English.
- Domestic travelers account for 70.6% of guests.
- Key international markets include Colombia (70.6%) and United States (5.9%).
- Top languages spoken are Spanish (58.6%) followed by English (27.6%).
- A significant demographic segment is the Post-2000s (Gen Z/Alpha) group, representing 50% of guests.
Recommendations for Hosts
- Target domestic marketing efforts towards travelers from Bogotá and Tunja.
- Tailor amenities and listing descriptions to appeal to the dominant Post-2000s (Gen Z/Alpha) demographic (e.g., highlight fast WiFi, smart home features, local guides).
- Highlight unique local experiences or amenities relevant to the primary guest profile.
- Consider seasonal promotions aligned with peak travel times for key origin markets.
Nearby Short-Term Rental Market Comparison
How does the Barbosa Airbnb market stack up against its neighbors? Compare key performance metrics like average monthly revenue, ADR, and occupancy rates in surrounding areas to understand the broader regional STR landscape.
| Market | Active Properties | Monthly Revenue | Daily Rate | Avg. Occupancy |
|---|---|---|---|---|
| Anapoima | 286 | $1,775 | $279.24 | 26% |
| Apulo | 105 | $1,505 | $270.37 | 22% |
| Cundinamarca | 11 | $1,424 | $201.05 | 23% |
| Nilo | 73 | $1,138 | $246.56 | 21% |
| Quebradanegra | 22 | $977 | $189.40 | 16% |
| El Imperio | 14 | $900 | $193.43 | 19% |
| Villeta | 325 | $860 | $181.51 | 20% |
| Nimaima | 34 | $843 | $195.06 | 19% |
| Sasaima | 42 | $810 | $132.40 | 22% |
| Vergara | 11 | $773 | $106.11 | 25% |