Zapatoca Airbnb Market Analysis 2026: Short Term Rental Data & Vacation Rental Statistics in Santander, Colombia
Is Airbnb profitable in Zapatoca in 2026? Explore comprehensive Airbnb analytics for Zapatoca, Santander, Colombia to uncover income potential. This 2026 STR market report for Zapatoca, based on AirROI data from February 2025 to January 2026, reveals key trends in the niche market of 45 active listings.
Whether you're considering an Airbnb investment in Zapatoca, optimizing your existing vacation rental, or exploring rental arbitrage opportunities, understanding the Zapatoca Airbnb data is crucial. Navigating the high regulation landscape is key to maximizing your short term rental income potential. Let's dive into the specifics.
Key Zapatoca Airbnb Performance Metrics Overview
Monthly Airbnb Revenue Variations & Income Potential in Zapatoca (2026)
Understanding the monthly revenue variations for Airbnb listings in Zapatoca is key to maximizing your short term rental income potential. Seasonality significantly impacts earnings. Our analysis, based on data from the past 12 months, shows that the peak revenue month for STRs in Zapatoca is typically January, while May often presents the lowest earnings, highlighting opportunities for strategic pricing adjustments during shoulder and low seasons. Explore the typical Airbnb income in Zapatoca across different performance tiers:
- Best-in-class properties (Top 10%) achieve $876+ monthly, often utilizing dynamic pricing and superior guest experiences.
- Strong performing properties (Top 25%) earn $519 or more, indicating effective management and desirable locations/amenities.
- Typical properties (Median) generate around $210 per month, representing the average market performance.
- Entry-level properties (Bottom 25%) see earnings around $94, often with potential for optimization.
Average Monthly Airbnb Earnings Trend in Zapatoca
Zapatoca Airbnb Occupancy Rate Trends (2026)
Maximize your bookings by understanding the Zapatoca STR occupancy trends. Seasonal demand shifts significantly influence how often properties are booked. Typically, Februarysees the highest demand (peak season occupancy), while September experiences the lowest (low season). Effective strategies, like adjusting minimum stays or offering promotions, can boost occupancy during slower periods. Here's how different property tiers perform in Zapatoca:
- Best-in-class properties (Top 10%) achieve 38%+ occupancy, indicating high desirability and potentially optimized availability.
- Strong performing properties (Top 25%) maintain 26% or higher occupancy, suggesting good market fit and guest satisfaction.
- Typical properties (Median) have an occupancy rate around 13%.
- Entry-level properties (Bottom 25%) average 8% occupancy, potentially facing higher vacancy.
Average Monthly Occupancy Rate Trend in Zapatoca
Average Daily Rate (ADR) Airbnb Trends in Zapatoca (2026)
Effective short term rental pricing strategy in Zapatoca involves understanding monthly ADR fluctuations. The Average Daily Rate (ADR) for Airbnb in Zapatoca typically peaks in December and dips lowest during September. Leveraging Airbnb dynamic pricing tools or strategies based on this seasonality can significantly boost revenue. Here's a look at the typical nightly rates achieved:
- Best-in-class properties (Top 10%) command rates of $132+ per night, often due to premium features or locations.
- Strong performing properties (Top 25%) achieve nightly rates of $94 or more.
- Typical properties (Median) charge around $53 per night.
- Entry-level properties (Bottom 25%) earn around $32 per night.
Average Daily Rate (ADR) Trend by Month in Zapatoca
Get Live Zapatoca Market Intelligence 👇

Explore Real-time Analytics
Airbnb Seasonality Analysis & Trends in Zapatoca (2026)
Peak Season (January, February, December)
- Revenue averages $478 per month
- Occupancy rates average 24.3%
- Daily rates average $67
Shoulder Season
- Revenue averages $365 per month
- Occupancy maintains around 18.4%
- Daily rates hold near $67
Low Season (May, July, September)
- Revenue drops to average $254 per month
- Occupancy decreases to average 13.4%
- Daily rates adjust to average $66
Seasonality Insights for Zapatoca
- The Airbnb seasonality in Zapatoca shows highly seasonal trends requiring careful strategy. While the sections above show seasonal averages, it's also insightful to look at the extremes:
- During the high season, the absolute peak month showcases Zapatoca's highest earning potential, with monthly revenues capable of climbing to $502, occupancy reaching a high of 26.0%, and ADRs peaking at $69.
- Conversely, the slowest single month of the year, typically falling within the low season, marks the market's lowest point. In this month, revenue might dip to $219, occupancy could drop to 11.8%, and ADRs may adjust down to $63.
- Understanding both the seasonal averages and these monthly peaks and troughs in revenue, occupancy, and ADR is crucial for maximizing your Airbnb profit potential in Zapatoca.
Seasonal Strategies for Maximizing Profit
- Peak Season: Maximize revenue through premium pricing and potentially longer minimum stays. Ensure high availability.
- Low Season: Offer competitive pricing, special promotions (e.g., extended stay discounts), and flexible cancellation policies. Target off-season travelers like remote workers or budget-conscious guests.
- Shoulder Seasons: Implement dynamic pricing that balances peak and low rates. Target weekend travelers or specific events. Offer slightly more flexible terms than peak season.
- Regularly analyze your own performance against these Zapatoca seasonality benchmarks and adjust your pricing and availability strategy accordingly.
Best Areas for Airbnb Investment in Zapatoca (2026)
Exploring the top neighborhoods for short-term rentals in Zapatoca? This section highlights key areas, outlining why they are attractive for hosts and guests, along with notable local attractions. Consider these locations based on your target guest profile and investment strategy.
| Neighborhood / Area | Why Host Here? (Target Guests & Appeal) | Key Attractions & Landmarks |
|---|---|---|
| Centro | The heart of Zapatoca, with historic architecture and proximity to local amenities and attractions. Perfect for travelers seeking to explore local culture and history. | Zapatoca Main Square, San Lorenzo Hill, Zapatoca's Church, Casa de la Cultura, Museum of Zapatoca |
| Parque Principal | A vibrant park area that serves as a social hub in Zapatoca. Ideal for guests who enjoy outdoor activities and local events. | Parque Principal, Cafes and Restaurants, Local events and markets |
| Cerro de las Tres Cruces | A scenic viewpoint that offers breathtaking views of the region. Popular with nature lovers and hikers looking for outdoor experiences. | Hiking Trails, Scenic Viewpoints |
| La Mesa | A quiet suburban area, perfect for those who seek tranquility and nature. Great for families and pet-friendly guests. | Nature Trails, Local Farms, Cultural Experience |
| Mirador de Zapatoca | A picturesque lookout point that attracts visitors interested in scenic vistas and photography. Great for weekend getaways. | Viewing Platform, Photography Spots, Picnic Areas |
| Calle del Comercio | The main shopping street in Zapatoca, filled with local shops and eateries. Ideal for guests who want to experience local commerce. | Local Shops, Restaurants, Street Performances |
| Zona Cafetalera | An area rich in coffee culture, attracting those interested in coffee tours and local agriculture. Unique experience for guests wanting to learn about coffee production. | Coffee Plantations, Coffee Tours, Local Tastings |
| El Salado | A tourist-favorite for its natural springs and outdoor activities, including swimming and picnicking. Ideal for families and nature enthusiasts. | Hot Springs, Natural Pools, Outdoor Recreational Activities |
Understanding Airbnb License Requirements & STR Laws in Zapatoca (2026)
Yes, Zapatoca, Santander, Colombia enforces high STR regulations. Obtaining a license and ensuring compliance is almost certainly required according to current 2026 STR laws. Always verify the latest short term rental regulations and Airbnb license requirements directly with local government authorities for Zapatoca to ensure full compliance before hosting.
(Source: AirROI data, 2026, based on 91% licensed listings)
Top Performing Airbnb Properties in Zapatoca (2026)
Benchmark your potential! Explore examples of top-performing Airbnb properties in Zapatocabased on Trailing Twelve Month (TTM) revenue. Analyze their characteristics, revenue, occupancy rate, and ADR to understand what drives success in this market.
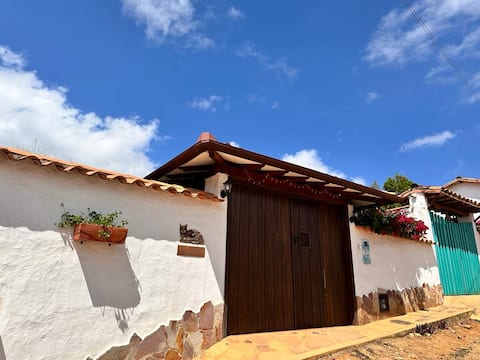
Spectacular "Casa Serena" in Zapatoca
Entire Place • 3 bedrooms
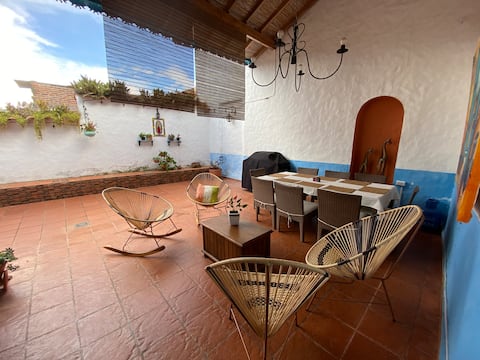
My “Five” star house
Entire Place • 4 bedrooms

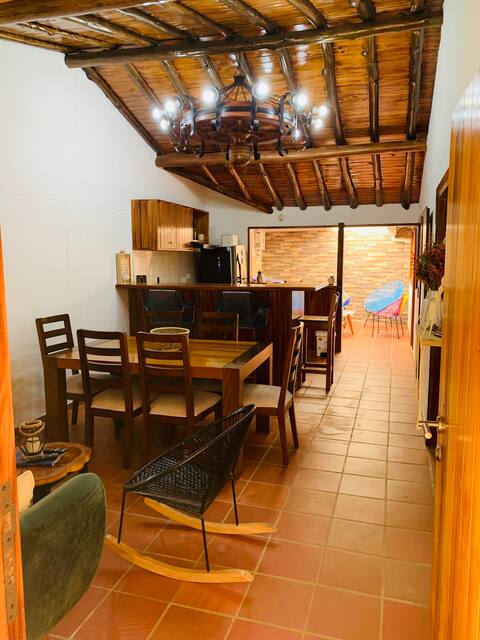
Jericó Zapatoca House
Entire Place • 4 bedrooms

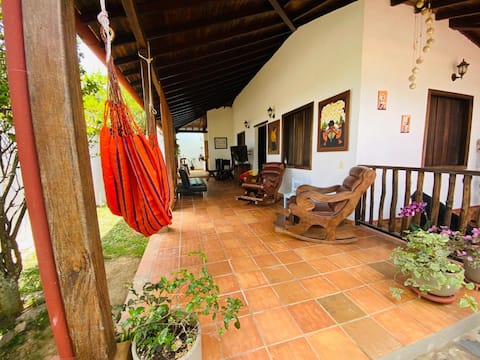
Beautiful Casa de Campo los Montes in Zapatoca
Entire Place • 5 bedrooms
Cozy house in Zapatoca
Entire Place • 3 bedrooms
Cozy House in Zapatoca.
Entire Place • 2 bedrooms
Note: Performance varies based on location, size, amenities, seasonality, and management quality. Data reflects the past 12 months.
Top Performing Airbnb Hosts in Zapatoca (2026)
Learn from the best! This table showcases top-performing Airbnb hosts in Zapatoca based on the number of properties managed and estimated total revenue over the past year. Analyze their scale and performance metrics.
| Host Name | Properties | Grossing Revenue | Stay Reviews | Avg Rating |
|---|---|---|---|---|
| Maria Juliana | 2 | $16,421 | 20 | 5.00/5.0 |
| Lc | 5 | $14,050 | 28 | 4.80/5.0 |
| Oscar | 1 | $10,814 | 52 | 4.92/5.0 |
| Maria | 1 | $9,910 | 28 | 5.00/5.0 |
| María | 6 | $9,503 | 108 | 5.00/5.0 |
| Laura | 1 | $7,942 | 18 | 5.00/5.0 |
| Hestia | 2 | $7,521 | 37 | 4.74/5.0 |
| Ayde | 1 | $6,784 | 14 | 4.86/5.0 |
| Ana Melisa | 1 | $6,754 | 47 | 4.96/5.0 |
| Camilo | 1 | $5,795 | 4 | 4.75/5.0 |
Analyzing the strategies of top hosts, such as their property selection, pricing, and guest communication, can offer valuable lessons for optimizing your own Airbnb operations in Zapatoca.
Dive Deeper: Advanced Zapatoca STR Market Data (2026)
Ready to unlock more insights? AirROI provides access to advanced metrics and comprehensive Airbnb data for Zapatoca. Explore detailed analytics beyond this report to refine your investment strategy, optimize pricing, and maximize your vacation rental profits.
Explore Advanced MetricsZapatoca Short-Term Rental Market Composition (2026): Property & Room Types
Room Type Distribution
Property Type Distribution
Market Composition Insights for Zapatoca
- The Zapatoca Airbnb market composition is heavily skewed towards Entire Home/Apt listings, which make up 64.4% of the 45 active rentals. This indicates strong guest preference for privacy and space.
- However, a notable 33.3% share for Private Rooms suggests opportunities for budget-conscious travelers or hosts renting out spare rooms.
- Looking at the property type distribution in Zapatoca, House properties are the most common (62.2%), reflecting the local real estate landscape.
- Houses represent a significant 62.2% portion, catering likely to families or larger groups.
- The presence of 11.1% Hotel/Boutique listings indicates integration with traditional hospitality.
- Smaller segments like others, apartment/condo (combined 6.6%) offer potential for unique stay experiences.
Zapatoca Airbnb Room Capacity Analysis (2026): Bedroom Distribution
Distribution of Listings by Number of Bedrooms
Room Capacity Insights for Zapatoca
- The dominant room capacity in Zapatoca is 1 bedroom listings, making up 33.3% of the market. This suggests a strong demand for properties suitable for couples or solo travelers.
- Together, 1 bedroom and 3 bedrooms properties represent 53.3% of the active Airbnb listings in Zapatoca, indicating a high concentration in these sizes.
- A significant 40.0% of listings offer 3+ bedrooms, catering to larger groups and families seeking more space in Zapatoca.
Zapatoca Vacation Rental Guest Capacity Trends (2026)
Distribution of Listings by Guest Capacity
Guest Capacity Insights for Zapatoca
- The most common guest capacity trend in Zapatoca vacation rentals is listings accommodating 8+ guests (35.6%). This suggests the primary traveler segment is likely larger groups.
- Properties designed for 8+ guests and 2 guests dominate the Zapatoca STR market, accounting for 55.6% of listings.
- 48.9% of properties accommodate 6+ guests, serving the market segment for larger families or group travel in Zapatoca.
- On average, properties in Zapatoca are equipped to host 4.8 guests.
Zapatoca Airbnb Booking Patterns (2026): Available vs. Booked Days
Available Days Distribution
Booked Days Distribution
Booking Pattern Insights for Zapatoca
- The most common availability pattern in Zapatoca falls within the 271-366 days range, representing 88.9% of listings. This suggests many properties have significant open periods on their calendars.
- Approximately 100.0% of listings show high availability (181+ days open annually), indicating potential for increased bookings or specific owner usage patterns.
- For booked days, the 31-90 days range is most frequent in Zapatoca (44.4%), reflecting common guest stay durations or potential owner blocking patterns.
Zapatoca Airbnb Minimum Stay Requirements Analysis
Distribution of Listings by Minimum Night Requirement
1 Night
39 listings
86.7% of total
2 Nights
1 listings
2.2% of total
30+ Nights
5 listings
11.1% of total
Key Insights
- The most prevalent minimum stay requirement in Zapatoca is 1 Night, adopted by 86.7% of listings. This highlights the market's preference for shorter, flexible bookings.
- A strong majority (88.9%) of the Zapatoca Airbnb data shows acceptance of very short stays (1-2 nights), indicating a dynamic, high-turnover market.
- A significant segment (11.1%) caters to monthly stays (30+ nights) in Zapatoca, pointing to opportunities in the extended-stay market.
Recommendations
- Align with the market by considering a 1 Night minimum stay, as 86.7% of Zapatoca hosts use this setting.
- Explore offering discounts for stays of 30+ nights to attract the 11.1% of the market seeking extended stays.
- Adjust minimum nights based on seasonality – potentially shorter during low season and longer during peak demand periods in Zapatoca.
Zapatoca Airbnb Cancellation Policy Trends Analysis (2026)
Limited
2 listings
4.5% of total
Flexible
15 listings
34.1% of total
Moderate
9 listings
20.5% of total
Firm
18 listings
40.9% of total
Cancellation Policy Insights for Zapatoca
- The prevailing Airbnb cancellation policy trend in Zapatoca is Firm, used by 40.9% of listings.
- There's a relatively balanced mix between guest-friendly (54.6%) and stricter (40.9%) policies, offering choices for different guest needs.
Recommendations for Hosts
- Consider adopting a Firm policy to align with the 40.9% market standard in Zapatoca.
- Regularly review your cancellation policy against competitors and market demand shifts in Zapatoca.
Zapatoca STR Booking Lead Time Analysis (2026)
Average Booking Lead Time by Month
Booking Lead Time Insights for Zapatoca
- The overall average booking lead time for vacation rentals in Zapatoca is 21 days.
- Guests book furthest in advance for stays during December (average 39 days), likely coinciding with peak travel demand or local events.
- The shortest booking windows occur for stays in May (average 12 days), indicating more last-minute travel plans during this time.
- Seasonally, Winter (27 days avg.) sees the longest lead times, while Spring (16 days avg.) has the shortest, reflecting typical travel planning cycles.
Recommendations for Hosts
- Use the overall average lead time (21 days) as a baseline for your pricing and availability strategy in Zapatoca.
- For December stays, consider implementing length-of-stay discounts or slightly higher rates for bookings made less than 39 days out to capitalize on advance planning.
- During May, focus on last-minute booking availability and promotions, as guests book with very short notice (12 days avg.).
- Target marketing efforts for the Winter season well in advance (at least 27 days) to capture early planners.
- Monitor your own booking lead times against these Zapatoca averages to identify opportunities for dynamic pricing adjustments.
Popular & Essential Airbnb Amenities in Zapatoca (2026)
Amenity Prevalence
Amenity Insights for Zapatoca
- Essential amenities in Zapatoca that guests expect include: Wifi. Lacking these (this) could significantly impact bookings.
- Popular amenities like Kitchen, Free parking on premises, Dedicated workspace are common but not universal. Offering these can provide a competitive edge.
Recommendations for Hosts
- Ensure your listing includes all essential amenities for Zapatoca: Wifi.
- Prioritize adding missing essentials: Wifi.
- Consider adding popular differentiators like Kitchen or Free parking on premises to increase appeal.
- Highlight unique or less common amenities you offer (e.g., hot tub, dedicated workspace, EV charger) in your listing description and photos.
- Regularly check competitor amenities in Zapatoca to stay competitive.
Zapatoca Airbnb Guest Demographics & Profile Analysis (2026)
Guest Profile Summary for Zapatoca
- The typical guest profile for Airbnb in Zapatoca consists of primarily domestic travelers (70%), often arriving from nearby Bucaramanga, typically belonging to the Post-2000s (Gen Z/Alpha) group (50%), primarily speaking Spanish or English.
- Domestic travelers account for 69.7% of guests.
- Key international markets include Colombia (69.7%) and United States (10.9%).
- Top languages spoken are Spanish (44.6%) followed by English (36.6%).
- A significant demographic segment is the Post-2000s (Gen Z/Alpha) group, representing 50% of guests.
Recommendations for Hosts
- Target domestic marketing efforts towards travelers from Bucaramanga and Medellín.
- Tailor amenities and listing descriptions to appeal to the dominant Post-2000s (Gen Z/Alpha) demographic (e.g., highlight fast WiFi, smart home features, local guides).
- Highlight unique local experiences or amenities relevant to the primary guest profile.
- Consider seasonal promotions aligned with peak travel times for key origin markets.
Nearby Short-Term Rental Market Comparison
How does the Zapatoca Airbnb market stack up against its neighbors? Compare key performance metrics like average monthly revenue, ADR, and occupancy rates in surrounding areas to understand the broader regional STR landscape.
| Market | Active Properties | Monthly Revenue | Daily Rate | Avg. Occupancy |
|---|---|---|---|---|
| Quebradanegra | 22 | $977 | $189.40 | 16% |
| Villeta | 325 | $860 | $181.51 | 20% |
| Nimaima | 34 | $843 | $195.06 | 19% |
| Vergara | 11 | $773 | $106.11 | 25% |
| Nocaima | 66 | $736 | $168.35 | 18% |
| Honda | 144 | $710 | $143.86 | 22% |
| Doradal | 38 | $656 | $155.33 | 23% |
| Chocontá | 57 | $610 | $164.52 | 15% |
| Vereda El Espinal | 19 | $571 | $91.60 | 26% |
| El Roble | 11 | $561 | $160.50 | 21% |