Honda Airbnb Market Analysis 2026: Short Term Rental Data & Vacation Rental Statistics in Tolima, Colombia
Is Airbnb profitable in Honda in 2026? Explore comprehensive Airbnb analytics for Honda, Tolima, Colombia to uncover income potential. This 2026 STR market report for Honda, based on AirROI data from February 2025 to January 2026, reveals key trends in the niche market of 144 active listings.
Whether you're considering an Airbnb investment in Honda, optimizing your existing vacation rental, or exploring rental arbitrage opportunities, understanding the Honda Airbnb data is crucial. Navigating the high regulation landscape is key to maximizing your short term rental income potential. Let's dive into the specifics.
Key Honda Airbnb Performance Metrics Overview
Monthly Airbnb Revenue Variations & Income Potential in Honda (2026)
Understanding the monthly revenue variations for Airbnb listings in Honda is key to maximizing your short term rental income potential. Seasonality significantly impacts earnings. Our analysis, based on data from the past 12 months, shows that the peak revenue month for STRs in Honda is typically December, while May often presents the lowest earnings, highlighting opportunities for strategic pricing adjustments during shoulder and low seasons. Explore the typical Airbnb income in Honda across different performance tiers:
- Best-in-class properties (Top 10%) achieve $2,601+ monthly, often utilizing dynamic pricing and superior guest experiences.
- Strong performing properties (Top 25%) earn $1,518 or more, indicating effective management and desirable locations/amenities.
- Typical properties (Median) generate around $736 per month, representing the average market performance.
- Entry-level properties (Bottom 25%) see earnings around $301, often with potential for optimization.
Average Monthly Airbnb Earnings Trend in Honda
Honda Airbnb Occupancy Rate Trends (2026)
Maximize your bookings by understanding the Honda STR occupancy trends. Seasonal demand shifts significantly influence how often properties are booked. Typically, Decembersees the highest demand (peak season occupancy), while May experiences the lowest (low season). Effective strategies, like adjusting minimum stays or offering promotions, can boost occupancy during slower periods. Here's how different property tiers perform in Honda:
- Best-in-class properties (Top 10%) achieve 47%+ occupancy, indicating high desirability and potentially optimized availability.
- Strong performing properties (Top 25%) maintain 33% or higher occupancy, suggesting good market fit and guest satisfaction.
- Typical properties (Median) have an occupancy rate around 20%.
- Entry-level properties (Bottom 25%) average 10% occupancy, potentially facing higher vacancy.
Average Monthly Occupancy Rate Trend in Honda
Average Daily Rate (ADR) Airbnb Trends in Honda (2026)
Effective short term rental pricing strategy in Honda involves understanding monthly ADR fluctuations. The Average Daily Rate (ADR) for Airbnb in Honda typically peaks in January and dips lowest during February. Leveraging Airbnb dynamic pricing tools or strategies based on this seasonality can significantly boost revenue. Here's a look at the typical nightly rates achieved:
- Best-in-class properties (Top 10%) command rates of $257+ per night, often due to premium features or locations.
- Strong performing properties (Top 25%) achieve nightly rates of $190 or more.
- Typical properties (Median) charge around $109 per night.
- Entry-level properties (Bottom 25%) earn around $65 per night.
Average Daily Rate (ADR) Trend by Month in Honda
Get Live Honda Market Intelligence 👇

Explore Real-time Analytics
Airbnb Seasonality Analysis & Trends in Honda (2026)
Peak Season (December, August, October)
- Revenue averages $1,297 per month
- Occupancy rates average 26.9%
- Daily rates average $143
Shoulder Season
- Revenue averages $1,066 per month
- Occupancy maintains around 23.8%
- Daily rates hold near $138
Low Season (February, March, May)
- Revenue drops to average $839 per month
- Occupancy decreases to average 21.8%
- Daily rates adjust to average $126
Seasonality Insights for Honda
- The Airbnb seasonality in Honda shows highly seasonal trends requiring careful strategy. While the sections above show seasonal averages, it's also insightful to look at the extremes:
- During the high season, the absolute peak month showcases Honda's highest earning potential, with monthly revenues capable of climbing to $1,524, occupancy reaching a high of 29.3%, and ADRs peaking at $154.
- Conversely, the slowest single month of the year, typically falling within the low season, marks the market's lowest point. In this month, revenue might dip to $680, occupancy could drop to 17.6%, and ADRs may adjust down to $124.
- Understanding both the seasonal averages and these monthly peaks and troughs in revenue, occupancy, and ADR is crucial for maximizing your Airbnb profit potential in Honda.
Seasonal Strategies for Maximizing Profit
- Peak Season: Maximize revenue through premium pricing and potentially longer minimum stays. Ensure high availability.
- Low Season: Offer competitive pricing, special promotions (e.g., extended stay discounts), and flexible cancellation policies. Target off-season travelers like remote workers or budget-conscious guests.
- Shoulder Seasons: Implement dynamic pricing that balances peak and low rates. Target weekend travelers or specific events. Offer slightly more flexible terms than peak season.
- Regularly analyze your own performance against these Honda seasonality benchmarks and adjust your pricing and availability strategy accordingly.
Best Areas for Airbnb Investment in Honda (2026)
Exploring the top neighborhoods for short-term rentals in Honda? This section highlights key areas, outlining why they are attractive for hosts and guests, along with notable local attractions. Consider these locations based on your target guest profile and investment strategy.
| Neighborhood / Area | Why Host Here? (Target Guests & Appeal) | Key Attractions & Landmarks |
|---|---|---|
| Centro Histórico | Historic center of Honda offering colonial architecture and a rich cultural experience. Ideal for tourists wanting to explore the history and charm of the town. | Catedral de San Bartolomé, Puente del Río Magdalena, Museo del Oro, Parque de los Libertadores |
| La Playa | A riverside area popular for water activities and leisure, providing a relaxing environment for families and groups looking for recreation. | Río Magdalena, Playas de Honda, Parque de la Playa, Deportes Acuáticos |
| Barrio El Prado | A residential neighborhood known for its tranquility and proximity to local attractions, appealing to visitors seeking a local experience. | Plaza de Mercado, Plaza de Toros, Parque de la Vida, Cafés locales |
| Barrio El Centro | The bustling commercial area filled with shops, cafes, and vibrant street life, perfect for those who enjoy being in the heart of the action. | Centro Comercial El Eden, Cafeterías del Centro, Ferias Locales |
| Mirador del Río | Scenic viewpoint area offering stunning views of the Río Magdalena, great for guests who appreciate nature and beautiful landscapes. | Mirador del Río, Senderos Naturales, Zona de Picnic |
| Sector La Quiebra | Known for its lovely scenery and local wildlife, appealing to nature lovers and those looking for outdoor activities. | Senderos Ecológicos, Observación de Aves, Rutas de Senderismo |
| Barrio Santa Teresa | A calm neighborhood with local charm, providing an authentic Colombian experience with easy access to tourist spots. | Cafés Tradicionales, Mercados Locales, Centro Cultural |
| Villa Fátima | An emerging locality with new developments, attractive to younger visitors looking for modern amenities and local flavor. | Centro Recreativo, Parque de Villa Fátima, Cafeterías Modernas |
Understanding Airbnb License Requirements & STR Laws in Honda (2026)
Yes, Honda, Tolima, Colombia enforces high STR regulations. Obtaining a license and ensuring compliance is almost certainly required according to current 2026 STR laws. Always verify the latest short term rental regulations and Airbnb license requirements directly with local government authorities for Honda to ensure full compliance before hosting.
(Source: AirROI data, 2026, based on 95% licensed listings)
Top Performing Airbnb Properties in Honda (2026)
Benchmark your potential! Explore examples of top-performing Airbnb properties in Hondabased on Trailing Twelve Month (TTM) revenue. Analyze their characteristics, revenue, occupancy rate, and ADR to understand what drives success in this market.

Villa Sofia Honda, Colonial House
Entire Place • 7 bedrooms
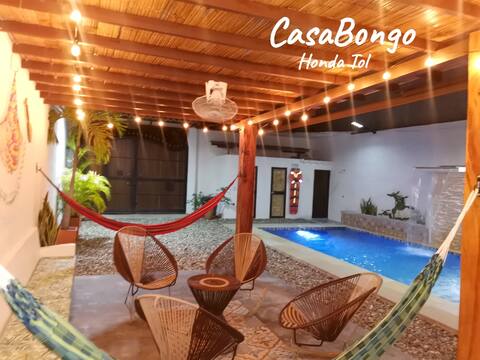
4CasaBongo, alojamiento vacacional con piscina
Entire Place • 4 bedrooms

6CasaBonGo/2people/private
Entire Place • 1 bedroom

5CasaBonGo/promo3rooms/entirehouse,private
Entire Place • 4 bedrooms

samuel house
Entire Place • 3 bedrooms

Colonial house / WIFI, Pool, BBQ.
Entire Place • 3 bedrooms
Note: Performance varies based on location, size, amenities, seasonality, and management quality. Data reflects the past 12 months.
Top Performing Airbnb Hosts in Honda (2026)
Learn from the best! This table showcases top-performing Airbnb hosts in Honda based on the number of properties managed and estimated total revenue over the past year. Analyze their scale and performance metrics.
| Host Name | Properties | Grossing Revenue | Stay Reviews | Avg Rating |
|---|---|---|---|---|
| Kely | 4 | $128,349 | 169 | 4.97/5.0 |
| Santiago | 3 | $81,883 | 260 | 4.85/5.0 |
| Nadia | 8 | $67,938 | 167 | 4.86/5.0 |
| Mayra Dileydy | 2 | $47,547 | 33 | 4.79/5.0 |
| Jose Filadelfo | 2 | $40,622 | 29 | 4.74/5.0 |
| Jaime | 1 | $38,760 | 22 | 4.86/5.0 |
| Vincent | 3 | $33,577 | 28 | 5.00/5.0 |
| Vivi Orozco | 1 | $29,799 | 39 | 4.92/5.0 |
| Maria | 2 | $29,674 | 205 | 4.97/5.0 |
| Diana Maria | 1 | $29,325 | 12 | 4.67/5.0 |
Analyzing the strategies of top hosts, such as their property selection, pricing, and guest communication, can offer valuable lessons for optimizing your own Airbnb operations in Honda.
Dive Deeper: Advanced Honda STR Market Data (2026)
Ready to unlock more insights? AirROI provides access to advanced metrics and comprehensive Airbnb data for Honda. Explore detailed analytics beyond this report to refine your investment strategy, optimize pricing, and maximize your vacation rental profits.
Explore Advanced MetricsHonda Short-Term Rental Market Composition (2026): Property & Room Types
Room Type Distribution
Property Type Distribution
Market Composition Insights for Honda
- The Honda Airbnb market composition is heavily skewed towards Entire Home/Apt listings, which make up 79.9% of the 144 active rentals. This indicates strong guest preference for privacy and space.
- Looking at the property type distribution in Honda, House properties are the most common (76.4%), reflecting the local real estate landscape.
- Houses represent a significant 76.4% portion, catering likely to families or larger groups.
- The presence of 13.2% Hotel/Boutique listings indicates integration with traditional hospitality.
- Smaller segments like outdoor/unique, apartment/condo, others (combined 10.5%) offer potential for unique stay experiences.
Honda Airbnb Room Capacity Analysis (2026): Bedroom Distribution
Distribution of Listings by Number of Bedrooms
Room Capacity Insights for Honda
- The dominant room capacity in Honda is 3 bedrooms listings, making up 27.8% of the market. This suggests a strong demand for properties suitable for families or small groups.
- Together, 3 bedrooms and 4 bedrooms properties represent 52.8% of the active Airbnb listings in Honda, indicating a high concentration in these sizes.
- A significant 66.0% of listings offer 3+ bedrooms, catering to larger groups and families seeking more space in Honda.
Honda Vacation Rental Guest Capacity Trends (2026)
Distribution of Listings by Guest Capacity
Guest Capacity Insights for Honda
- The most common guest capacity trend in Honda vacation rentals is listings accommodating 8+ guests (57.6%). This suggests the primary traveler segment is likely larger groups.
- Properties designed for 8+ guests and 2 guests dominate the Honda STR market, accounting for 65.9% of listings.
- 70.8% of properties accommodate 6+ guests, serving the market segment for larger families or group travel in Honda.
- On average, properties in Honda are equipped to host 6.0 guests.
Honda Airbnb Booking Patterns (2026): Available vs. Booked Days
Available Days Distribution
Booked Days Distribution
Booking Pattern Insights for Honda
- The most common availability pattern in Honda falls within the 271-366 days range, representing 82.6% of listings. This suggests many properties have significant open periods on their calendars.
- Approximately 96.5% of listings show high availability (181+ days open annually), indicating potential for increased bookings or specific owner usage patterns.
- For booked days, the 31-90 days range is most frequent in Honda (43.8%), reflecting common guest stay durations or potential owner blocking patterns.
- A notable 3.5% of properties secure long booking periods (181+ days booked per year), highlighting successful long-term rental strategies or significant owner usage.
Honda Airbnb Minimum Stay Requirements Analysis
Distribution of Listings by Minimum Night Requirement
1 Night
91 listings
63.2% of total
2 Nights
26 listings
18.1% of total
30+ Nights
27 listings
18.8% of total
Key Insights
- The most prevalent minimum stay requirement in Honda is 1 Night, adopted by 63.2% of listings. This highlights the market's preference for shorter, flexible bookings.
- A strong majority (81.3%) of the Honda Airbnb data shows acceptance of very short stays (1-2 nights), indicating a dynamic, high-turnover market.
- A significant segment (18.8%) caters to monthly stays (30+ nights) in Honda, pointing to opportunities in the extended-stay market.
Recommendations
- Align with the market by considering a 1 Night minimum stay, as 63.2% of Honda hosts use this setting.
- Explore offering discounts for stays of 30+ nights to attract the 18.8% of the market seeking extended stays.
- Adjust minimum nights based on seasonality – potentially shorter during low season and longer during peak demand periods in Honda.
Honda Airbnb Cancellation Policy Trends Analysis (2026)
Limited
3 listings
2.1% of total
Flexible
59 listings
41% of total
Moderate
23 listings
16% of total
Firm
54 listings
37.5% of total
Strict
5 listings
3.5% of total
Cancellation Policy Insights for Honda
- The prevailing Airbnb cancellation policy trend in Honda is Flexible, used by 41% of listings.
- There's a relatively balanced mix between guest-friendly (57.0%) and stricter (41.0%) policies, offering choices for different guest needs.
- Strict cancellation policies are quite rare (3.5%), potentially making listings with this policy less competitive unless justified by high demand or property type.
Recommendations for Hosts
- Consider adopting a Flexible policy to align with the 41% market standard in Honda.
- Using a Strict policy might deter some guests, as only 3.5% of listings use it. Evaluate if potential revenue protection outweighs possible lower booking rates.
- Regularly review your cancellation policy against competitors and market demand shifts in Honda.
Honda STR Booking Lead Time Analysis (2026)
Average Booking Lead Time by Month
Booking Lead Time Insights for Honda
- The overall average booking lead time for vacation rentals in Honda is 30 days.
- Guests book furthest in advance for stays during December (average 56 days), likely coinciding with peak travel demand or local events.
- The shortest booking windows occur for stays in March (average 16 days), indicating more last-minute travel plans during this time.
- Seasonally, Winter (36 days avg.) sees the longest lead times, while Summer (20 days avg.) has the shortest, reflecting typical travel planning cycles.
Recommendations for Hosts
- Use the overall average lead time (30 days) as a baseline for your pricing and availability strategy in Honda.
- For December stays, consider implementing length-of-stay discounts or slightly higher rates for bookings made less than 56 days out to capitalize on advance planning.
- Target marketing efforts for the Winter season well in advance (at least 36 days) to capture early planners.
- Monitor your own booking lead times against these Honda averages to identify opportunities for dynamic pricing adjustments.
Popular & Essential Airbnb Amenities in Honda (2026)
Amenity Prevalence
Amenity Insights for Honda
- Popular amenities like Wifi, Kitchen, TV are common but not universal. Offering these can provide a competitive edge.
- A pool is a highly desired but not standard amenity, making it a key feature for attracting guests seeking leisure in Honda.
- Warning: Wifi is not universally provided but is considered essential globally. Ensure reliable Wifi is offered.
Recommendations for Hosts
- Consider adding popular differentiators like Wifi or Kitchen to increase appeal.
- Highlight unique or less common amenities you offer (e.g., hot tub, dedicated workspace, EV charger) in your listing description and photos.
- Regularly check competitor amenities in Honda to stay competitive.
Honda Airbnb Guest Demographics & Profile Analysis (2026)
Guest Profile Summary for Honda
- The typical guest profile for Airbnb in Honda consists of primarily domestic travelers (79%), often arriving from nearby Bogotá, typically belonging to the Post-2000s (Gen Z/Alpha) group (50%), primarily speaking Spanish or English.
- Domestic travelers account for 78.7% of guests.
- Key international markets include Colombia (78.7%) and United States (5.7%).
- Top languages spoken are Spanish (48.2%) followed by English (36.2%).
- A significant demographic segment is the Post-2000s (Gen Z/Alpha) group, representing 50% of guests.
Recommendations for Hosts
- Target domestic marketing efforts towards travelers from Bogotá and Bogota.
- Tailor amenities and listing descriptions to appeal to the dominant Post-2000s (Gen Z/Alpha) demographic (e.g., highlight fast WiFi, smart home features, local guides).
- Highlight unique local experiences or amenities relevant to the primary guest profile.
- Consider seasonal promotions aligned with peak travel times for key origin markets.
Nearby Short-Term Rental Market Comparison
How does the Honda Airbnb market stack up against its neighbors? Compare key performance metrics like average monthly revenue, ADR, and occupancy rates in surrounding areas to understand the broader regional STR landscape.
| Market | Active Properties | Monthly Revenue | Daily Rate | Avg. Occupancy |
|---|---|---|---|---|
| San Nicolás | 18 | $3,446 | $345.12 | 34% |
| Cauca Viejo | 26 | $2,181 | $298.12 | 27% |
| Córdoba | 23 | $1,794 | $269.01 | 22% |
| Anapoima | 286 | $1,775 | $279.24 | 26% |
| Popalito | 10 | $1,529 | $250.41 | 22% |
| Apulo | 105 | $1,505 | $270.37 | 22% |
| Cundinamarca | 11 | $1,424 | $201.05 | 23% |
| La Pintada | 20 | $1,381 | $258.80 | 24% |
| Fredonia | 14 | $1,284 | $201.88 | 23% |
| Antioquia | 13 | $1,267 | $292.11 | 23% |