Navarro Airbnb Market Analysis 2026: Short Term Rental Data & Vacation Rental Statistics in Valle del Cauca, Colombia
Is Airbnb profitable in Navarro in 2026? Explore comprehensive Airbnb analytics for Navarro, Valle del Cauca, Colombia to uncover income potential. This 2026 STR market report for Navarro, based on AirROI data from February 2025 to January 2026, reveals key trends in the niche market of 20 active listings.
Whether you're considering an Airbnb investment in Navarro, optimizing your existing vacation rental, or exploring rental arbitrage opportunities, understanding the Navarro Airbnb data is crucial. Navigating the high regulation landscape is key to maximizing your short term rental income potential. Let's dive into the specifics.
Key Navarro Airbnb Performance Metrics Overview
Monthly Airbnb Revenue Variations & Income Potential in Navarro (2026)
Understanding the monthly revenue variations for Airbnb listings in Navarro is key to maximizing your short term rental income potential. Seasonality significantly impacts earnings. Our analysis, based on data from the past 12 months, shows that the peak revenue month for STRs in Navarro is typically December, while February often presents the lowest earnings, highlighting opportunities for strategic pricing adjustments during shoulder and low seasons. Explore the typical Airbnb income in Navarro across different performance tiers:
- Best-in-class properties (Top 10%) achieve $966+ monthly, often utilizing dynamic pricing and superior guest experiences.
- Strong performing properties (Top 25%) earn $726 or more, indicating effective management and desirable locations/amenities.
- Typical properties (Median) generate around $445 per month, representing the average market performance.
- Entry-level properties (Bottom 25%) see earnings around $178, often with potential for optimization.
Average Monthly Airbnb Earnings Trend in Navarro
Navarro Airbnb Occupancy Rate Trends (2026)
Maximize your bookings by understanding the Navarro STR occupancy trends. Seasonal demand shifts significantly influence how often properties are booked. Typically, Decembersees the highest demand (peak season occupancy), while May experiences the lowest (low season). Effective strategies, like adjusting minimum stays or offering promotions, can boost occupancy during slower periods. Here's how different property tiers perform in Navarro:
- Best-in-class properties (Top 10%) achieve 78%+ occupancy, indicating high desirability and potentially optimized availability.
- Strong performing properties (Top 25%) maintain 64% or higher occupancy, suggesting good market fit and guest satisfaction.
- Typical properties (Median) have an occupancy rate around 38%.
- Entry-level properties (Bottom 25%) average 16% occupancy, potentially facing higher vacancy.
Average Monthly Occupancy Rate Trend in Navarro
Average Daily Rate (ADR) Airbnb Trends in Navarro (2026)
Effective short term rental pricing strategy in Navarro involves understanding monthly ADR fluctuations. The Average Daily Rate (ADR) for Airbnb in Navarro typically peaks in January and dips lowest during February. Leveraging Airbnb dynamic pricing tools or strategies based on this seasonality can significantly boost revenue. Here's a look at the typical nightly rates achieved:
- Best-in-class properties (Top 10%) command rates of $59+ per night, often due to premium features or locations.
- Strong performing properties (Top 25%) achieve nightly rates of $42 or more.
- Typical properties (Median) charge around $34 per night.
- Entry-level properties (Bottom 25%) earn around $27 per night.
Average Daily Rate (ADR) Trend by Month in Navarro
Get Live Navarro Market Intelligence 👇

Explore Real-time Analytics
Airbnb Seasonality Analysis & Trends in Navarro (2026)
Peak Season (December, January, March)
- Revenue averages $659 per month
- Occupancy rates average 50.0%
- Daily rates average $37
Shoulder Season
- Revenue averages $465 per month
- Occupancy maintains around 40.0%
- Daily rates hold near $37
Low Season (February, April, August)
- Revenue drops to average $387 per month
- Occupancy decreases to average 38.4%
- Daily rates adjust to average $36
Seasonality Insights for Navarro
- The Airbnb seasonality in Navarro shows highly seasonal trends requiring careful strategy. While the sections above show seasonal averages, it's also insightful to look at the extremes:
- During the high season, the absolute peak month showcases Navarro's highest earning potential, with monthly revenues capable of climbing to $792, occupancy reaching a high of 59.9%, and ADRs peaking at $39.
- Conversely, the slowest single month of the year, typically falling within the low season, marks the market's lowest point. In this month, revenue might dip to $354, occupancy could drop to 36.4%, and ADRs may adjust down to $35.
- Understanding both the seasonal averages and these monthly peaks and troughs in revenue, occupancy, and ADR is crucial for maximizing your Airbnb profit potential in Navarro.
Seasonal Strategies for Maximizing Profit
- Peak Season: Maximize revenue through premium pricing and potentially longer minimum stays. Ensure high availability.
- Low Season: Offer competitive pricing, special promotions (e.g., extended stay discounts), and flexible cancellation policies. Target off-season travelers like remote workers or budget-conscious guests.
- Shoulder Seasons: Implement dynamic pricing that balances peak and low rates. Target weekend travelers or specific events. Offer slightly more flexible terms than peak season.
- Regularly analyze your own performance against these Navarro seasonality benchmarks and adjust your pricing and availability strategy accordingly.
Best Areas for Airbnb Investment in Navarro (2026)
Exploring the top neighborhoods for short-term rentals in Navarro? This section highlights key areas, outlining why they are attractive for hosts and guests, along with notable local attractions. Consider these locations based on your target guest profile and investment strategy.
| Neighborhood / Area | Why Host Here? (Target Guests & Appeal) | Key Attractions & Landmarks |
|---|---|---|
| Palmira | A vibrant city known for its agriculture and cultural events. Easily accessible from Cali, making it attractive to visitors looking for a more local experience while still close to urban amenities. | Palmira Cultural Center, Parque de los Fundadores, Palmira Zoo, Catedral de Palmira, Cerro de las Tres Cruces |
| Cali | The capital of Valle del Cauca known for salsa dancing and rich cultural heritage. A major urban center with many attractions for tourists, making it an excellent choice for Airbnb hosting. | Zoológico de Cali, Cristo Rey, La Feria de Cali, San Antonio, Parque de los Gato |
| La Victoria | A calm and relaxing rural area near the river. Offers a peaceful retreat for travelers looking to escape the hustle and bustle of the city with beautiful natural scenery. | Cañón del Cauca, Cascada El Yeso, Sendero Ecoturístico, Balsa de La Victoria |
| Yumbo | An industrial town close to Cali, known for its industrial zones and as a residential area. Attracts business travelers and visitors to nearby attractions. | Parque de Yumbo, Iglesia San José, Centro Comercial Unico, Parque de las Flores |
| Dagua | A small municipality known for its nature and proximity to the Pacific Coast. Ideal for nature lovers and those seeking outdoor adventure. | Parque Nacional Natural Farallones de Cali, Río Dagua, Sendero El Cielo |
| El Cerrito | A small town surrounded by nature, known for its coffee culture and rural tourism. Perfect for eco-tourism and visitors looking for an authentic coffee experience. | Finca El Trapiche, Café El Cerrito, Parque Natural La Noche, Cascada La Chorrera |
| Tuluá | A vibrant town with a strong sense of community and rich history. Offers cultural experiences and is also known for its festivals throughout the year. | Parque de Tuluá, Iglesia de Tuluá, La Casa de la Cultura, Balneario La Palma |
| Restrepo | A small town with a focus on agriculture and community. Provides visitors an opportunity to experience rural life and local traditions. | Parque Los Fundadores, Iglesia Restrepo, Finca Santa Rita, Sendero ecológico La Loma |
Understanding Airbnb License Requirements & STR Laws in Navarro (2026)
Yes, Navarro, Valle del Cauca, Colombia enforces high STR regulations. Obtaining a license and ensuring compliance is almost certainly required according to current 2026 STR laws. Always verify the latest short term rental regulations and Airbnb license requirements directly with local government authorities for Navarro to ensure full compliance before hosting.
(Source: AirROI data, 2026, based on 80% licensed listings)
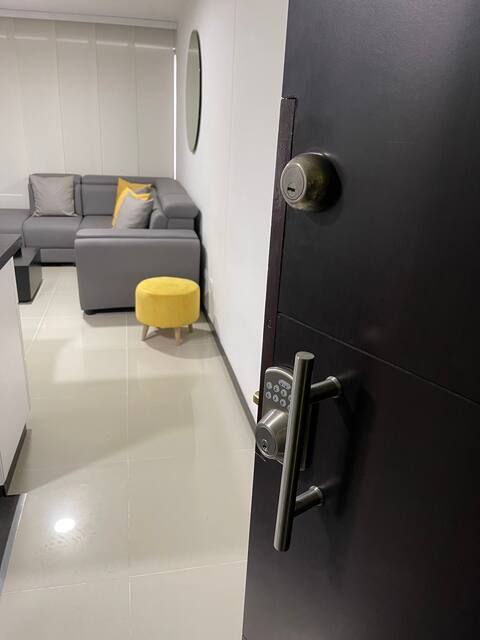
Top Performing Airbnb Properties in Navarro (2026)
Benchmark your potential! Explore examples of top-performing Airbnb properties in Navarrobased on Trailing Twelve Month (TTM) revenue. Analyze their characteristics, revenue, occupancy rate, and ADR to understand what drives success in this market.
Beautiful apartment in Valle del Lili with AC
Entire Place • 3 bedrooms
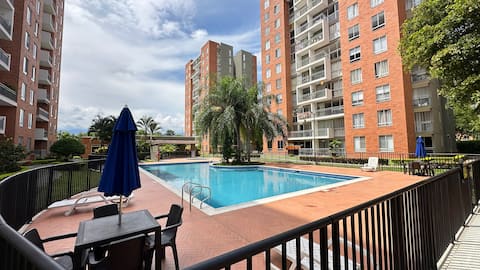
Beautiful new apartment with a pool and security
Entire Place • 3 bedrooms

The Branch of Heaven
Entire Place • 3 bedrooms

El Encanto Dos, experience something unforgettable in Cali
Entire Place • 2 bedrooms

Cali Stay
Entire Place • 2 bedrooms
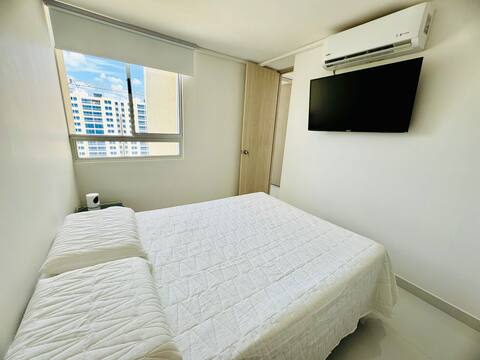
New apartment with air conditioning south Cali
Entire Place • 3 bedrooms
Note: Performance varies based on location, size, amenities, seasonality, and management quality. Data reflects the past 12 months.
Top Performing Airbnb Hosts in Navarro (2026)
Learn from the best! This table showcases top-performing Airbnb hosts in Navarro based on the number of properties managed and estimated total revenue over the past year. Analyze their scale and performance metrics.
| Host Name | Properties | Grossing Revenue | Stay Reviews | Avg Rating |
|---|---|---|---|---|
| Pilar | 1 | $11,013 | 51 | 4.94/5.0 |
| Catherine | 1 | $7,684 | 82 | 4.85/5.0 |
| Armando | 1 | $7,626 | 159 | 4.68/5.0 |
| Jorge Alberto | 1 | $5,816 | 90 | 4.84/5.0 |
| Ronald | 1 | $5,523 | 39 | 4.87/5.0 |
| Camilo | 1 | $3,891 | 20 | 4.70/5.0 |
| Troy | 1 | $3,885 | 5 | 5.00/5.0 |
| Mayra Alejandra | 1 | $3,533 | 14 | 4.93/5.0 |
| Alex | 1 | $3,403 | 2 | Not Rated |
| Andrea | 1 | $3,179 | 124 | 4.77/5.0 |
Analyzing the strategies of top hosts, such as their property selection, pricing, and guest communication, can offer valuable lessons for optimizing your own Airbnb operations in Navarro.
Dive Deeper: Advanced Navarro STR Market Data (2026)
Ready to unlock more insights? AirROI provides access to advanced metrics and comprehensive Airbnb data for Navarro. Explore detailed analytics beyond this report to refine your investment strategy, optimize pricing, and maximize your vacation rental profits.
Explore Advanced MetricsNavarro Short-Term Rental Market Composition (2026): Property & Room Types
Room Type Distribution
Property Type Distribution
Market Composition Insights for Navarro
- The Navarro Airbnb market composition is heavily skewed towards Entire Home/Apt listings, which make up 100% of the 20 active rentals. This indicates strong guest preference for privacy and space.
- Looking at the property type distribution in Navarro, Apartment/Condo properties are the most common (100%), reflecting the local real estate landscape.
Navarro Airbnb Room Capacity Analysis (2026): Bedroom Distribution
Distribution of Listings by Number of Bedrooms
Room Capacity Insights for Navarro
- The dominant room capacity in Navarro is 2 bedrooms listings, making up 50% of the market. This suggests a strong demand for properties suitable for couples or solo travelers.
- Together, 2 bedrooms and 3 bedrooms properties represent 95.0% of the active Airbnb listings in Navarro, indicating a high concentration in these sizes.
- A significant 45.0% of listings offer 3+ bedrooms, catering to larger groups and families seeking more space in Navarro.
Navarro Vacation Rental Guest Capacity Trends (2026)
Distribution of Listings by Guest Capacity
Guest Capacity Insights for Navarro
- The most common guest capacity trend in Navarro vacation rentals is listings accommodating 4 guests (40%). This suggests the primary traveler segment is likely small families or groups.
- Properties designed for 4 guests and 6 guests dominate the Navarro STR market, accounting for 75.0% of listings.
- 35.0% of properties accommodate 6+ guests, serving the market segment for larger families or group travel in Navarro.
- On average, properties in Navarro are equipped to host 4.8 guests.
Navarro Airbnb Booking Patterns (2026): Available vs. Booked Days
Available Days Distribution
Booked Days Distribution
Booking Pattern Insights for Navarro
- The most common availability pattern in Navarro falls within the 271-366 days range, representing 50% of listings. This suggests many properties have significant open periods on their calendars.
- Approximately 90.0% of listings show high availability (181+ days open annually), indicating potential for increased bookings or specific owner usage patterns.
- For booked days, the 91-180 days range is most frequent in Navarro (40%), reflecting common guest stay durations or potential owner blocking patterns.
- A notable 10.0% of properties secure long booking periods (181+ days booked per year), highlighting successful long-term rental strategies or significant owner usage.
Navarro Airbnb Minimum Stay Requirements Analysis
Distribution of Listings by Minimum Night Requirement
1 Night
2 listings
10% of total
2 Nights
3 listings
15% of total
3 Nights
1 listings
5% of total
4-6 Nights
3 listings
15% of total
7-29 Nights
4 listings
20% of total
30+ Nights
7 listings
35% of total
Key Insights
- The most prevalent minimum stay requirement in Navarro is 30+ Nights, adopted by 35% of listings. This highlights the market's preference for longer commitments.
- A significant segment (35%) caters to monthly stays (30+ nights) in Navarro, pointing to opportunities in the extended-stay market.
Recommendations
- Align with the market by considering a 30+ Nights minimum stay, as 35% of Navarro hosts use this setting.
- If feasible, allowing 1-night stays, especially midweek or during low season, could capture last-minute bookings, as only 10% currently do.
- Explore offering discounts for stays of 30+ nights to attract the 35% of the market seeking extended stays.
- Adjust minimum nights based on seasonality – potentially shorter during low season and longer during peak demand periods in Navarro.
Navarro Airbnb Cancellation Policy Trends Analysis (2026)
Limited
2 listings
10% of total
Flexible
4 listings
20% of total
Moderate
6 listings
30% of total
Firm
6 listings
30% of total
Strict
2 listings
10% of total
Cancellation Policy Insights for Navarro
- The prevailing Airbnb cancellation policy trend in Navarro is Moderate, used by 30% of listings.
- There's a relatively balanced mix between guest-friendly (50.0%) and stricter (40.0%) policies, offering choices for different guest needs.
Recommendations for Hosts
- Consider adopting a Moderate policy to align with the 30% market standard in Navarro.
- Using a Strict policy might deter some guests, as only 10% of listings use it. Evaluate if potential revenue protection outweighs possible lower booking rates.
- Regularly review your cancellation policy against competitors and market demand shifts in Navarro.
Navarro STR Booking Lead Time Analysis (2026)
Average Booking Lead Time by Month
Booking Lead Time Insights for Navarro
- The overall average booking lead time for vacation rentals in Navarro is 32 days.
- Guests book furthest in advance for stays during December (average 92 days), likely coinciding with peak travel demand or local events.
- The shortest booking windows occur for stays in November (average 5 days), indicating more last-minute travel plans during this time.
- Seasonally, Winter (54 days avg.) sees the longest lead times, while Fall (11 days avg.) has the shortest, reflecting typical travel planning cycles.
Recommendations for Hosts
- Use the overall average lead time (32 days) as a baseline for your pricing and availability strategy in Navarro.
- For December stays, consider implementing length-of-stay discounts or slightly higher rates for bookings made less than 92 days out to capitalize on advance planning.
- During November, focus on last-minute booking availability and promotions, as guests book with very short notice (5 days avg.).
- Target marketing efforts for the Winter season well in advance (at least 54 days) to capture early planners.
- Monitor your own booking lead times against these Navarro averages to identify opportunities for dynamic pricing adjustments.
Popular & Essential Airbnb Amenities in Navarro (2026)
Amenity Prevalence
Amenity Insights for Navarro
- Essential amenities in Navarro that guests expect include: TV, Wifi, Washer, Kitchen. Lacking these (any) could significantly impact bookings.
- Popular amenities like Free parking on premises, Pool, Pets allowed are common but not universal. Offering these can provide a competitive edge.
- A pool is a highly desired but not standard amenity, making it a key feature for attracting guests seeking leisure in Navarro.
Recommendations for Hosts
- Ensure your listing includes all essential amenities for Navarro: TV, Wifi, Washer, Kitchen.
- Prioritize adding missing essentials: Kitchen.
- Consider adding popular differentiators like Free parking on premises or Pool to increase appeal.
- Highlight unique or less common amenities you offer (e.g., hot tub, dedicated workspace, EV charger) in your listing description and photos.
- Regularly check competitor amenities in Navarro to stay competitive.
Navarro Airbnb Guest Demographics & Profile Analysis (2026)
Guest Profile Summary for Navarro
- The typical guest profile for Airbnb in Navarro consists of a mix of domestic (61%) and international guests, often arriving from nearby Bogotá, typically belonging to the Post-2000s (Gen Z/Alpha) group (50%), primarily speaking Spanish or English.
- Domestic travelers account for 60.5% of guests.
- Key international markets include Colombia (60.5%) and United States (23.7%).
- Top languages spoken are Spanish (51.9%) followed by English (36.5%).
- A significant demographic segment is the Post-2000s (Gen Z/Alpha) group, representing 50% of guests.
Recommendations for Hosts
- Target domestic marketing efforts towards travelers from Bogotá and Cali.
- Tailor amenities and listing descriptions to appeal to the dominant Post-2000s (Gen Z/Alpha) demographic (e.g., highlight fast WiFi, smart home features, local guides).
- Highlight unique local experiences or amenities relevant to the primary guest profile.
- Consider seasonal promotions aligned with peak travel times for key origin markets.
Nearby Short-Term Rental Market Comparison
How does the Navarro Airbnb market stack up against its neighbors? Compare key performance metrics like average monthly revenue, ADR, and occupancy rates in surrounding areas to understand the broader regional STR landscape.
| Market | Active Properties | Monthly Revenue | Daily Rate | Avg. Occupancy |
|---|---|---|---|---|
| La Buitrera | 15 | $1,161 | $146.95 | 26% |
| Calima Lake | 18 | $775 | $217.48 | 16% |
| Quimbaya | 193 | $756 | $133.90 | 24% |
| Calima | 196 | $699 | $178.59 | 17% |
| El Cerrito | 55 | $675 | $124.19 | 22% |
| Restrepo | 20 | $670 | $179.01 | 19% |
| Alcalá | 29 | $633 | $204.86 | 18% |
| Pance | 28 | $625 | $81.74 | 34% |
| Montenegro | 276 | $618 | $136.40 | 23% |
| La Tebaida | 219 | $568 | $115.52 | 25% |