Tuluá Airbnb Market Analysis 2026: Short Term Rental Data & Vacation Rental Statistics in Valle del Cauca, Colombia
Is Airbnb profitable in Tuluá in 2026? Explore comprehensive Airbnb analytics for Tuluá, Valle del Cauca, Colombia to uncover income potential. This 2026 STR market report for Tuluá, based on AirROI data from February 2025 to January 2026, reveals key trends in the niche market of 58 active listings.
Whether you're considering an Airbnb investment in Tuluá, optimizing your existing vacation rental, or exploring rental arbitrage opportunities, understanding the Tuluá Airbnb data is crucial. Navigating the high regulation landscape is key to maximizing your short term rental income potential. Let's dive into the specifics.
Key Tuluá Airbnb Performance Metrics Overview
Monthly Airbnb Revenue Variations & Income Potential in Tuluá (2026)
Understanding the monthly revenue variations for Airbnb listings in Tuluá is key to maximizing your short term rental income potential. Seasonality significantly impacts earnings. Our analysis, based on data from the past 12 months, shows that the peak revenue month for STRs in Tuluá is typically December, while February often presents the lowest earnings, highlighting opportunities for strategic pricing adjustments during shoulder and low seasons. Explore the typical Airbnb income in Tuluá across different performance tiers:
- Best-in-class properties (Top 10%) achieve $798+ monthly, often utilizing dynamic pricing and superior guest experiences.
- Strong performing properties (Top 25%) earn $409 or more, indicating effective management and desirable locations/amenities.
- Typical properties (Median) generate around $192 per month, representing the average market performance.
- Entry-level properties (Bottom 25%) see earnings around $70, often with potential for optimization.
Average Monthly Airbnb Earnings Trend in Tuluá
Tuluá Airbnb Occupancy Rate Trends (2026)
Maximize your bookings by understanding the Tuluá STR occupancy trends. Seasonal demand shifts significantly influence how often properties are booked. Typically, Decembersees the highest demand (peak season occupancy), while May experiences the lowest (low season). Effective strategies, like adjusting minimum stays or offering promotions, can boost occupancy during slower periods. Here's how different property tiers perform in Tuluá:
- Best-in-class properties (Top 10%) achieve 60%+ occupancy, indicating high desirability and potentially optimized availability.
- Strong performing properties (Top 25%) maintain 39% or higher occupancy, suggesting good market fit and guest satisfaction.
- Typical properties (Median) have an occupancy rate around 18%.
- Entry-level properties (Bottom 25%) average 8% occupancy, potentially facing higher vacancy.
Average Monthly Occupancy Rate Trend in Tuluá
Average Daily Rate (ADR) Airbnb Trends in Tuluá (2026)
Effective short term rental pricing strategy in Tuluá involves understanding monthly ADR fluctuations. The Average Daily Rate (ADR) for Airbnb in Tuluá typically peaks in December and dips lowest during March. Leveraging Airbnb dynamic pricing tools or strategies based on this seasonality can significantly boost revenue. Here's a look at the typical nightly rates achieved:
- Best-in-class properties (Top 10%) command rates of $77+ per night, often due to premium features or locations.
- Strong performing properties (Top 25%) achieve nightly rates of $44 or more.
- Typical properties (Median) charge around $28 per night.
- Entry-level properties (Bottom 25%) earn around $20 per night.
Average Daily Rate (ADR) Trend by Month in Tuluá
Get Live Tuluá Market Intelligence 👇

Explore Real-time Analytics
Airbnb Seasonality Analysis & Trends in Tuluá (2026)
Peak Season (December, January, August)
- Revenue averages $445 per month
- Occupancy rates average 30.7%
- Daily rates average $49
Shoulder Season
- Revenue averages $290 per month
- Occupancy maintains around 25.7%
- Daily rates hold near $47
Low Season (February, May, November)
- Revenue drops to average $215 per month
- Occupancy decreases to average 22.7%
- Daily rates adjust to average $47
Seasonality Insights for Tuluá
- The Airbnb seasonality in Tuluá shows highly seasonal trends requiring careful strategy. While the sections above show seasonal averages, it's also insightful to look at the extremes:
- During the high season, the absolute peak month showcases Tuluá's highest earning potential, with monthly revenues capable of climbing to $571, occupancy reaching a high of 31.6%, and ADRs peaking at $51.
- Conversely, the slowest single month of the year, typically falling within the low season, marks the market's lowest point. In this month, revenue might dip to $189, occupancy could drop to 21.1%, and ADRs may adjust down to $45.
- Understanding both the seasonal averages and these monthly peaks and troughs in revenue, occupancy, and ADR is crucial for maximizing your Airbnb profit potential in Tuluá.
Seasonal Strategies for Maximizing Profit
- Peak Season: Maximize revenue through premium pricing and potentially longer minimum stays. Ensure high availability.
- Low Season: Offer competitive pricing, special promotions (e.g., extended stay discounts), and flexible cancellation policies. Target off-season travelers like remote workers or budget-conscious guests.
- Shoulder Seasons: Implement dynamic pricing that balances peak and low rates. Target weekend travelers or specific events. Offer slightly more flexible terms than peak season.
- Regularly analyze your own performance against these Tuluá seasonality benchmarks and adjust your pricing and availability strategy accordingly.
Best Areas for Airbnb Investment in Tuluá (2026)
Exploring the top neighborhoods for short-term rentals in Tuluá? This section highlights key areas, outlining why they are attractive for hosts and guests, along with notable local attractions. Consider these locations based on your target guest profile and investment strategy.
| Neighborhood / Area | Why Host Here? (Target Guests & Appeal) | Key Attractions & Landmarks |
|---|---|---|
| Centro | The heart of Tuluá, offering easy access to local shops, restaurants, and cultural sites. It's a bustling area perfect for tourists wanting to explore the local culture and community. | Plaza de Bolívar, Iglesia de San Francisco, Museo de Tuluá, local markets, cultural festivals |
| La Avenida | A vibrant area known for its restaurants and nightlife. Popular with visitors looking for entertainment and local cuisine within a lively atmosphere. | Parque Principal, restaurantes locales, barrios de vida nocturna, cafés, eventos locales |
| El Trapiche | A residential neighborhood that offers a more authentic experience, close to nature and with local flavors. Ideal for guests looking to escape the hustle and bustle of city life. | Pueblo Tapao, caminatas naturales, centros de acampar, cultura local, mercados artesanales |
| Tres Esquinas | Known for its tranquility and family-oriented environment, making it suitable for longer stays and family vacations. Provides a different vibe compared to the city center. | parques locales, actividades al aire libre, escuelas de deportes, áreas recreativas, mercados de frutas |
| El Charpo | A growing neighborhood attracting attention for its development and potential. It offers good access to the city and is appealing for those looking to invest in emerging areas. | proyectos community, nuevas construcciones, cercanía al transporte público, centros de compra, expansión urbanística |
| Santa Isabel | A quieter location with a mix of residential and commercial spaces. Good for visitors who prefer a more laid-back experience while still having access to city amenities. | parques comunitarios, servicios locales, eventos culturales, actividades para familias, comidas típicas |
| Los Pinos | A lively neighborhood with a youthful vibe, popular among students and young professionals. It's close to educational institutions and offers convenient access to amenities. | universidades cercanas, bancos de alimentos, cafés, semanas culturales, centros de estudiantes |
| La Isla | A picturesque area that appeals to those looking for scenic beauty and relaxation. Known for its green spaces and calm environment, it's perfect for retreats. | áreas verdes, rutas ecológicas, lagunas cercanas, observación de aves, excursiones |
Understanding Airbnb License Requirements & STR Laws in Tuluá (2026)
Yes, Tuluá, Valle del Cauca, Colombia enforces high STR regulations. Obtaining a license and ensuring compliance is almost certainly required according to current 2026 STR laws. Always verify the latest short term rental regulations and Airbnb license requirements directly with local government authorities for Tuluá to ensure full compliance before hosting.
(Source: AirROI data, 2026, based on 95% licensed listings)
Top Performing Airbnb Properties in Tuluá (2026)
Benchmark your potential! Explore examples of top-performing Airbnb properties in Tuluábased on Trailing Twelve Month (TTM) revenue. Analyze their characteristics, revenue, occupancy rate, and ADR to understand what drives success in this market.

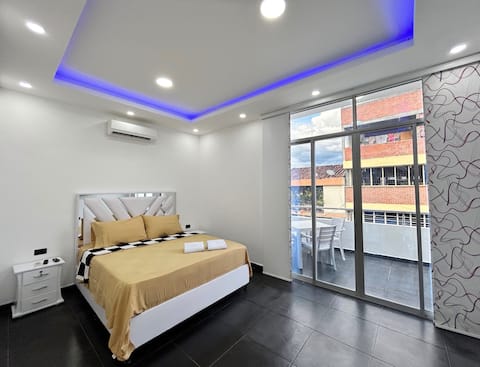
Luxurious penthouse with views
Entire Place • 2 bedrooms

Luxurious house close to everything.
Entire Place • 3 bedrooms

Farm in Tuluá
Entire Place • 1 bedroom
With air conditioning and centrally located in Tuluá.
Entire Place • 1 bedroom

Luxury apartment Tulua Valley.
Entire Place • 1 bedroom

Modern Country House for accommodation and events.
Entire Place • 4 bedrooms
Note: Performance varies based on location, size, amenities, seasonality, and management quality. Data reflects the past 12 months.
Top Performing Airbnb Hosts in Tuluá (2026)
Learn from the best! This table showcases top-performing Airbnb hosts in Tuluá based on the number of properties managed and estimated total revenue over the past year. Analyze their scale and performance metrics.
| Host Name | Properties | Grossing Revenue | Stay Reviews | Avg Rating |
|---|---|---|---|---|
| Paula Andrea | 5 | $13,915 | 123 | 4.85/5.0 |
| Jessica | 1 | $13,447 | 27 | 5.00/5.0 |
| Oscar | 2 | $10,622 | 36 | 4.84/5.0 |
| Yilmar Andrés | 2 | $10,384 | 12 | 4.93/5.0 |
| Daniel | 1 | $10,190 | 71 | 4.99/5.0 |
| Juan David | 2 | $7,853 | 37 | 4.96/5.0 |
| Samuel | 3 | $5,653 | 20 | 4.96/5.0 |
| Melissa | 1 | $4,760 | 3 | 4.33/5.0 |
| Lina | 1 | $4,320 | 30 | 4.73/5.0 |
| Yefersson | 3 | $3,283 | 75 | 4.82/5.0 |
Analyzing the strategies of top hosts, such as their property selection, pricing, and guest communication, can offer valuable lessons for optimizing your own Airbnb operations in Tuluá.
Dive Deeper: Advanced Tuluá STR Market Data (2026)
Ready to unlock more insights? AirROI provides access to advanced metrics and comprehensive Airbnb data for Tuluá. Explore detailed analytics beyond this report to refine your investment strategy, optimize pricing, and maximize your vacation rental profits.
Explore Advanced MetricsTuluá Short-Term Rental Market Composition (2026): Property & Room Types
Room Type Distribution
Property Type Distribution
Market Composition Insights for Tuluá
- The Tuluá Airbnb market composition is heavily skewed towards Entire Home/Apt listings, which make up 79.3% of the 58 active rentals. This indicates strong guest preference for privacy and space.
- Looking at the property type distribution in Tuluá, Apartment/Condo properties are the most common (60.3%), reflecting the local real estate landscape.
- Houses represent a significant 17.2% portion, catering likely to families or larger groups.
- The presence of 15.5% Hotel/Boutique listings indicates integration with traditional hospitality.
- Smaller segments like others, unique stays, outdoor/unique (combined 6.8%) offer potential for unique stay experiences.
Tuluá Airbnb Room Capacity Analysis (2026): Bedroom Distribution
Distribution of Listings by Number of Bedrooms
Room Capacity Insights for Tuluá
- The dominant room capacity in Tuluá is 1 bedroom listings, making up 53.4% of the market. This suggests a strong demand for properties suitable for couples or solo travelers.
- Together, 1 bedroom and 2 bedrooms properties represent 77.5% of the active Airbnb listings in Tuluá, indicating a high concentration in these sizes.
- With over half the market (53.4%) consisting of studios or 1-bedroom units, Tuluá is particularly well-suited for individuals or couples.
Tuluá Vacation Rental Guest Capacity Trends (2026)
Distribution of Listings by Guest Capacity
Guest Capacity Insights for Tuluá
- The most common guest capacity trend in Tuluá vacation rentals is listings accommodating 2 guests (50%). This suggests the primary traveler segment is likely couples or solo travelers.
- Properties designed for 2 guests and 8+ guests dominate the Tuluá STR market, accounting for 62.1% of listings.
- A significant 51.7% of listings cater specifically to 1-2 guests, highlighting strong demand from couples and solo travelers in Tuluá.
- 24.1% of properties accommodate 6+ guests, serving the market segment for larger families or group travel in Tuluá.
- On average, properties in Tuluá are equipped to host 3.7 guests.
Tuluá Airbnb Booking Patterns (2026): Available vs. Booked Days
Available Days Distribution
Booked Days Distribution
Booking Pattern Insights for Tuluá
- The most common availability pattern in Tuluá falls within the 271-366 days range, representing 84.5% of listings. This suggests many properties have significant open periods on their calendars.
- Approximately 94.8% of listings show high availability (181+ days open annually), indicating potential for increased bookings or specific owner usage patterns.
- For booked days, the 1-30 days range is most frequent in Tuluá (48.3%), reflecting common guest stay durations or potential owner blocking patterns.
- A notable 5.2% of properties secure long booking periods (181+ days booked per year), highlighting successful long-term rental strategies or significant owner usage.
Tuluá Airbnb Minimum Stay Requirements Analysis
Distribution of Listings by Minimum Night Requirement
1 Night
38 listings
65.5% of total
2 Nights
9 listings
15.5% of total
3 Nights
2 listings
3.4% of total
30+ Nights
9 listings
15.5% of total
Key Insights
- The most prevalent minimum stay requirement in Tuluá is 1 Night, adopted by 65.5% of listings. This highlights the market's preference for shorter, flexible bookings.
- A strong majority (81.0%) of the Tuluá Airbnb data shows acceptance of very short stays (1-2 nights), indicating a dynamic, high-turnover market.
- A significant segment (15.5%) caters to monthly stays (30+ nights) in Tuluá, pointing to opportunities in the extended-stay market.
Recommendations
- Align with the market by considering a 1 Night minimum stay, as 65.5% of Tuluá hosts use this setting.
- Explore offering discounts for stays of 30+ nights to attract the 15.5% of the market seeking extended stays.
- Adjust minimum nights based on seasonality – potentially shorter during low season and longer during peak demand periods in Tuluá.
Tuluá Airbnb Cancellation Policy Trends Analysis (2026)
Flexible
36 listings
62.1% of total
Moderate
11 listings
19% of total
Firm
11 listings
19% of total
Cancellation Policy Insights for Tuluá
- The prevailing Airbnb cancellation policy trend in Tuluá is Flexible, used by 62.1% of listings.
- The market strongly favors guest-friendly terms, with 81.1% of listings offering Flexible or Moderate policies. This suggests guests in Tuluá may expect booking flexibility.
Recommendations for Hosts
- Consider adopting a Flexible policy to align with the 62.1% market standard in Tuluá.
- Given the high prevalence of Flexible policies (62.1%), offering this can enhance booking appeal, especially during shoulder seasons.
- Regularly review your cancellation policy against competitors and market demand shifts in Tuluá.
Tuluá STR Booking Lead Time Analysis (2026)
Average Booking Lead Time by Month
Booking Lead Time Insights for Tuluá
- The overall average booking lead time for vacation rentals in Tuluá is 15 days.
- Guests book furthest in advance for stays during August (average 26 days), likely coinciding with peak travel demand or local events.
- The shortest booking windows occur for stays in April (average 5 days), indicating more last-minute travel plans during this time.
- Seasonally, Summer (18 days avg.) sees the longest lead times, while Spring (6 days avg.) has the shortest, reflecting typical travel planning cycles.
Recommendations for Hosts
- Use the overall average lead time (15 days) as a baseline for your pricing and availability strategy in Tuluá.
- For August stays, consider implementing length-of-stay discounts or slightly higher rates for bookings made less than 26 days out to capitalize on advance planning.
- During April, focus on last-minute booking availability and promotions, as guests book with very short notice (5 days avg.).
- Target marketing efforts for the Summer season well in advance (at least 18 days) to capture early planners.
- Monitor your own booking lead times against these Tuluá averages to identify opportunities for dynamic pricing adjustments.
Popular & Essential Airbnb Amenities in Tuluá (2026)
Amenity Prevalence
Amenity Insights for Tuluá
- Essential amenities in Tuluá that guests expect include: TV. Lacking these (this) could significantly impact bookings.
- Popular amenities like Wifi, Kitchen, Bed linens are common but not universal. Offering these can provide a competitive edge.
- Warning: Wifi is not universally provided but is considered essential globally. Ensure reliable Wifi is offered.
Recommendations for Hosts
- Ensure your listing includes all essential amenities for Tuluá: TV.
- Prioritize adding missing essentials: TV.
- Consider adding popular differentiators like Wifi or Kitchen to increase appeal.
- Highlight unique or less common amenities you offer (e.g., hot tub, dedicated workspace, EV charger) in your listing description and photos.
- Regularly check competitor amenities in Tuluá to stay competitive.
Tuluá Airbnb Guest Demographics & Profile Analysis (2026)
Guest Profile Summary for Tuluá
- The typical guest profile for Airbnb in Tuluá consists of primarily domestic travelers (68%), often arriving from nearby Cali, typically belonging to the Post-2000s (Gen Z/Alpha) group (50%), primarily speaking Spanish or English.
- Domestic travelers account for 68.3% of guests.
- Key international markets include Colombia (68.3%) and United States (14.4%).
- Top languages spoken are Spanish (54.3%) followed by English (34.8%).
- A significant demographic segment is the Post-2000s (Gen Z/Alpha) group, representing 50% of guests.
Recommendations for Hosts
- Target domestic marketing efforts towards travelers from Cali and Bogotá.
- Tailor amenities and listing descriptions to appeal to the dominant Post-2000s (Gen Z/Alpha) demographic (e.g., highlight fast WiFi, smart home features, local guides).
- Highlight unique local experiences or amenities relevant to the primary guest profile.
- Consider seasonal promotions aligned with peak travel times for key origin markets.
Nearby Short-Term Rental Market Comparison
How does the Tuluá Airbnb market stack up against its neighbors? Compare key performance metrics like average monthly revenue, ADR, and occupancy rates in surrounding areas to understand the broader regional STR landscape.
| Market | Active Properties | Monthly Revenue | Daily Rate | Avg. Occupancy |
|---|---|---|---|---|
| Cauca Viejo | 26 | $2,181 | $298.12 | 27% |
| La Pintada | 20 | $1,381 | $258.80 | 24% |
| Fredonia | 14 | $1,284 | $201.88 | 23% |
| La Buitrera | 15 | $1,161 | $146.95 | 26% |
| Calima Lake | 18 | $775 | $217.48 | 16% |
| Quimbaya | 193 | $756 | $133.90 | 24% |
| Palestina | 54 | $747 | $174.15 | 21% |
| Venecia | 46 | $737 | $212.48 | 16% |
| Calima | 196 | $699 | $178.59 | 17% |
| El Cerrito | 55 | $675 | $124.19 | 22% |