Yumbo Airbnb Market Analysis 2026: Short Term Rental Data & Vacation Rental Statistics in Valle del Cauca, Colombia
Is Airbnb profitable in Yumbo in 2026? Explore comprehensive Airbnb analytics for Yumbo, Valle del Cauca, Colombia to uncover income potential. This 2026 STR market report for Yumbo, based on AirROI data from February 2025 to January 2026, reveals key trends in the niche market of 59 active listings.
Whether you're considering an Airbnb investment in Yumbo, optimizing your existing vacation rental, or exploring rental arbitrage opportunities, understanding the Yumbo Airbnb data is crucial. Navigating the high regulation landscape is key to maximizing your short term rental income potential. Let's dive into the specifics.
Key Yumbo Airbnb Performance Metrics Overview
Monthly Airbnb Revenue Variations & Income Potential in Yumbo (2026)
Understanding the monthly revenue variations for Airbnb listings in Yumbo is key to maximizing your short term rental income potential. Seasonality significantly impacts earnings. Our analysis, based on data from the past 12 months, shows that the peak revenue month for STRs in Yumbo is typically December, while July often presents the lowest earnings, highlighting opportunities for strategic pricing adjustments during shoulder and low seasons. Explore the typical Airbnb income in Yumbo across different performance tiers:
- Best-in-class properties (Top 10%) achieve $1,343+ monthly, often utilizing dynamic pricing and superior guest experiences.
- Strong performing properties (Top 25%) earn $783 or more, indicating effective management and desirable locations/amenities.
- Typical properties (Median) generate around $429 per month, representing the average market performance.
- Entry-level properties (Bottom 25%) see earnings around $188, often with potential for optimization.
Average Monthly Airbnb Earnings Trend in Yumbo
Yumbo Airbnb Occupancy Rate Trends (2026)
Maximize your bookings by understanding the Yumbo STR occupancy trends. Seasonal demand shifts significantly influence how often properties are booked. Typically, Marchsees the highest demand (peak season occupancy), while January experiences the lowest (low season). Effective strategies, like adjusting minimum stays or offering promotions, can boost occupancy during slower periods. Here's how different property tiers perform in Yumbo:
- Best-in-class properties (Top 10%) achieve 66%+ occupancy, indicating high desirability and potentially optimized availability.
- Strong performing properties (Top 25%) maintain 42% or higher occupancy, suggesting good market fit and guest satisfaction.
- Typical properties (Median) have an occupancy rate around 21%.
- Entry-level properties (Bottom 25%) average 11% occupancy, potentially facing higher vacancy.
Average Monthly Occupancy Rate Trend in Yumbo
Average Daily Rate (ADR) Airbnb Trends in Yumbo (2026)
Effective short term rental pricing strategy in Yumbo involves understanding monthly ADR fluctuations. The Average Daily Rate (ADR) for Airbnb in Yumbo typically peaks in December and dips lowest during February. Leveraging Airbnb dynamic pricing tools or strategies based on this seasonality can significantly boost revenue. Here's a look at the typical nightly rates achieved:
- Best-in-class properties (Top 10%) command rates of $199+ per night, often due to premium features or locations.
- Strong performing properties (Top 25%) achieve nightly rates of $117 or more.
- Typical properties (Median) charge around $46 per night.
- Entry-level properties (Bottom 25%) earn around $29 per night.
Average Daily Rate (ADR) Trend by Month in Yumbo
Get Live Yumbo Market Intelligence 👇

Explore Real-time Analytics
Airbnb Seasonality Analysis & Trends in Yumbo (2026)
Peak Season (December, March, April)
- Revenue averages $850 per month
- Occupancy rates average 34.2%
- Daily rates average $92
Shoulder Season
- Revenue averages $643 per month
- Occupancy maintains around 29.2%
- Daily rates hold near $92
Low Season (May, July, September)
- Revenue drops to average $431 per month
- Occupancy decreases to average 24.1%
- Daily rates adjust to average $91
Seasonality Insights for Yumbo
- The Airbnb seasonality in Yumbo shows highly seasonal trends requiring careful strategy. While the sections above show seasonal averages, it's also insightful to look at the extremes:
- During the high season, the absolute peak month showcases Yumbo's highest earning potential, with monthly revenues capable of climbing to $871, occupancy reaching a high of 42.6%, and ADRs peaking at $96.
- Conversely, the slowest single month of the year, typically falling within the low season, marks the market's lowest point. In this month, revenue might dip to $395, occupancy could drop to 20.2%, and ADRs may adjust down to $88.
- Understanding both the seasonal averages and these monthly peaks and troughs in revenue, occupancy, and ADR is crucial for maximizing your Airbnb profit potential in Yumbo.
Seasonal Strategies for Maximizing Profit
- Peak Season: Maximize revenue through premium pricing and potentially longer minimum stays. Ensure high availability.
- Low Season: Offer competitive pricing, special promotions (e.g., extended stay discounts), and flexible cancellation policies. Target off-season travelers like remote workers or budget-conscious guests.
- Shoulder Seasons: Implement dynamic pricing that balances peak and low rates. Target weekend travelers or specific events. Offer slightly more flexible terms than peak season.
- Regularly analyze your own performance against these Yumbo seasonality benchmarks and adjust your pricing and availability strategy accordingly.
Best Areas for Airbnb Investment in Yumbo (2026)
Exploring the top neighborhoods for short-term rentals in Yumbo? This section highlights key areas, outlining why they are attractive for hosts and guests, along with notable local attractions. Consider these locations based on your target guest profile and investment strategy.
| Neighborhood / Area | Why Host Here? (Target Guests & Appeal) | Key Attractions & Landmarks |
|---|---|---|
| Yumbo Centro | The heart of Yumbo, offering easy access to shops, restaurants, and local attractions. Ideal for visitors looking to experience the local culture and vibrant atmosphere, plus close proximity to Cali. | Parque de Yumbo, Plaza de Yumbo, local markets, Catholic Church, museums |
| Las Faldas | A residential area known for its tranquility and beautiful views. Attracts families and travelers seeking a more relaxed stay, away from the hustle and bustle. | Las Faldas Park, Natural viewpoints, local eateries, hiking trails |
| La Fortaleza | A popular area for visitors due to its rich history and architectural beauty. Great for tourists interested in culture and history. | Historical buildings, Art galleries, Cultural events, local shops |
| Vereda La Maria | This area is known for its beautiful natural surroundings and is ideal for eco-tourism. Appeals to nature enthusiasts and those looking for outdoor activities. | Hiking trails, natural parks, wildlife watching |
| El Trapiche | A vibrant neighborhood with local restaurants and activities. A great place for guests to experience authentic Yumbo life. | local markets, community events, food festivals |
| Calle 25 | A lively street with shops and services, attracting both locals and visitors. Perfect for urban explorers who want to be in the middle of the action. | shopping centers, restaurants, cafes, street performances |
| Urbanización La Alborada | A modern residential area that attracts those wanting comfort and convenience, with easy access to transportation and amenities. | parks, shopping areas, transport hubs |
| Sierra Morena | Known for its scenic beauty and tranquility, it attracts visitors looking for relaxation and nature experiences. | nature reserves, serene landscapes, hiking and biking trails |
Understanding Airbnb License Requirements & STR Laws in Yumbo (2026)
Yes, Yumbo, Valle del Cauca, Colombia enforces high STR regulations. Obtaining a license and ensuring compliance is almost certainly required according to current 2026 STR laws. Always verify the latest short term rental regulations and Airbnb license requirements directly with local government authorities for Yumbo to ensure full compliance before hosting.
(Source: AirROI data, 2026, based on 97% licensed listings)
Top Performing Airbnb Properties in Yumbo (2026)
Benchmark your potential! Explore examples of top-performing Airbnb properties in Yumbobased on Trailing Twelve Month (TTM) revenue. Analyze their characteristics, revenue, occupancy rate, and ADR to understand what drives success in this market.
House in Dapa Cali, relaxing Jacuzzi
Entire Place • 4 bedrooms

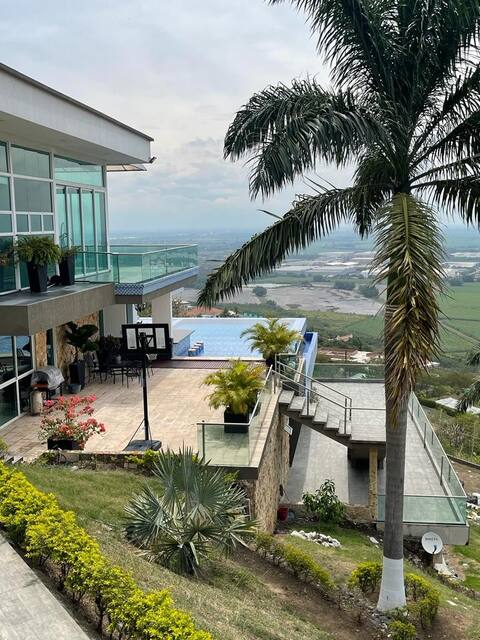
Unique with private pool and view to Cali in Dapa
Entire Place • 7 bedrooms
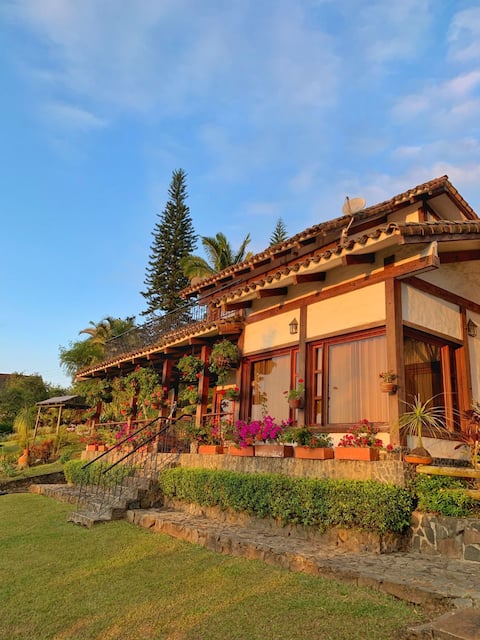
Beautiful country house
Entire Place • 5 bedrooms

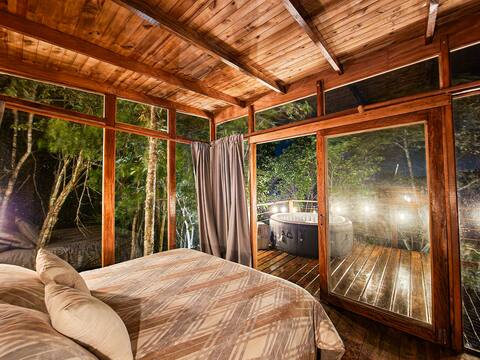
Modern cabin near Cali, in a nature reserve
Entire Place • 2 bedrooms
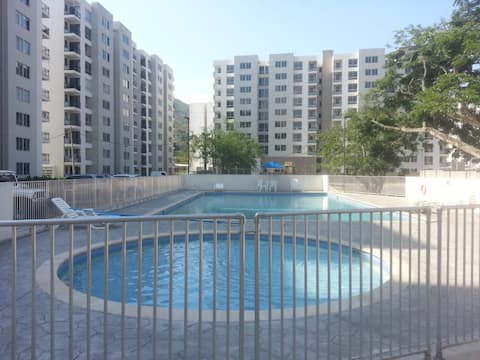
Amazing Entire Condo For You/Todo Para Usted
Entire Place • 3 bedrooms
Trópico Cabin | Dapa | Jacuzzi
Entire Place • 1 bedroom
Note: Performance varies based on location, size, amenities, seasonality, and management quality. Data reflects the past 12 months.
Top Performing Airbnb Hosts in Yumbo (2026)
Learn from the best! This table showcases top-performing Airbnb hosts in Yumbo based on the number of properties managed and estimated total revenue over the past year. Analyze their scale and performance metrics.
| Host Name | Properties | Grossing Revenue | Stay Reviews | Avg Rating |
|---|---|---|---|---|
| Danny | 1 | $28,497 | 21 | 4.90/5.0 |
| Chris | 1 | $18,525 | 20 | 4.50/5.0 |
| Ecoglamping | 3 | $17,628 | 16 | 4.51/5.0 |
| Ramiro | 2 | $14,691 | 168 | 4.95/5.0 |
| Diana Katherine | 1 | $13,791 | 1 | Not Rated |
| Carlos | 1 | $9,444 | 40 | 4.83/5.0 |
| Maria | 2 | $8,561 | 95 | 4.82/5.0 |
| Federico | 1 | $6,580 | 11 | 5.00/5.0 |
| Catalina | 1 | $6,576 | 152 | 4.92/5.0 |
| Valentina | 1 | $6,411 | 1 | Not Rated |
Analyzing the strategies of top hosts, such as their property selection, pricing, and guest communication, can offer valuable lessons for optimizing your own Airbnb operations in Yumbo.
Dive Deeper: Advanced Yumbo STR Market Data (2026)
Ready to unlock more insights? AirROI provides access to advanced metrics and comprehensive Airbnb data for Yumbo. Explore detailed analytics beyond this report to refine your investment strategy, optimize pricing, and maximize your vacation rental profits.
Explore Advanced MetricsYumbo Short-Term Rental Market Composition (2026): Property & Room Types
Room Type Distribution
Property Type Distribution
Market Composition Insights for Yumbo
- The Yumbo Airbnb market composition is heavily skewed towards Entire Home/Apt listings, which make up 88.1% of the 59 active rentals. This indicates strong guest preference for privacy and space.
- Looking at the property type distribution in Yumbo, House properties are the most common (40.7%), reflecting the local real estate landscape.
- Houses represent a significant 40.7% portion, catering likely to families or larger groups.
- The presence of 5.1% Hotel/Boutique listings indicates integration with traditional hospitality.
- Smaller segments like unique stays, others (combined 5.1%) offer potential for unique stay experiences.
Yumbo Airbnb Room Capacity Analysis (2026): Bedroom Distribution
Distribution of Listings by Number of Bedrooms
Room Capacity Insights for Yumbo
- The dominant room capacity in Yumbo is 2 bedrooms listings, making up 28.8% of the market. This suggests a strong demand for properties suitable for couples or solo travelers.
- Together, 2 bedrooms and 1 bedroom properties represent 50.8% of the active Airbnb listings in Yumbo, indicating a high concentration in these sizes.
- A significant 39.0% of listings offer 3+ bedrooms, catering to larger groups and families seeking more space in Yumbo.
Yumbo Vacation Rental Guest Capacity Trends (2026)
Distribution of Listings by Guest Capacity
Guest Capacity Insights for Yumbo
- The most common guest capacity trend in Yumbo vacation rentals is listings accommodating 8+ guests (23.7%). This suggests the primary traveler segment is likely larger groups.
- Properties designed for 8+ guests and 4 guests dominate the Yumbo STR market, accounting for 45.7% of listings.
- 39.0% of properties accommodate 6+ guests, serving the market segment for larger families or group travel in Yumbo.
- On average, properties in Yumbo are equipped to host 4.7 guests.
Yumbo Airbnb Booking Patterns (2026): Available vs. Booked Days
Available Days Distribution
Booked Days Distribution
Booking Pattern Insights for Yumbo
- The most common availability pattern in Yumbo falls within the 271-366 days range, representing 83.1% of listings. This suggests many properties have significant open periods on their calendars.
- Approximately 93.3% of listings show high availability (181+ days open annually), indicating potential for increased bookings or specific owner usage patterns.
- For booked days, the 1-30 days range is most frequent in Yumbo (47.5%), reflecting common guest stay durations or potential owner blocking patterns.
- A notable 6.8% of properties secure long booking periods (181+ days booked per year), highlighting successful long-term rental strategies or significant owner usage.
Yumbo Airbnb Minimum Stay Requirements Analysis
Distribution of Listings by Minimum Night Requirement
1 Night
36 listings
61% of total
2 Nights
6 listings
10.2% of total
3 Nights
1 listings
1.7% of total
4-6 Nights
1 listings
1.7% of total
7-29 Nights
2 listings
3.4% of total
30+ Nights
13 listings
22% of total
Key Insights
- The most prevalent minimum stay requirement in Yumbo is 1 Night, adopted by 61% of listings. This highlights the market's preference for shorter, flexible bookings.
- A strong majority (71.2%) of the Yumbo Airbnb data shows acceptance of very short stays (1-2 nights), indicating a dynamic, high-turnover market.
- A significant segment (22%) caters to monthly stays (30+ nights) in Yumbo, pointing to opportunities in the extended-stay market.
Recommendations
- Align with the market by considering a 1 Night minimum stay, as 61% of Yumbo hosts use this setting.
- Explore offering discounts for stays of 30+ nights to attract the 22% of the market seeking extended stays.
- Adjust minimum nights based on seasonality – potentially shorter during low season and longer during peak demand periods in Yumbo.
Yumbo Airbnb Cancellation Policy Trends Analysis (2026)
Limited
3 listings
5.1% of total
Flexible
22 listings
37.3% of total
Moderate
17 listings
28.8% of total
Firm
16 listings
27.1% of total
Strict
1 listings
1.7% of total
Cancellation Policy Insights for Yumbo
- The prevailing Airbnb cancellation policy trend in Yumbo is Flexible, used by 37.3% of listings.
- There's a relatively balanced mix between guest-friendly (66.1%) and stricter (28.8%) policies, offering choices for different guest needs.
- Strict cancellation policies are quite rare (1.7%), potentially making listings with this policy less competitive unless justified by high demand or property type.
Recommendations for Hosts
- Consider adopting a Flexible policy to align with the 37.3% market standard in Yumbo.
- Using a Strict policy might deter some guests, as only 1.7% of listings use it. Evaluate if potential revenue protection outweighs possible lower booking rates.
- Regularly review your cancellation policy against competitors and market demand shifts in Yumbo.
Yumbo STR Booking Lead Time Analysis (2026)
Average Booking Lead Time by Month
Booking Lead Time Insights for Yumbo
- The overall average booking lead time for vacation rentals in Yumbo is 19 days.
- Guests book furthest in advance for stays during December (average 41 days), likely coinciding with peak travel demand or local events.
- The shortest booking windows occur for stays in June (average 10 days), indicating more last-minute travel plans during this time.
- Seasonally, Winter (26 days avg.) sees the longest lead times, while Summer (16 days avg.) has the shortest, reflecting typical travel planning cycles.
Recommendations for Hosts
- Use the overall average lead time (19 days) as a baseline for your pricing and availability strategy in Yumbo.
- For December stays, consider implementing length-of-stay discounts or slightly higher rates for bookings made less than 41 days out to capitalize on advance planning.
- During June, focus on last-minute booking availability and promotions, as guests book with very short notice (10 days avg.).
- Target marketing efforts for the Winter season well in advance (at least 26 days) to capture early planners.
- Monitor your own booking lead times against these Yumbo averages to identify opportunities for dynamic pricing adjustments.
Popular & Essential Airbnb Amenities in Yumbo (2026)
Amenity Prevalence
Amenity Insights for Yumbo
- Essential amenities in Yumbo that guests expect include: Wifi. Lacking these (this) could significantly impact bookings.
- Popular amenities like TV, Free parking on premises, Kitchen are common but not universal. Offering these can provide a competitive edge.
Recommendations for Hosts
- Ensure your listing includes all essential amenities for Yumbo: Wifi.
- Prioritize adding missing essentials: Wifi.
- Consider adding popular differentiators like TV or Free parking on premises to increase appeal.
- Highlight unique or less common amenities you offer (e.g., hot tub, dedicated workspace, EV charger) in your listing description and photos.
- Regularly check competitor amenities in Yumbo to stay competitive.
Yumbo Airbnb Guest Demographics & Profile Analysis (2026)
Guest Profile Summary for Yumbo
- The typical guest profile for Airbnb in Yumbo consists of a mix of domestic (64%) and international guests, often arriving from nearby Cali, typically belonging to the Post-2000s (Gen Z/Alpha) group (50%), primarily speaking Spanish or English.
- Domestic travelers account for 64.1% of guests.
- Key international markets include Colombia (64.1%) and United States (29.1%).
- Top languages spoken are Spanish (55.6%) followed by English (35.9%).
- A significant demographic segment is the Post-2000s (Gen Z/Alpha) group, representing 50% of guests.
Recommendations for Hosts
- Target domestic marketing efforts towards travelers from Cali and Bogotá.
- Tailor amenities and listing descriptions to appeal to the dominant Post-2000s (Gen Z/Alpha) demographic (e.g., highlight fast WiFi, smart home features, local guides).
- Highlight unique local experiences or amenities relevant to the primary guest profile.
- Consider seasonal promotions aligned with peak travel times for key origin markets.
Nearby Short-Term Rental Market Comparison
How does the Yumbo Airbnb market stack up against its neighbors? Compare key performance metrics like average monthly revenue, ADR, and occupancy rates in surrounding areas to understand the broader regional STR landscape.
| Market | Active Properties | Monthly Revenue | Daily Rate | Avg. Occupancy |
|---|---|---|---|---|
| La Buitrera | 15 | $1,161 | $146.95 | 26% |
| Calima Lake | 18 | $775 | $217.48 | 16% |
| Quimbaya | 193 | $756 | $133.90 | 24% |
| Calima | 196 | $699 | $178.59 | 17% |
| El Cerrito | 55 | $675 | $124.19 | 22% |
| Restrepo | 20 | $670 | $179.01 | 19% |
| Alcalá | 29 | $633 | $204.86 | 18% |
| Pance | 28 | $625 | $81.74 | 34% |
| Montenegro | 276 | $618 | $136.40 | 23% |
| La Tebaida | 219 | $568 | $115.52 | 25% |