Kinsuka Pecheur Airbnb Market Analysis 2026: Short Term Rental Data & Vacation Rental Statistics in Kinshasa, Congo - Kinshasa
Is Airbnb profitable in Kinsuka Pecheur in 2026? Explore comprehensive Airbnb analytics for Kinsuka Pecheur, Kinshasa, Congo - Kinshasa to uncover income potential. This 2026 STR market report for Kinsuka Pecheur, based on AirROI data from June 2024 to May 2025, reveals key trends in the niche market of 21 active listings.
Whether you're considering an Airbnb investment in Kinsuka Pecheur, optimizing your existing vacation rental, or exploring rental arbitrage opportunities, understanding the Kinsuka Pecheur Airbnb data is crucial. Navigating the high regulation landscape is key to maximizing your short term rental income potential. Let's dive into the specifics.
Key Kinsuka Pecheur Airbnb Performance Metrics Overview
Monthly Airbnb Revenue Variations & Income Potential in Kinsuka Pecheur (2026)
Understanding the monthly revenue variations for Airbnb listings in Kinsuka Pecheur is key to maximizing your short term rental income potential. Seasonality significantly impacts earnings. Our analysis, based on data from the past 12 months, shows that the peak revenue month for STRs in Kinsuka Pecheur is typically September, while January often presents the lowest earnings, highlighting opportunities for strategic pricing adjustments during shoulder and low seasons. Explore the typical Airbnb income in Kinsuka Pecheur across different performance tiers:
- Best-in-class properties (Top 10%) achieve $761+ monthly, often utilizing dynamic pricing and superior guest experiences.
- Strong performing properties (Top 25%) earn $630 or more, indicating effective management and desirable locations/amenities.
- Typical properties (Median) generate around $396 per month, representing the average market performance.
- Entry-level properties (Bottom 25%) see earnings around $196, often with potential for optimization.
Average Monthly Airbnb Earnings Trend in Kinsuka Pecheur
Kinsuka Pecheur Airbnb Occupancy Rate Trends (2026)
Maximize your bookings by understanding the Kinsuka Pecheur STR occupancy trends. Seasonal demand shifts significantly influence how often properties are booked. Typically, Junesees the highest demand (peak season occupancy), while January experiences the lowest (low season). Effective strategies, like adjusting minimum stays or offering promotions, can boost occupancy during slower periods. Here's how different property tiers perform in Kinsuka Pecheur:
- Best-in-class properties (Top 10%) achieve 64%+ occupancy, indicating high desirability and potentially optimized availability.
- Strong performing properties (Top 25%) maintain 45% or higher occupancy, suggesting good market fit and guest satisfaction.
- Typical properties (Median) have an occupancy rate around 31%.
- Entry-level properties (Bottom 25%) average 19% occupancy, potentially facing higher vacancy.
Average Monthly Occupancy Rate Trend in Kinsuka Pecheur
Average Daily Rate (ADR) Airbnb Trends in Kinsuka Pecheur (2026)
Effective short term rental pricing strategy in Kinsuka Pecheur involves understanding monthly ADR fluctuations. The Average Daily Rate (ADR) for Airbnb in Kinsuka Pecheur typically peaks in May and dips lowest during December. Leveraging Airbnb dynamic pricing tools or strategies based on this seasonality can significantly boost revenue. Here's a look at the typical nightly rates achieved:
- Best-in-class properties (Top 10%) command rates of $125+ per night, often due to premium features or locations.
- Strong performing properties (Top 25%) achieve nightly rates of $96 or more.
- Typical properties (Median) charge around $60 per night.
- Entry-level properties (Bottom 25%) earn around $52 per night.
Average Daily Rate (ADR) Trend by Month in Kinsuka Pecheur
Get Live Kinsuka Pecheur Market Intelligence 👇

Explore Real-time Analytics
Airbnb Seasonality Analysis & Trends in Kinsuka Pecheur (2025)
Peak Season (September, July, June)
- Revenue averages $694 per month
- Occupancy rates average 61.7%
- Daily rates average $70
Shoulder Season
- Revenue averages $420 per month
- Occupancy maintains around 29.6%
- Daily rates hold near $76
Low Season (January, November, December)
- Revenue drops to average $244 per month
- Occupancy decreases to average 19.8%
- Daily rates adjust to average $72
Seasonality Insights for Kinsuka Pecheur
- The Airbnb seasonality in Kinsuka Pecheur shows highly seasonal trends requiring careful strategy. While the sections above show seasonal averages, it's also insightful to look at the extremes:
- During the high season, the absolute peak month showcases Kinsuka Pecheur's highest earning potential, with monthly revenues capable of climbing to $817, occupancy reaching a high of 75.0%, and ADRs peaking at $81.
- Conversely, the slowest single month of the year, typically falling within the low season, marks the market's lowest point. In this month, revenue might dip to $204, occupancy could drop to 11.3%, and ADRs may adjust down to $69.
- Understanding both the seasonal averages and these monthly peaks and troughs in revenue, occupancy, and ADR is crucial for maximizing your Airbnb profit potential in Kinsuka Pecheur.
Seasonal Strategies for Maximizing Profit
- Peak Season: Maximize revenue through premium pricing and potentially longer minimum stays. Ensure high availability.
- Low Season: Offer competitive pricing, special promotions (e.g., extended stay discounts), and flexible cancellation policies. Target off-season travelers like remote workers or budget-conscious guests.
- Shoulder Seasons: Implement dynamic pricing that balances peak and low rates. Target weekend travelers or specific events. Offer slightly more flexible terms than peak season.
- Regularly analyze your own performance against these Kinsuka Pecheur seasonality benchmarks and adjust your pricing and availability strategy accordingly.
Best Areas for Airbnb Investment in Kinsuka Pecheur (2026)
Exploring the top neighborhoods for short-term rentals in Kinsuka Pecheur? This section highlights key areas, outlining why they are attractive for hosts and guests, along with notable local attractions. Consider these locations based on your target guest profile and investment strategy.
| Neighborhood / Area | Why Host Here? (Target Guests & Appeal) | Key Attractions & Landmarks |
|---|---|---|
| Kinsuka Pecheur | A growing area in Kinshasa known for its peaceful environment and proximity to the Congo River. It offers a blend of local culture and nature, appealing to travelers looking for a serene escape while still being close to the city's amenities. | Congo River, Local markets, Parks and green spaces, Traditional Congolese restaurants, Cultural events and festivals |
| Kinshasa City Center | The bustling heart of Kinshasa, full of commerce, entertainment, and vibrant street life. It's ideal for guests seeking the dynamic urban experience of the city, with easy access to shopping and dining. | La Gare Centrale, Kinshasa Botanical Gardens, Cultural centers, Local malls, Nightlife spots |
| Gombe | An upscale neighborhood known for its safety and plethora of restaurants, bars, and shops. It attracts business travelers and expatriates looking for comfort and convenience in Kinshasa. | Luxurious hotels, High-end restaurants, Art galleries, Shopping boutiques, Cultural exhibitions |
| Ngaliema | A residential area with a mix of local charm and modern amenities. It's a quieter option for those traveling with family or seeking longer stays. | Beautiful views of the river, Local parks, Family-friendly activities, Recreational centers, Community events |
| Kinsuka | A neighborhood known for its proximity to natural beauty and local markets. It offers travelers a chance to experience the local lifestyle in a more laid-back setting. | Riverside parks, Local artisan markets, Nature trails, Fishing spots, Community festivals |
| Masina | A vibrant district known for its lively markets and cultural scenes. It attracts visitors interested in authentic local experiences and low-cost accommodations. | Masina Market, Local music venues, Street food stalls, Cultural performances, Community gatherings |
| Lemba | A cultural hub known for its music scene and local festivities. Ideal for those interested in immersing themselves in the Congolese culture. | Live music venues, Art and craft markets, Cultural festivals, Historical sites, Local cuisine |
| Kintambo | A residential area that is gaining popularity amongst travelers for its affordability and proximity to local attractions. It offers a slice of daily life in Kinshasa. | Local shopping, Community parks, Cultural heritage sites, Street art, Traditional dance performances |
Understanding Airbnb License Requirements & STR Laws in Kinsuka Pecheur (2026)
Yes, Kinsuka Pecheur, Kinshasa, Congo - Kinshasa enforces high STR regulations. Obtaining a license and ensuring compliance is almost certainly required according to current 2026 STR laws. Always verify the latest short term rental regulations and Airbnb license requirements directly with local government authorities for Kinsuka Pecheur to ensure full compliance before hosting.
(Source: AirROI data, 2026, based on 52% licensed listings)
Top Performing Airbnb Properties in Kinsuka Pecheur (2026)
Benchmark your potential! Explore examples of top-performing Airbnb properties in Kinsuka Pecheurbased on Trailing Twelve Month (TTM) revenue. Analyze their characteristics, revenue, occupancy rate, and ADR to understand what drives success in this market.

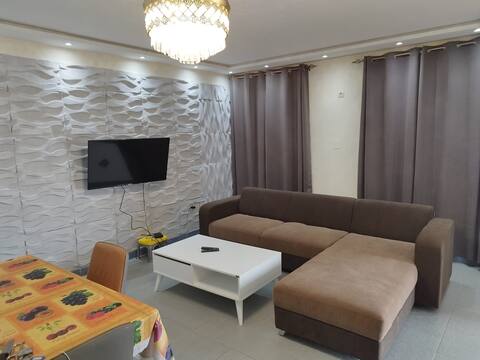
A little Kinsuka penthouse nest.
Entire Place • 1 bedroom
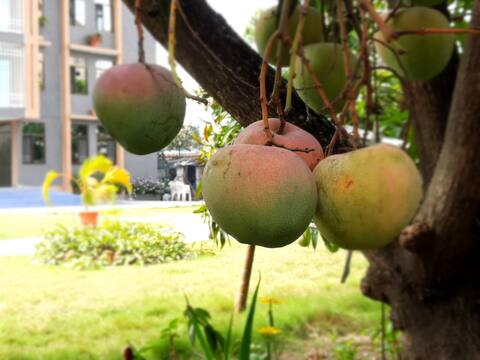
2 chambres, appartement rez-de-chaussée Wi-Fi
Entire Place • 2 bedrooms
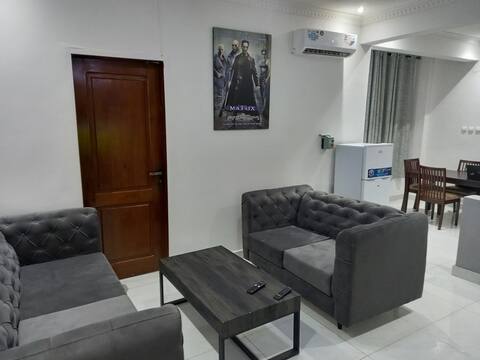
1er étage, 3 chambres Wi-Fi
Entire Place • 3 bedrooms

Low Priced, 3rd Fl Apt, Yolo, FREE WI-FI
Entire Place • 1 bedroom
Nid douillet a Kinsuka @ chini
Entire Place • 2 bedrooms
Villa Isidore Bokam's 1er
Private Room • 7 bedrooms
Note: Performance varies based on location, size, amenities, seasonality, and management quality. Data reflects the past 12 months.
Top Performing Airbnb Hosts in Kinsuka Pecheur (2026)
Learn from the best! This table showcases top-performing Airbnb hosts in Kinsuka Pecheur based on the number of properties managed and estimated total revenue over the past year. Analyze their scale and performance metrics.
| Host Name | Properties | Grossing Revenue | Stay Reviews | Avg Rating |
|---|---|---|---|---|
| Host #278990124 | 3 | $8,970 | 2 | Not Rated |
| Host #166390543 | 3 | $7,674 | 26 | 4.51/5.0 |
| Host #519758796 | 9 | $5,368 | 11 | Not Rated |
| Host #22418192 | 1 | $3,020 | 23 | 4.30/5.0 |
| Host #466713840 | 1 | $1,928 | 0 | Not Rated |
| Host #447285502 | 1 | $1,762 | 1 | Not Rated |
| Host #285355549 | 1 | $974 | 0 | Not Rated |
| Host #503064676 | 1 | $657 | 15 | Not Rated |
| Host #544561499 | 1 | $518 | 0 | Not Rated |
Analyzing the strategies of top hosts, such as their property selection, pricing, and guest communication, can offer valuable lessons for optimizing your own Airbnb operations in Kinsuka Pecheur.
Dive Deeper: Advanced Kinsuka Pecheur STR Market Data (2026)
Ready to unlock more insights? AirROI provides access to advanced metrics and comprehensive Airbnb data for Kinsuka Pecheur. Explore detailed analytics beyond this report to refine your investment strategy, optimize pricing, and maximize your vacation rental profits.
Explore Advanced MetricsKinsuka Pecheur Short-Term Rental Market Composition (2026): Property & Room Types
Room Type Distribution
Property Type Distribution
Market Composition Insights for Kinsuka Pecheur
- The Kinsuka Pecheur Airbnb market composition is heavily skewed towards Entire Home/Apt listings, which make up 90.5% of the 21 active rentals. This indicates strong guest preference for privacy and space.
- Looking at the property type distribution in Kinsuka Pecheur, Apartment/Condo properties are the most common (90.5%), reflecting the local real estate landscape.
Kinsuka Pecheur Airbnb Room Capacity Analysis (2026): Bedroom Distribution
Distribution of Listings by Number of Bedrooms
Room Capacity Insights for Kinsuka Pecheur
- The dominant room capacity in Kinsuka Pecheur is 1 bedroom listings, making up 47.6% of the market. This suggests a strong demand for properties suitable for couples or solo travelers.
- Together, 1 bedroom and 2 bedrooms properties represent 80.9% of the active Airbnb listings in Kinsuka Pecheur, indicating a high concentration in these sizes.
Kinsuka Pecheur Vacation Rental Guest Capacity Trends (2026)
Distribution of Listings by Guest Capacity
Guest Capacity Insights for Kinsuka Pecheur
- The most common guest capacity trend in Kinsuka Pecheur vacation rentals is listings accommodating 2 guests (47.6%). This suggests the primary traveler segment is likely couples or solo travelers.
- Properties designed for 2 guests and 4 guests dominate the Kinsuka Pecheur STR market, accounting for 80.9% of listings.
- A significant 47.6% of listings cater specifically to 1-2 guests, highlighting strong demand from couples and solo travelers in Kinsuka Pecheur.
- 19.1% of properties accommodate 6+ guests, serving the market segment for larger families or group travel in Kinsuka Pecheur.
- On average, properties in Kinsuka Pecheur are equipped to host 3.5 guests.
Kinsuka Pecheur Airbnb Booking Patterns (2026): Available vs. Booked Days
Available Days Distribution
Booked Days Distribution
Booking Pattern Insights for Kinsuka Pecheur
- The most common availability pattern in Kinsuka Pecheur falls within the 271-366 days range, representing 90.5% of listings. This suggests many properties have significant open periods on their calendars.
- Approximately 100.0% of listings show high availability (181+ days open annually), indicating potential for increased bookings or specific owner usage patterns.
- For booked days, the 1-30 days range is most frequent in Kinsuka Pecheur (76.2%), reflecting common guest stay durations or potential owner blocking patterns.
Kinsuka Pecheur Airbnb Minimum Stay Requirements Analysis
Distribution of Listings by Minimum Night Requirement
1 Night
3 listings
14.3% of total
2 Nights
3 listings
14.3% of total
3 Nights
13 listings
61.9% of total
4-6 Nights
2 listings
9.5% of total
Key Insights
- The most prevalent minimum stay requirement in Kinsuka Pecheur is 3 Nights, adopted by 61.9% of listings. This highlights the market's preference for longer commitments.
Recommendations
- Align with the market by considering a 3 Nights minimum stay, as 61.9% of Kinsuka Pecheur hosts use this setting.
- If feasible, allowing 1-night stays, especially midweek or during low season, could capture last-minute bookings, as only 14.3% currently do.
- Adjust minimum nights based on seasonality – potentially shorter during low season and longer during peak demand periods in Kinsuka Pecheur.
Kinsuka Pecheur Airbnb Cancellation Policy Trends Analysis (2026)
Flexible
9 listings
81.8% of total
Firm
1 listings
9.1% of total
Strict
1 listings
9.1% of total
Cancellation Policy Insights for Kinsuka Pecheur
- The prevailing Airbnb cancellation policy trend in Kinsuka Pecheur is Flexible, used by 81.8% of listings.
- The market strongly favors guest-friendly terms, with 81.8% of listings offering Flexible or Moderate policies. This suggests guests in Kinsuka Pecheur may expect booking flexibility.
- Strict cancellation policies are quite rare (9.1%), potentially making listings with this policy less competitive unless justified by high demand or property type.
Recommendations for Hosts
- Consider adopting a Flexible policy to align with the 81.8% market standard in Kinsuka Pecheur.
- Given the high prevalence of Flexible policies (81.8%), offering this can enhance booking appeal, especially during shoulder seasons.
- Using a Strict policy might deter some guests, as only 9.1% of listings use it. Evaluate if potential revenue protection outweighs possible lower booking rates.
- Regularly review your cancellation policy against competitors and market demand shifts in Kinsuka Pecheur.
Kinsuka Pecheur STR Booking Lead Time Analysis (2026)
Average Booking Lead Time by Month
Booking Lead Time Insights for Kinsuka Pecheur
- The overall average booking lead time for vacation rentals in Kinsuka Pecheur is 14 days.
- Guests book furthest in advance for stays during October (average 41 days), likely coinciding with peak travel demand or local events.
- The shortest booking windows occur for stays in January (average 11 days), indicating more last-minute travel plans during this time.
- Seasonally, Fall (30 days avg.) sees the longest lead times, while Summer (16 days avg.) has the shortest, reflecting typical travel planning cycles.
Recommendations for Hosts
- Use the overall average lead time (14 days) as a baseline for your pricing and availability strategy in Kinsuka Pecheur.
- For October stays, consider implementing length-of-stay discounts or slightly higher rates for bookings made less than 41 days out to capitalize on advance planning.
- Target marketing efforts for the Fall season well in advance (at least 30 days) to capture early planners.
- Monitor your own booking lead times against these Kinsuka Pecheur averages to identify opportunities for dynamic pricing adjustments.
Popular & Essential Airbnb Amenities in Kinsuka Pecheur (2026)
Amenity Prevalence
No amenities with partial availability (less than 100%) were found to display in the chart. All essential amenities might be present in all listings. Check insights below.
Amenity Insights for Kinsuka Pecheur
- Essential amenities in Kinsuka Pecheur that guests expect include: Air conditioning, Essentials, Hot water, Carbon monoxide alarm, Heating, Smoke alarm, Wifi, Dryer, Washer, TV. Lacking these (any) could significantly impact bookings.
Recommendations for Hosts
- Ensure your listing includes all essential amenities for Kinsuka Pecheur: Air conditioning, Essentials, Hot water, Carbon monoxide alarm, Heating, Smoke alarm, Wifi, Dryer, Washer, TV.
- Highlight unique or less common amenities you offer (e.g., hot tub, dedicated workspace, EV charger) in your listing description and photos.
- Regularly check competitor amenities in Kinsuka Pecheur to stay competitive.
Kinsuka Pecheur Airbnb Guest Demographics & Profile Analysis (2026)
Guest Profile Summary for Kinsuka Pecheur
- The typical guest profile for Airbnb in Kinsuka Pecheur consists of predominantly international visitors (100%), with top international origins including Canada, typically belonging to the Post-2000s (Gen Z/Alpha) group (50%), primarily speaking French or English.
- Domestic travelers account for 0.0% of guests.
- Key international markets include France (42.9%) and Canada (19%).
- Top languages spoken are French (46.4%) followed by English (35.7%).
- A significant demographic segment is the Post-2000s (Gen Z/Alpha) group, representing 50% of guests.
Recommendations for Hosts
- Focus marketing internationally, particularly towards travelers from Canada.
- Offer listing details and communication support in French.
- Tailor amenities and listing descriptions to appeal to the dominant Post-2000s (Gen Z/Alpha) demographic (e.g., highlight fast WiFi, smart home features, local guides).
- Highlight unique local experiences or amenities relevant to the primary guest profile.
- Consider seasonal promotions aligned with peak travel times for key origin markets.
Nearby Short-Term Rental Market Comparison
How does the Kinsuka Pecheur Airbnb market stack up against its neighbors? Compare key performance metrics like average monthly revenue, ADR, and occupancy rates in surrounding areas to understand the broader regional STR landscape.
| Market | Active Properties | Monthly Revenue | Daily Rate | Avg. Occupancy |
|---|---|---|---|---|
| Cliniques | 41 | $1,313 | $212.70 | 38% |
| Haut Commandement | 13 | $947 | $116.34 | 42% |
| Golf | 20 | $927 | $121.16 | 35% |
| Basoko | 23 | $860 | $103.55 | 42% |
| Révolution | 32 | $641 | $103.15 | 38% |
| Joli Parc | 13 | $378 | $83.01 | 34% |
| Residentiel | 10 | $358 | $74.36 | 28% |
| Brazzaville (municipality) | 68 | $249 | $87.16 | 25% |
| Industriel | 11 | $240 | $66.43 | 37% |