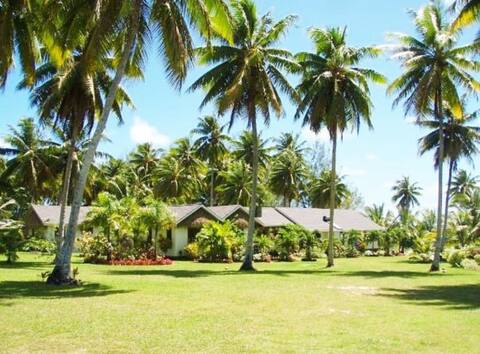
Ureia Airbnb Market Analysis 2026: Short Term Rental Data & Vacation Rental Statistics in Aitutaki, Cook Islands
Is Airbnb profitable in Ureia in 2026? Explore comprehensive Airbnb analytics for Ureia, Aitutaki, Cook Islands to uncover income potential. This 2026 STR market report for Ureia, based on AirROI data from February 2025 to January 2026, reveals key trends in the niche market of 21 active listings.
Whether you're considering an Airbnb investment in Ureia, optimizing your existing vacation rental, or exploring rental arbitrage opportunities, understanding the Ureia Airbnb data is crucial. Leveraging the low regulation environment is key to maximizing your short term rental income potential. Let's dive into the specifics.
Key Ureia Airbnb Performance Metrics Overview
Monthly Airbnb Revenue Variations & Income Potential in Ureia (2026)
Understanding the monthly revenue variations for Airbnb listings in Ureia is key to maximizing your short term rental income potential. Seasonality significantly impacts earnings. Our analysis, based on data from the past 12 months, shows that the peak revenue month for STRs in Ureia is typically August, while February often presents the lowest earnings, highlighting opportunities for strategic pricing adjustments during shoulder and low seasons. Explore the typical Airbnb income in Ureia across different performance tiers:
- Best-in-class properties (Top 10%) achieve $9,089+ monthly, often utilizing dynamic pricing and superior guest experiences.
- Strong performing properties (Top 25%) earn $5,794 or more, indicating effective management and desirable locations/amenities.
- Typical properties (Median) generate around $4,205 per month, representing the average market performance.
- Entry-level properties (Bottom 25%) see earnings around $2,411, often with potential for optimization.
Average Monthly Airbnb Earnings Trend in Ureia
Ureia Airbnb Occupancy Rate Trends (2026)
Maximize your bookings by understanding the Ureia STR occupancy trends. Seasonal demand shifts significantly influence how often properties are booked. Typically, Septembersees the highest demand (peak season occupancy), while January experiences the lowest (low season). Effective strategies, like adjusting minimum stays or offering promotions, can boost occupancy during slower periods. Here's how different property tiers perform in Ureia:
- Best-in-class properties (Top 10%) achieve 89%+ occupancy, indicating high desirability and potentially optimized availability.
- Strong performing properties (Top 25%) maintain 79% or higher occupancy, suggesting good market fit and guest satisfaction.
- Typical properties (Median) have an occupancy rate around 62%.
- Entry-level properties (Bottom 25%) average 34% occupancy, potentially facing higher vacancy.
Average Monthly Occupancy Rate Trend in Ureia
Average Daily Rate (ADR) Airbnb Trends in Ureia (2026)
Effective short term rental pricing strategy in Ureia involves understanding monthly ADR fluctuations. The Average Daily Rate (ADR) for Airbnb in Ureia typically peaks in July and dips lowest during March. Leveraging Airbnb dynamic pricing tools or strategies based on this seasonality can significantly boost revenue. Here's a look at the typical nightly rates achieved:
- Best-in-class properties (Top 10%) command rates of $592+ per night, often due to premium features or locations.
- Strong performing properties (Top 25%) achieve nightly rates of $347 or more.
- Typical properties (Median) charge around $217 per night.
- Entry-level properties (Bottom 25%) earn around $176 per night.
Average Daily Rate (ADR) Trend by Month in Ureia
Get Live Ureia Market Intelligence 👇

Explore Real-time Analytics
Airbnb Seasonality Analysis & Trends in Ureia (2026)
Peak Season (August, October, September)
- Revenue averages $6,373 per month
- Occupancy rates average 70.5%
- Daily rates average $290
Shoulder Season
- Revenue averages $5,022 per month
- Occupancy maintains around 58.1%
- Daily rates hold near $287
Low Season (January, February, March)
- Revenue drops to average $3,506 per month
- Occupancy decreases to average 45.1%
- Daily rates adjust to average $274
Seasonality Insights for Ureia
- The Airbnb seasonality in Ureia shows highly seasonal trends requiring careful strategy. While the sections above show seasonal averages, it's also insightful to look at the extremes:
- During the high season, the absolute peak month showcases Ureia's highest earning potential, with monthly revenues capable of climbing to $6,847, occupancy reaching a high of 74.4%, and ADRs peaking at $308.
- Conversely, the slowest single month of the year, typically falling within the low season, marks the market's lowest point. In this month, revenue might dip to $2,950, occupancy could drop to 39.6%, and ADRs may adjust down to $272.
- Understanding both the seasonal averages and these monthly peaks and troughs in revenue, occupancy, and ADR is crucial for maximizing your Airbnb profit potential in Ureia.
Seasonal Strategies for Maximizing Profit
- Peak Season: Maximize revenue through premium pricing and potentially longer minimum stays. Ensure high availability.
- Low Season: Offer competitive pricing, special promotions (e.g., extended stay discounts), and flexible cancellation policies. Target off-season travelers like remote workers or budget-conscious guests.
- Shoulder Seasons: Implement dynamic pricing that balances peak and low rates. Target weekend travelers or specific events. Offer slightly more flexible terms than peak season.
- Regularly analyze your own performance against these Ureia seasonality benchmarks and adjust your pricing and availability strategy accordingly.
Best Areas for Airbnb Investment in Ureia (2026)
Exploring the top neighborhoods for short-term rentals in Ureia? This section highlights key areas, outlining why they are attractive for hosts and guests, along with notable local attractions. Consider these locations based on your target guest profile and investment strategy.
| Neighborhood / Area | Why Host Here? (Target Guests & Appeal) | Key Attractions & Landmarks |
|---|---|---|
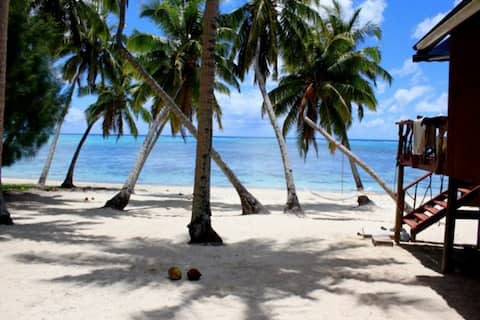
| Ootu Beach | A picturesque beach known for its stunning sunsets and crystal-clear waters, Ootu Beach attracts tourists looking for relaxation and water activities. Its proximity to resorts makes it ideal for Airbnb hosting. | Ootu Beach, Aitutaki Lagoon, Boat day trips, Snorkeling and diving spots, Resorts and local restaurants |
| Aitutaki Lagoon | Renowned for its breathtaking beauty, the Aitutaki Lagoon is a popular spot for visitors seeking adventure and romance. Offering activities like lagoon tours, this area is prime for Airbnb investments. | Aitutaki Lagoon, One Foot Island, Lagoon excursions, Kayaking, Snorkeling at coral reefs |
| Arutanga | The main town of Aitutaki, Arutanga is rich in culture and local life. Tourists looking to experience authentic Cook Islands culture find it appealing, making it a good choice for Airbnb hosting. | Arutanga Harbour, Cook Islands Christian Church, Cultural experiences, Local markets, Bicycle rentals |
| Taputapuātea | This scenic area is known for its natural beauty and cultural significance. It offers great views and opportunities for hiking, attracting nature lovers and adventure seekers. | Taputapuātea archaeological site, Nature trails, Scenic viewpoints, Wildlife and bird watching, Photography spots |
| Piraki | A quieter area with beautiful scenery, Piraki is ideal for tourists looking to escape the crowds. It’s suitable for peaceful stays while still being close to local attractions. | Private beaches, Lagoon views, Relaxation spots, Local accommodations, Fishing spots |
| Akitua Island | A private resort island, Akitua is an exclusive destination that attracts high-end tourists. Offering luxury stays, it’s perfect for upscale Airbnb hosting. | Luxury resorts, Private beaches, Water sports, Gourmet restaurants, Spa services |
| Bramble's Beach | Less crowded than other beaches, Bramble's Beach offers a serene environment for visitors wanting to unwind. It’s great for Airbnb hosts aiming for a peaceful retreat. | Secluded beach, Natural beauty, Tranquil atmosphere, Picnic areas, Snorkeling opportunities |
| Ruatonga | A residential area that gives guests a taste of local life while being close to tourist attractions. It can be a unique experience for tourists looking for authenticity in their stay. | Local lifestyle, Community engagement, Access to food markets, Cultural tours, Nearby beaches |
Understanding Airbnb License Requirements & STR Laws in Ureia (2026)
While Ureia, Aitutaki, Cook Islands currently shows low STR regulations, specific Airbnb license requirements might still exist or change. Always verify the latest short term rental regulations and Airbnb license requirements directly with local government authorities for Ureia to ensure full compliance before hosting.
(Source: AirROI data, 2026, finding no licensed listings among those analyzed)
Top Performing Airbnb Properties in Ureia (2026)
Benchmark your potential! Explore examples of top-performing Airbnb properties in Ureiabased on Trailing Twelve Month (TTM) revenue. Analyze their characteristics, revenue, occupancy rate, and ADR to understand what drives success in this market.
Matatui villas, whole property
Entire Place • 4 bedrooms

Matatui Villa, Beachfront, Aitutaki
Entire Place • 2 bedrooms

Matatui Villas, Villa 2
Entire Place • 2 bedrooms

Two-Bedroom Suite
Private Room • 2 bedrooms
Tai Marino - Beachfront Bungalow 1
Entire Place • 1 bedroom
Beachfront life at Tangikaara
Entire Place • 1 bedroom
Note: Performance varies based on location, size, amenities, seasonality, and management quality. Data reflects the past 12 months.
Top Performing Airbnb Hosts in Ureia (2026)
Learn from the best! This table showcases top-performing Airbnb hosts in Ureia based on the number of properties managed and estimated total revenue over the past year. Analyze their scale and performance metrics.
| Host Name | Properties | Grossing Revenue | Stay Reviews | Avg Rating |
|---|---|---|---|---|
| Ash | 3 | $376,603 | 78 | 4.89/5.0 |
| Soso | 3 | $164,319 | 365 | 4.76/5.0 |
| Charles | 3 | $139,180 | 10 | 4.63/5.0 |
| Vaea | 2 | $118,290 | 76 | 4.98/5.0 |
| Annie | 2 | $78,505 | 57 | 4.96/5.0 |
| Tania | 1 | $64,787 | 139 | 4.86/5.0 |
| Brooke | 1 | $57,297 | 56 | 4.96/5.0 |
| Tarina | 1 | $56,322 | 14 | 4.86/5.0 |
| Eileen | 2 | $38,537 | 109 | 4.83/5.0 |
| Katrina | 1 | $17,961 | 34 | 4.91/5.0 |
Analyzing the strategies of top hosts, such as their property selection, pricing, and guest communication, can offer valuable lessons for optimizing your own Airbnb operations in Ureia.
Dive Deeper: Advanced Ureia STR Market Data (2026)
Ready to unlock more insights? AirROI provides access to advanced metrics and comprehensive Airbnb data for Ureia. Explore detailed analytics beyond this report to refine your investment strategy, optimize pricing, and maximize your vacation rental profits.
Explore Advanced MetricsUreia Short-Term Rental Market Composition (2026): Property & Room Types
Room Type Distribution
Property Type Distribution
Market Composition Insights for Ureia
- The Ureia Airbnb market composition is heavily skewed towards Entire Home/Apt listings, which make up 71.4% of the 21 active rentals. This indicates strong guest preference for privacy and space.
- Looking at the property type distribution in Ureia, House properties are the most common (76.2%), reflecting the local real estate landscape.
- Houses represent a significant 76.2% portion, catering likely to families or larger groups.
- The presence of 23.8% Hotel/Boutique listings indicates integration with traditional hospitality.
Ureia Airbnb Room Capacity Analysis (2026): Bedroom Distribution
Distribution of Listings by Number of Bedrooms
Room Capacity Insights for Ureia
- The dominant room capacity in Ureia is 1 bedroom listings, making up 52.4% of the market. This suggests a strong demand for properties suitable for couples or solo travelers.
- Together, 1 bedroom and 2 bedrooms properties represent 66.7% of the active Airbnb listings in Ureia, indicating a high concentration in these sizes.
- With over half the market (52.4%) consisting of studios or 1-bedroom units, Ureia is particularly well-suited for individuals or couples.
- Listings with 3+ bedrooms (9.6%) represent a smaller niche, potentially indicating an underserved market for larger group accommodations in Ureia.
Ureia Vacation Rental Guest Capacity Trends (2026)
Distribution of Listings by Guest Capacity
Guest Capacity Insights for Ureia
- The most common guest capacity trend in Ureia vacation rentals is listings accommodating 2 guests (57.1%). This suggests the primary traveler segment is likely couples or solo travelers.
- Properties designed for 2 guests and 4 guests dominate the Ureia STR market, accounting for 76.1% of listings.
- A significant 57.1% of listings cater specifically to 1-2 guests, highlighting strong demand from couples and solo travelers in Ureia.
- On average, properties in Ureia are equipped to host 3.0 guests.
Ureia Airbnb Booking Patterns (2026): Available vs. Booked Days
Available Days Distribution
Booked Days Distribution
Booking Pattern Insights for Ureia
- The most common availability pattern in Ureia falls within the 91-180 days range, representing 47.6% of listings. This suggests many properties have significant open periods on their calendars.
- Approximately 38.0% of listings show high availability (181+ days open annually), indicating potential for increased bookings or specific owner usage patterns.
- For booked days, the 181-270 days range is most frequent in Ureia (47.6%), reflecting common guest stay durations or potential owner blocking patterns.
- A notable 61.9% of properties secure long booking periods (181+ days booked per year), highlighting successful long-term rental strategies or significant owner usage.
Ureia Airbnb Minimum Stay Requirements Analysis
Distribution of Listings by Minimum Night Requirement
1 Night
3 listings
14.3% of total
2 Nights
3 listings
14.3% of total
3 Nights
9 listings
42.9% of total
4-6 Nights
1 listings
4.8% of total
30+ Nights
5 listings
23.8% of total
Key Insights
- The most prevalent minimum stay requirement in Ureia is 3 Nights, adopted by 42.9% of listings. This highlights the market's preference for longer commitments.
- A significant segment (23.8%) caters to monthly stays (30+ nights) in Ureia, pointing to opportunities in the extended-stay market.
Recommendations
- Align with the market by considering a 3 Nights minimum stay, as 42.9% of Ureia hosts use this setting.
- If feasible, allowing 1-night stays, especially midweek or during low season, could capture last-minute bookings, as only 14.3% currently do.
- Explore offering discounts for stays of 30+ nights to attract the 23.8% of the market seeking extended stays.
- Adjust minimum nights based on seasonality – potentially shorter during low season and longer during peak demand periods in Ureia.
Ureia Airbnb Cancellation Policy Trends Analysis (2026)
Firm
16 listings
76.2% of total
Strict
5 listings
23.8% of total
Cancellation Policy Insights for Ureia
- The prevailing Airbnb cancellation policy trend in Ureia is Firm, used by 76.2% of listings.
- A majority (100.0%) of hosts in Ureia utilize Firm or Strict policies, indicating a market where hosts prioritize booking security.
Recommendations for Hosts
- Consider adopting a Firm policy to align with the 76.2% market standard in Ureia.
- Regularly review your cancellation policy against competitors and market demand shifts in Ureia.
Ureia STR Booking Lead Time Analysis (2026)
Average Booking Lead Time by Month
Booking Lead Time Insights for Ureia
- The overall average booking lead time for vacation rentals in Ureia is 119 days.
- Guests book furthest in advance for stays during December (average 161 days), likely coinciding with peak travel demand or local events.
- The shortest booking windows occur for stays in February (average 90 days), indicating more last-minute travel plans during this time.
- Seasonally, Summer (132 days avg.) sees the longest lead times, while Spring (108 days avg.) has the shortest, reflecting typical travel planning cycles.
Recommendations for Hosts
- Use the overall average lead time (119 days) as a baseline for your pricing and availability strategy in Ureia.
- For December stays, consider implementing length-of-stay discounts or slightly higher rates for bookings made less than 161 days out to capitalize on advance planning.
- Target marketing efforts for the Summer season well in advance (at least 132 days) to capture early planners.
- Monitor your own booking lead times against these Ureia averages to identify opportunities for dynamic pricing adjustments.
Popular & Essential Airbnb Amenities in Ureia (2026)
Amenity Prevalence
Amenity Insights for Ureia
- Essential amenities in Ureia that guests expect include: Free parking on premises. Lacking these (this) could significantly impact bookings.
- Popular amenities like Air conditioning, Hot water, Beach access are common but not universal. Offering these can provide a competitive edge.
Recommendations for Hosts
- Ensure your listing includes all essential amenities for Ureia: Free parking on premises.
- Consider adding popular differentiators like Air conditioning or Hot water to increase appeal.
- Highlight unique or less common amenities you offer (e.g., hot tub, dedicated workspace, EV charger) in your listing description and photos.
- Regularly check competitor amenities in Ureia to stay competitive.
Ureia Airbnb Guest Demographics & Profile Analysis (2026)
Guest Profile Summary for Ureia
- The typical guest profile for Airbnb in Ureia consists of predominantly international visitors (99%), with top international origins including Australia, typically belonging to the Post-2000s (Gen Z/Alpha) group (50%), primarily speaking English or French.
- Domestic travelers account for 0.6% of guests.
- Key international markets include New Zealand (29.9%) and Australia (28%).
- Top languages spoken are English (54%) followed by French (9.7%).
- A significant demographic segment is the Post-2000s (Gen Z/Alpha) group, representing 50% of guests.
Recommendations for Hosts
- Focus marketing internationally, particularly towards travelers from Australia.
- Tailor amenities and listing descriptions to appeal to the dominant Post-2000s (Gen Z/Alpha) demographic (e.g., highlight fast WiFi, smart home features, local guides).
- Highlight unique local experiences or amenities relevant to the primary guest profile.
- Consider seasonal promotions aligned with peak travel times for key origin markets.