Garita Airbnb Market Analysis 2025: Short Term Rental Data & Vacation Rental Statistics in Alajuela Province, Costa Rica
Is Airbnb profitable in Garita in 2025? Explore comprehensive Airbnb analytics for Garita, Alajuela Province, Costa Rica to uncover income potential. This 2025 STR market report for Garita, based on AirROI data from November 2024 to October 2025, reveals key trends in the niche market of 18 active listings.
Whether you're considering an Airbnb investment in Garita, optimizing your existing vacation rental, or exploring rental arbitrage opportunities, understanding the Garita Airbnb data is crucial. Leveraging the low regulation environment is key to maximizing your short term rental income potential. Let's dive into the specifics.
Key Garita Airbnb Performance Metrics Overview
Monthly Airbnb Revenue Variations & Income Potential in Garita (2025)
Understanding the monthly revenue variations for Airbnb listings in Garita is key to maximizing your short term rental income potential. Seasonality significantly impacts earnings. Our analysis, based on data from the past 12 months, shows that the peak revenue month for STRs in Garita is typically December, while October often presents the lowest earnings, highlighting opportunities for strategic pricing adjustments during shoulder and low seasons. Explore the typical Airbnb income in Garita across different performance tiers:
- Best-in-class properties (Top 10%) achieve $3,399+ monthly, often utilizing dynamic pricing and superior guest experiences.
- Strong performing properties (Top 25%) earn $2,252 or more, indicating effective management and desirable locations/amenities.
- Typical properties (Median) generate around $1,089 per month, representing the average market performance.
- Entry-level properties (Bottom 25%) see earnings around $526, often with potential for optimization.
Average Monthly Airbnb Earnings Trend in Garita
Garita Airbnb Occupancy Rate Trends (2025)
Maximize your bookings by understanding the Garita STR occupancy trends. Seasonal demand shifts significantly influence how often properties are booked. Typically, Decembersees the highest demand (peak season occupancy), while May experiences the lowest (low season). Effective strategies, like adjusting minimum stays or offering promotions, can boost occupancy during slower periods. Here's how different property tiers perform in Garita:
- Best-in-class properties (Top 10%) achieve 58%+ occupancy, indicating high desirability and potentially optimized availability.
- Strong performing properties (Top 25%) maintain 39% or higher occupancy, suggesting good market fit and guest satisfaction.
- Typical properties (Median) have an occupancy rate around 23%.
- Entry-level properties (Bottom 25%) average 10% occupancy, potentially facing higher vacancy.
Average Monthly Occupancy Rate Trend in Garita
Average Daily Rate (ADR) Airbnb Trends in Garita (2025)
Effective short term rental pricing strategy in Garita involves understanding monthly ADR fluctuations. The Average Daily Rate (ADR) for Airbnb in Garita typically peaks in June and dips lowest during April. Leveraging Airbnb dynamic pricing tools or strategies based on this seasonality can significantly boost revenue. Here's a look at the typical nightly rates achieved:
- Best-in-class properties (Top 10%) command rates of $312+ per night, often due to premium features or locations.
- Strong performing properties (Top 25%) achieve nightly rates of $234 or more.
- Typical properties (Median) charge around $156 per night.
- Entry-level properties (Bottom 25%) earn around $102 per night.
Average Daily Rate (ADR) Trend by Month in Garita
Get Live Garita Market Intelligence 👇

Explore Real-time Analytics
Airbnb Seasonality Analysis & Trends in Garita (2025)
Peak Season (December, April, September)
- Revenue averages $1,944 per month
- Occupancy rates average 29.5%
- Daily rates average $182
Shoulder Season
- Revenue averages $1,582 per month
- Occupancy maintains around 28.4%
- Daily rates hold near $185
Low Season (January, May, October)
- Revenue drops to average $1,105 per month
- Occupancy decreases to average 22.7%
- Daily rates adjust to average $182
Seasonality Insights for Garita
- The Airbnb seasonality in Garita shows highly seasonal trends requiring careful strategy. While the sections above show seasonal averages, it's also insightful to look at the extremes:
- During the high season, the absolute peak month showcases Garita's highest earning potential, with monthly revenues capable of climbing to $2,129, occupancy reaching a high of 33.2%, and ADRs peaking at $200.
- Conversely, the slowest single month of the year, typically falling within the low season, marks the market's lowest point. In this month, revenue might dip to $865, occupancy could drop to 21.0%, and ADRs may adjust down to $174.
- Understanding both the seasonal averages and these monthly peaks and troughs in revenue, occupancy, and ADR is crucial for maximizing your Airbnb profit potential in Garita.
Seasonal Strategies for Maximizing Profit
- Peak Season: Maximize revenue through premium pricing and potentially longer minimum stays. Ensure high availability.
- Low Season: Offer competitive pricing, special promotions (e.g., extended stay discounts), and flexible cancellation policies. Target off-season travelers like remote workers or budget-conscious guests.
- Shoulder Seasons: Implement dynamic pricing that balances peak and low rates. Target weekend travelers or specific events. Offer slightly more flexible terms than peak season.
- Regularly analyze your own performance against these Garita seasonality benchmarks and adjust your pricing and availability strategy accordingly.
Best Areas for Airbnb Investment in Garita (2025)
Exploring the top neighborhoods for short-term rentals in Garita? This section highlights key areas, outlining why they are attractive for hosts and guests, along with notable local attractions. Consider these locations based on your target guest profile and investment strategy.
| Neighborhood / Area | Why Host Here? (Target Guests & Appeal) | Key Attractions & Landmarks |
|---|---|---|
| La Garita. | A serene area known for its lush greenery and proximity to the Juan Santamaría International Airport. Ideal for travelers looking for a peaceful stay close to urban amenities. | Zoo Ave, Coffee Farms, Nature trails, Local restaurants, Cultural experiences |
| Laguna de Fuego | A beautiful lakeside location offering stunning views of the surrounding mountains. Good for nature lovers and those looking for outdoor activities. | Lago de Fuego, Hiking trails, Bird watching, Relaxing areas by the water |
| Atenas | Renowned for its perfect climate and stunning landscapes. A popular spot for expats and those looking for tranquility while still being close to San José and the Central Valley. | Central Park, Atelier Restaurant, Local artisan markets, Coffee plantation tours |
| Alajuela | The nearest major town to Garita, providing guests with access to shopping, dining, and cultural experiences. | Alajuela Central Park, Juan Santamaría Museum, Cathedral of Alajuela, Local markets |
| Costa Rica Nature Park | A prime location for eco-tourism, providing guests with an immersive experience into Costa Rica's breathtaking nature and wildlife. | Rainforest trails, Wildlife tours, Nature observation points, Eco-lodges |
| Sarchí | Famous for its colorful oxcarts and craftsmanship, Sarchí is an ideal location for tourists looking for cultural experiences and unique souvenirs. | Oxcart Factory, Arts and crafts shops, Sarchí Church, Cultural festivals |
| Heredia | Close enough to Garita, Heredia combines urban conveniences with a rich cultural ambiance and historical sites. | Heredia Central Park, National University of Costa Rica, Café Britt |
| Poás Volcano | A stunning natural attraction that's a must-see for visitors. Great for those looking to explore Costa Rica’s volcanic landscapes and biodiversity. | Poás Volcano National Park, Hiking trails, Butterfly gardens, Coffee tours |
Understanding Airbnb License Requirements & STR Laws in Garita (2025)
While Garita, Alajuela Province, Costa Rica currently shows low STR regulations, specific Airbnb license requirements might still exist or change. Always verify the latest short term rental regulations and Airbnb license requirements directly with local government authorities for Garita to ensure full compliance before hosting.
(Source: AirROI data, 2025, finding no licensed listings among those analyzed)
Top Performing Airbnb Properties in Garita (2025)
Benchmark your potential! Explore examples of top-performing Airbnb properties in Garitabased on Trailing Twelve Month (TTM) revenue. Analyze their characteristics, revenue, occupancy rate, and ADR to understand what drives success in this market.

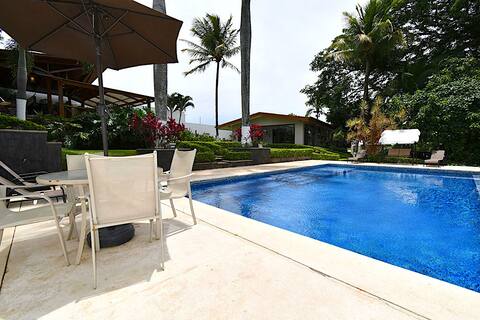
Beautiful Casa 11 - entire villa
Entire Place • 2 bedrooms

bambu house
Entire Place • 5 bedrooms
Villa Soledad
Entire Place • 3 bedrooms

El Cielo Country Villa
Entire Place • 3 bedrooms

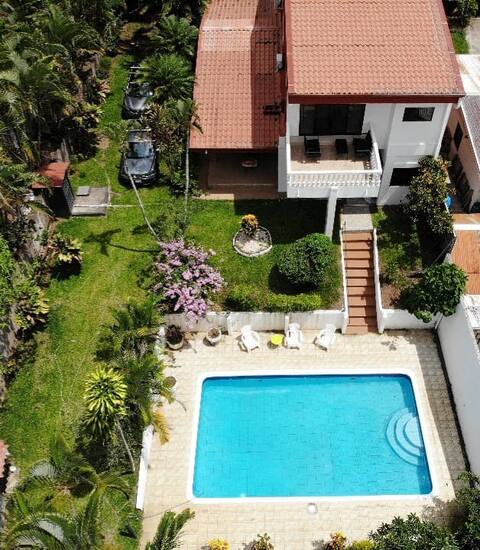
Large country property with pool / entire property
Entire Place • 3 bedrooms
Ascencio House, La Garita, Mexico
Entire Place • 3 bedrooms
Note: Performance varies based on location, size, amenities, seasonality, and management quality. Data reflects the past 12 months.
Top Performing Airbnb Hosts in Garita (2025)
Learn from the best! This table showcases top-performing Airbnb hosts in Garita based on the number of properties managed and estimated total revenue over the past year. Analyze their scale and performance metrics.
| Host Name | Properties | Grossing Revenue | Stay Reviews | Avg Rating |
|---|---|---|---|---|
| Daniel | 1 | $35,261 | 49 | 4.94/5.0 |
| Luis | 1 | $32,734 | 20 | 4.85/5.0 |
| Victor | 1 | $30,938 | 132 | 4.73/5.0 |
| Sergio | 2 | $20,212 | 34 | 4.98/5.0 |
| Lee | 1 | $19,453 | 11 | 5.00/5.0 |
| Amene | 1 | $19,400 | 70 | 4.64/5.0 |
| Yorleny | 1 | $15,068 | 33 | 4.76/5.0 |
| Maria Jesus | 1 | $11,876 | 32 | 4.59/5.0 |
| Manuel | 1 | $11,173 | 36 | 4.78/5.0 |
| Silvia | 1 | $9,911 | 1 | Not Rated |
Analyzing the strategies of top hosts, such as their property selection, pricing, and guest communication, can offer valuable lessons for optimizing your own Airbnb operations in Garita.
Dive Deeper: Advanced Garita STR Market Data (2025)
Ready to unlock more insights? AirROI provides access to advanced metrics and comprehensive Airbnb data for Garita. Explore detailed analytics beyond this report to refine your investment strategy, optimize pricing, and maximize your vacation rental profits.
Explore Advanced MetricsGarita Short-Term Rental Market Composition (2025): Property & Room Types
Room Type Distribution
Property Type Distribution
Market Composition Insights for Garita
- The Garita Airbnb market composition is heavily skewed towards Entire Home/Apt listings, which make up 88.9% of the 18 active rentals. This indicates strong guest preference for privacy and space.
- Looking at the property type distribution in Garita, House properties are the most common (83.3%), reflecting the local real estate landscape.
- Houses represent a significant 83.3% portion, catering likely to families or larger groups.
- The presence of 11.1% Hotel/Boutique listings indicates integration with traditional hospitality.
Garita Airbnb Room Capacity Analysis (2025): Bedroom Distribution
Distribution of Listings by Number of Bedrooms
Room Capacity Insights for Garita
- The dominant room capacity in Garita is 3 bedrooms listings, making up 38.9% of the market. This suggests a strong demand for properties suitable for families or small groups.
- Together, 3 bedrooms and 2 bedrooms properties represent 55.6% of the active Airbnb listings in Garita, indicating a high concentration in these sizes.
- A significant 66.7% of listings offer 3+ bedrooms, catering to larger groups and families seeking more space in Garita.
Garita Vacation Rental Guest Capacity Trends (2025)
Distribution of Listings by Guest Capacity
Guest Capacity Insights for Garita
- The most common guest capacity trend in Garita vacation rentals is listings accommodating 8+ guests (44.4%). This suggests the primary traveler segment is likely larger groups.
- Properties designed for 8+ guests and 6 guests dominate the Garita STR market, accounting for 72.2% of listings.
- 77.8% of properties accommodate 6+ guests, serving the market segment for larger families or group travel in Garita.
- On average, properties in Garita are equipped to host 6.2 guests.
Garita Airbnb Booking Patterns (2025): Available vs. Booked Days
Available Days Distribution
Booked Days Distribution
Booking Pattern Insights for Garita
- The most common availability pattern in Garita falls within the 271-366 days range, representing 66.7% of listings. This suggests many properties have significant open periods on their calendars.
- Approximately 100.0% of listings show high availability (181+ days open annually), indicating potential for increased bookings or specific owner usage patterns.
- For booked days, the 31-90 days range is most frequent in Garita (38.9%), reflecting common guest stay durations or potential owner blocking patterns.
Garita Airbnb Minimum Stay Requirements Analysis
Distribution of Listings by Minimum Night Requirement
1 Night
12 listings
66.7% of total
2 Nights
1 listings
5.6% of total
3 Nights
1 listings
5.6% of total
4-6 Nights
1 listings
5.6% of total
30+ Nights
3 listings
16.7% of total
Key Insights
- The most prevalent minimum stay requirement in Garita is 1 Night, adopted by 66.7% of listings. This highlights the market's preference for shorter, flexible bookings.
- A strong majority (72.3%) of the Garita Airbnb data shows acceptance of very short stays (1-2 nights), indicating a dynamic, high-turnover market.
- A significant segment (16.7%) caters to monthly stays (30+ nights) in Garita, pointing to opportunities in the extended-stay market.
Recommendations
- Align with the market by considering a 1 Night minimum stay, as 66.7% of Garita hosts use this setting.
- Explore offering discounts for stays of 30+ nights to attract the 16.7% of the market seeking extended stays.
- Adjust minimum nights based on seasonality – potentially shorter during low season and longer during peak demand periods in Garita.
Garita Airbnb Cancellation Policy Trends Analysis (2025)
Flexible
7 listings
41.2% of total
Moderate
6 listings
35.3% of total
Firm
3 listings
17.6% of total
Strict
1 listings
5.9% of total
Cancellation Policy Insights for Garita
- The prevailing Airbnb cancellation policy trend in Garita is Flexible, used by 41.2% of listings.
- The market strongly favors guest-friendly terms, with 76.5% of listings offering Flexible or Moderate policies. This suggests guests in Garita may expect booking flexibility.
- Strict cancellation policies are quite rare (5.9%), potentially making listings with this policy less competitive unless justified by high demand or property type.
Recommendations for Hosts
- Consider adopting a Flexible policy to align with the 41.2% market standard in Garita.
- Using a Strict policy might deter some guests, as only 5.9% of listings use it. Evaluate if potential revenue protection outweighs possible lower booking rates.
- Regularly review your cancellation policy against competitors and market demand shifts in Garita.
Garita STR Booking Lead Time Analysis (2025)
Average Booking Lead Time by Month
Booking Lead Time Insights for Garita
- The overall average booking lead time for vacation rentals in Garita is 47 days.
- Guests book furthest in advance for stays during August (average 58 days), likely coinciding with peak travel demand or local events.
- The shortest booking windows occur for stays in November (average 30 days), indicating more last-minute travel plans during this time.
- Seasonally, Summer (48 days avg.) sees the longest lead times, while Fall (31 days avg.) has the shortest, reflecting typical travel planning cycles.
Recommendations for Hosts
- Use the overall average lead time (47 days) as a baseline for your pricing and availability strategy in Garita.
- For August stays, consider implementing length-of-stay discounts or slightly higher rates for bookings made less than 58 days out to capitalize on advance planning.
- Target marketing efforts for the Summer season well in advance (at least 48 days) to capture early planners.
- Monitor your own booking lead times against these Garita averages to identify opportunities for dynamic pricing adjustments.
Popular & Essential Airbnb Amenities in Garita (2025)
Amenity Prevalence
Amenity Insights for Garita
- Popular amenities like Free parking on premises, Wifi, Washer are common but not universal. Offering these can provide a competitive edge.
- A pool is a highly desired but not standard amenity, making it a key feature for attracting guests seeking leisure in Garita.
- Warning: Wifi is not universally provided but is considered essential globally. Ensure reliable Wifi is offered.
Recommendations for Hosts
- Consider adding popular differentiators like Free parking on premises or Wifi to increase appeal.
- Highlight unique or less common amenities you offer (e.g., hot tub, dedicated workspace, EV charger) in your listing description and photos.
- Regularly check competitor amenities in Garita to stay competitive.
Garita Airbnb Guest Demographics & Profile Analysis (2025)
Guest Profile Summary for Garita
- The typical guest profile for Airbnb in Garita consists of a mix of domestic (63%) and international guests, often arriving from nearby San José, typically belonging to the Post-2000s (Gen Z/Alpha) group (50%), primarily speaking Spanish or English.
- Domestic travelers account for 62.9% of guests.
- Key international markets include Costa Rica (62.9%) and United States (20.6%).
- Top languages spoken are Spanish (43.4%) followed by English (40.7%).
- A significant demographic segment is the Post-2000s (Gen Z/Alpha) group, representing 50% of guests.
Recommendations for Hosts
- Target domestic marketing efforts towards travelers from San José and Heredia.
- Tailor amenities and listing descriptions to appeal to the dominant Post-2000s (Gen Z/Alpha) demographic (e.g., highlight fast WiFi, smart home features, local guides).
- Highlight unique local experiences or amenities relevant to the primary guest profile.
- Consider seasonal promotions aligned with peak travel times for key origin markets.
Nearby Short-Term Rental Market Comparison
How does the Garita Airbnb market stack up against its neighbors? Compare key performance metrics like average monthly revenue, ADR, and occupancy rates in surrounding areas to understand the broader regional STR landscape.
| Market | Active Properties | Monthly Revenue | Daily Rate | Avg. Occupancy |
|---|---|---|---|---|
| Nacascolo | 32 | $7,159 | $1165.34 | 35% |
| Pinilla | 74 | $5,903 | $615.78 | 37% |
| Playa Tamarindo | 21 | $5,694 | $409.60 | 48% |
| Playa Langosta | 164 | $4,968 | $497.33 | 42% |
| Punta Islita | 28 | $4,963 | $551.73 | 37% |
| Tamarindo | 1,232 | $4,671 | $411.22 | 44% |
| Cabo Velas | 944 | $3,808 | $400.71 | 40% |
| Nosara | 864 | $3,759 | $433.44 | 42% |
| Tempate | 698 | $3,352 | $398.13 | 38% |
| Quepos | 1,125 | $2,927 | $258.22 | 41% |