Tambor Airbnb Market Analysis 2026: Short Term Rental Data & Vacation Rental Statistics in Alajuela Province, Costa Rica
Is Airbnb profitable in Tambor in 2026? Explore comprehensive Airbnb analytics for Tambor, Alajuela Province, Costa Rica to uncover income potential. This 2026 STR market report for Tambor, based on AirROI data from February 2025 to January 2026, reveals key trends in the niche market of 18 active listings.
Whether you're considering an Airbnb investment in Tambor, optimizing your existing vacation rental, or exploring rental arbitrage opportunities, understanding the Tambor Airbnb data is crucial. Leveraging the low regulation environment is key to maximizing your short term rental income potential. Let's dive into the specifics.
Key Tambor Airbnb Performance Metrics Overview
Monthly Airbnb Revenue Variations & Income Potential in Tambor (2026)
Understanding the monthly revenue variations for Airbnb listings in Tambor is key to maximizing your short term rental income potential. Seasonality significantly impacts earnings. Our analysis, based on data from the past 12 months, shows that the peak revenue month for STRs in Tambor is typically August, while May often presents the lowest earnings, highlighting opportunities for strategic pricing adjustments during shoulder and low seasons. Explore the typical Airbnb income in Tambor across different performance tiers:
- Best-in-class properties (Top 10%) achieve $2,120+ monthly, often utilizing dynamic pricing and superior guest experiences.
- Strong performing properties (Top 25%) earn $1,197 or more, indicating effective management and desirable locations/amenities.
- Typical properties (Median) generate around $620 per month, representing the average market performance.
- Entry-level properties (Bottom 25%) see earnings around $319, often with potential for optimization.
Average Monthly Airbnb Earnings Trend in Tambor
Tambor Airbnb Occupancy Rate Trends (2026)
Maximize your bookings by understanding the Tambor STR occupancy trends. Seasonal demand shifts significantly influence how often properties are booked. Typically, Marchsees the highest demand (peak season occupancy), while May experiences the lowest (low season). Effective strategies, like adjusting minimum stays or offering promotions, can boost occupancy during slower periods. Here's how different property tiers perform in Tambor:
- Best-in-class properties (Top 10%) achieve 60%+ occupancy, indicating high desirability and potentially optimized availability.
- Strong performing properties (Top 25%) maintain 40% or higher occupancy, suggesting good market fit and guest satisfaction.
- Typical properties (Median) have an occupancy rate around 25%.
- Entry-level properties (Bottom 25%) average 12% occupancy, potentially facing higher vacancy.
Average Monthly Occupancy Rate Trend in Tambor
Average Daily Rate (ADR) Airbnb Trends in Tambor (2026)
Effective short term rental pricing strategy in Tambor involves understanding monthly ADR fluctuations. The Average Daily Rate (ADR) for Airbnb in Tambor typically peaks in December and dips lowest during March. Leveraging Airbnb dynamic pricing tools or strategies based on this seasonality can significantly boost revenue. Here's a look at the typical nightly rates achieved:
- Best-in-class properties (Top 10%) command rates of $173+ per night, often due to premium features or locations.
- Strong performing properties (Top 25%) achieve nightly rates of $135 or more.
- Typical properties (Median) charge around $86 per night.
- Entry-level properties (Bottom 25%) earn around $71 per night.
Average Daily Rate (ADR) Trend by Month in Tambor
Get Live Tambor Market Intelligence 👇

Explore Real-time Analytics
Airbnb Seasonality Analysis & Trends in Tambor (2026)
Peak Season (August, January, March)
- Revenue averages $1,452 per month
- Occupancy rates average 36.5%
- Daily rates average $121
Shoulder Season
- Revenue averages $935 per month
- Occupancy maintains around 29.4%
- Daily rates hold near $123
Low Season (May, June, October)
- Revenue drops to average $502 per month
- Occupancy decreases to average 19.4%
- Daily rates adjust to average $123
Seasonality Insights for Tambor
- The Airbnb seasonality in Tambor shows highly seasonal trends requiring careful strategy. While the sections above show seasonal averages, it's also insightful to look at the extremes:
- During the high season, the absolute peak month showcases Tambor's highest earning potential, with monthly revenues capable of climbing to $1,519, occupancy reaching a high of 40.0%, and ADRs peaking at $133.
- Conversely, the slowest single month of the year, typically falling within the low season, marks the market's lowest point. In this month, revenue might dip to $444, occupancy could drop to 17.4%, and ADRs may adjust down to $114.
- Understanding both the seasonal averages and these monthly peaks and troughs in revenue, occupancy, and ADR is crucial for maximizing your Airbnb profit potential in Tambor.
Seasonal Strategies for Maximizing Profit
- Peak Season: Maximize revenue through premium pricing and potentially longer minimum stays. Ensure high availability.
- Low Season: Offer competitive pricing, special promotions (e.g., extended stay discounts), and flexible cancellation policies. Target off-season travelers like remote workers or budget-conscious guests.
- Shoulder Seasons: Implement dynamic pricing that balances peak and low rates. Target weekend travelers or specific events. Offer slightly more flexible terms than peak season.
- Regularly analyze your own performance against these Tambor seasonality benchmarks and adjust your pricing and availability strategy accordingly.
Best Areas for Airbnb Investment in Tambor (2026)
Exploring the top neighborhoods for short-term rentals in Tambor? This section highlights key areas, outlining why they are attractive for hosts and guests, along with notable local attractions. Consider these locations based on your target guest profile and investment strategy.
| Neighborhood / Area | Why Host Here? (Target Guests & Appeal) | Key Attractions & Landmarks |
|---|---|---|
| Tambor Beach | A stunning beach destination within easy reach of various attractions. Known for its serene atmosphere, it's perfect for vacationers looking to relax by the ocean and enjoy water activities. | Tambor Beach, Cabo Blanco Nature Reserve, Curú Wildlife Refuge, Playa Curu, Scuba Diving Tours |
| Montezuma | A vibrant beach town known for its bohemian vibe and beautiful waterfalls. Attracts tourists who appreciate nature, yoga retreats, and holistic wellness. | Montezuma Waterfalls, Cabo Blanco Nature Reserve, beachfront cafes, art galleries, yoga retreats |
| Santa Teresa | Famous for its surfing spots and laid-back lifestyle, Santa Teresa is a popular destination for young travelers and surf enthusiasts. | Santa Teresa Beach, Surfing schools, Playa Hermosa, National Parks, wellness retreats |
| Mal Pais | Known for its picturesque beaches and tranquil atmosphere, Mal Pais is ideal for those seeking a quieter getaway with access to nature and ocean scenery. | Mal Pais Beach, Playa Santa Teresa, Cabo Blanco Nature Reserve, Surf spots, snorkeling |
| Nosara | A beautiful beach town recognized for its yoga centers and eco-friendly environment, appealing to health-conscious travelers and nature lovers. | Nosara Beach, Ostional Wildlife Refuge, Yoga retreats, Surfing, Local markets |
| Cabo Blanco | Costa Rica's first natural reserve, offering pristine beaches and diverse wildlife. Great for eco-tourism and nature enthusiasts. | Cabo Blanco Nature Reserve, beach hikes, wildlife viewing, snorkeling, historical sites |
| La Fortuna | While not directly in Tambor, La Fortuna is renowned for its waterfalls, hot springs, and stunning views of Arenal Volcano. A must-visit for adventure seekers and nature lovers. | Arenal Volcano, La Fortuna Waterfall, Hot Springs, Hiking Trails, Local markets |
| Playas del Coco | Near Tambor, this lively fishing town offers entertainment, restaurants, and access to beautiful beaches, suitable for family travelers and those looking for a social atmosphere. | Playas del Coco Beach, Fishing activities, Nightlife, Diving spots, Restaurants and bars |
Understanding Airbnb License Requirements & STR Laws in Tambor (2026)
While Tambor, Alajuela Province, Costa Rica currently shows low STR regulations, specific Airbnb license requirements might still exist or change. Always verify the latest short term rental regulations and Airbnb license requirements directly with local government authorities for Tambor to ensure full compliance before hosting.
(Source: AirROI data, 2026, finding no licensed listings among those analyzed)
Top Performing Airbnb Properties in Tambor (2026)
Benchmark your potential! Explore examples of top-performing Airbnb properties in Tamborbased on Trailing Twelve Month (TTM) revenue. Analyze their characteristics, revenue, occupancy rate, and ADR to understand what drives success in this market.
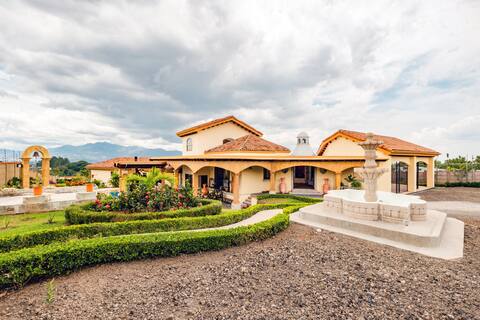
Luxury Villa The Retreat
Entire Place • 5 bedrooms
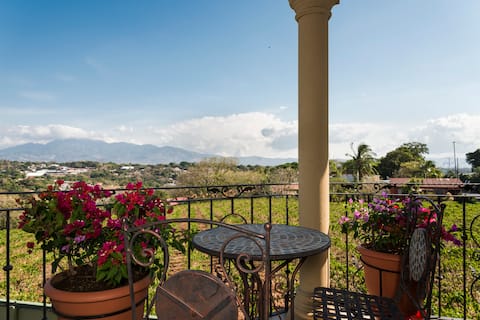
Ruta Verde BB Apartment Pool & Café by SJO Airport
Private Room • 2 bedrooms
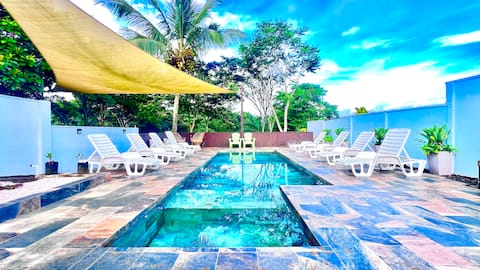
Quinta Cacao de Alajuela, beautiful with a pool
Entire Place • 4 bedrooms

Ruta Verde BB Suite/Pool & Coffee By SJO Airport
Private Room • 1 bedroom

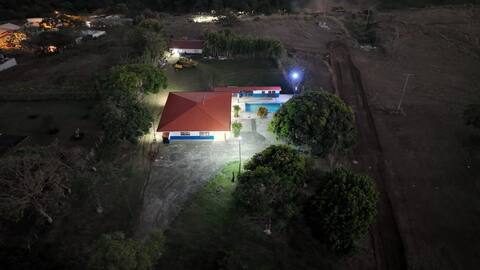
Villa Heliconias
Entire Place • 2 bedrooms
Green Route BB Deluxe Suite/Cuisine/Car Rental
Private Room • 1 bedroom
Note: Performance varies based on location, size, amenities, seasonality, and management quality. Data reflects the past 12 months.
Top Performing Airbnb Hosts in Tambor (2026)
Learn from the best! This table showcases top-performing Airbnb hosts in Tambor based on the number of properties managed and estimated total revenue over the past year. Analyze their scale and performance metrics.
| Host Name | Properties | Grossing Revenue | Stay Reviews | Avg Rating |
|---|---|---|---|---|
| Ruta Verde BB | 8 | $52,827 | 1701 | 4.77/5.0 |
| Alexandra | 1 | $35,817 | 64 | 4.83/5.0 |
| Alonso | 2 | $16,487 | 46 | 4.92/5.0 |
| Randall | 1 | $14,537 | 4 | 5.00/5.0 |
| Florin,Victor | 1 | $5,578 | 1 | Not Rated |
| Jorge | 1 | $4,219 | 26 | 4.35/5.0 |
| Carlos | 1 | $3,732 | 18 | 4.83/5.0 |
| Carolina | 2 | $1,750 | 4 | Not Rated |
| Roberto | 1 | $984 | 32 | 4.97/5.0 |
Analyzing the strategies of top hosts, such as their property selection, pricing, and guest communication, can offer valuable lessons for optimizing your own Airbnb operations in Tambor.
Dive Deeper: Advanced Tambor STR Market Data (2026)
Ready to unlock more insights? AirROI provides access to advanced metrics and comprehensive Airbnb data for Tambor. Explore detailed analytics beyond this report to refine your investment strategy, optimize pricing, and maximize your vacation rental profits.
Explore Advanced MetricsTambor Short-Term Rental Market Composition (2026): Property & Room Types
Room Type Distribution
Property Type Distribution
Market Composition Insights for Tambor
- The Tambor Airbnb market composition is heavily skewed towards Entire Home/Apt listings, which make up 55.6% of the 18 active rentals. This indicates strong guest preference for privacy and space.
- However, a notable 44.4% share for Private Rooms suggests opportunities for budget-conscious travelers or hosts renting out spare rooms.
- Looking at the property type distribution in Tambor, Hotel/Boutique properties are the most common (44.4%), reflecting the local real estate landscape.
- Houses represent a significant 27.8% portion, catering likely to families or larger groups.
- The presence of 44.4% Hotel/Boutique listings indicates integration with traditional hospitality.
Tambor Airbnb Room Capacity Analysis (2026): Bedroom Distribution
Distribution of Listings by Number of Bedrooms
Room Capacity Insights for Tambor
- The dominant room capacity in Tambor is 1 bedroom listings, making up 33.3% of the market. This suggests a strong demand for properties suitable for couples or solo travelers.
- Together, 1 bedroom and 2 bedrooms properties represent 66.6% of the active Airbnb listings in Tambor, indicating a high concentration in these sizes.
- A significant 27.9% of listings offer 3+ bedrooms, catering to larger groups and families seeking more space in Tambor.
Tambor Vacation Rental Guest Capacity Trends (2026)
Distribution of Listings by Guest Capacity
Guest Capacity Insights for Tambor
- The most common guest capacity trend in Tambor vacation rentals is listings accommodating 4 guests (27.8%). This suggests the primary traveler segment is likely small families or groups.
- Properties designed for 4 guests and 2 guests dominate the Tambor STR market, accounting for 55.6% of listings.
- 27.8% of properties accommodate 6+ guests, serving the market segment for larger families or group travel in Tambor.
- On average, properties in Tambor are equipped to host 4.2 guests.
Tambor Airbnb Booking Patterns (2026): Available vs. Booked Days
Available Days Distribution
Booked Days Distribution
Booking Pattern Insights for Tambor
- The most common availability pattern in Tambor falls within the 271-366 days range, representing 66.7% of listings. This suggests many properties have significant open periods on their calendars.
- Approximately 94.5% of listings show high availability (181+ days open annually), indicating potential for increased bookings or specific owner usage patterns.
- For booked days, the 31-90 days range is most frequent in Tambor (33.3%), reflecting common guest stay durations or potential owner blocking patterns.
- A notable 5.6% of properties secure long booking periods (181+ days booked per year), highlighting successful long-term rental strategies or significant owner usage.
Tambor Airbnb Minimum Stay Requirements Analysis
Distribution of Listings by Minimum Night Requirement
1 Night
15 listings
83.3% of total
2 Nights
1 listings
5.6% of total
3 Nights
1 listings
5.6% of total
30+ Nights
1 listings
5.6% of total
Key Insights
- The most prevalent minimum stay requirement in Tambor is 1 Night, adopted by 83.3% of listings. This highlights the market's preference for shorter, flexible bookings.
- A strong majority (88.9%) of the Tambor Airbnb data shows acceptance of very short stays (1-2 nights), indicating a dynamic, high-turnover market.
Recommendations
- Align with the market by considering a 1 Night minimum stay, as 83.3% of Tambor hosts use this setting.
- Explore offering discounts for stays of 30+ nights to attract the 5.6% of the market seeking extended stays.
- Adjust minimum nights based on seasonality – potentially shorter during low season and longer during peak demand periods in Tambor.
Tambor Airbnb Cancellation Policy Trends Analysis (2026)
Flexible
3 listings
16.7% of total
Moderate
8 listings
44.4% of total
Firm
5 listings
27.8% of total
Strict
2 listings
11.1% of total
Cancellation Policy Insights for Tambor
- The prevailing Airbnb cancellation policy trend in Tambor is Moderate, used by 44.4% of listings.
- There's a relatively balanced mix between guest-friendly (61.1%) and stricter (38.9%) policies, offering choices for different guest needs.
Recommendations for Hosts
- Consider adopting a Moderate policy to align with the 44.4% market standard in Tambor.
- Using a Strict policy might deter some guests, as only 11.1% of listings use it. Evaluate if potential revenue protection outweighs possible lower booking rates.
- Regularly review your cancellation policy against competitors and market demand shifts in Tambor.
Tambor STR Booking Lead Time Analysis (2026)
Average Booking Lead Time by Month
Booking Lead Time Insights for Tambor
- The overall average booking lead time for vacation rentals in Tambor is 34 days.
- Guests book furthest in advance for stays during January (average 56 days), likely coinciding with peak travel demand or local events.
- The shortest booking windows occur for stays in June (average 17 days), indicating more last-minute travel plans during this time.
- Seasonally, Winter (50 days avg.) sees the longest lead times, while Fall (23 days avg.) has the shortest, reflecting typical travel planning cycles.
Recommendations for Hosts
- Use the overall average lead time (34 days) as a baseline for your pricing and availability strategy in Tambor.
- For January stays, consider implementing length-of-stay discounts or slightly higher rates for bookings made less than 56 days out to capitalize on advance planning.
- Target marketing efforts for the Winter season well in advance (at least 50 days) to capture early planners.
- Monitor your own booking lead times against these Tambor averages to identify opportunities for dynamic pricing adjustments.
Popular & Essential Airbnb Amenities in Tambor (2026)
Amenity Prevalence
Amenity Insights for Tambor
- Essential amenities in Tambor that guests expect include: Free parking on premises, Wifi. Lacking these (any) could significantly impact bookings.
- Popular amenities like TV, Coffee maker, Bed linens are common but not universal. Offering these can provide a competitive edge.
Recommendations for Hosts
- Ensure your listing includes all essential amenities for Tambor: Free parking on premises, Wifi.
- Consider adding popular differentiators like TV or Coffee maker to increase appeal.
- Highlight unique or less common amenities you offer (e.g., hot tub, dedicated workspace, EV charger) in your listing description and photos.
- Regularly check competitor amenities in Tambor to stay competitive.
Tambor Airbnb Guest Demographics & Profile Analysis (2026)
Guest Profile Summary for Tambor
- The typical guest profile for Airbnb in Tambor consists of predominantly international visitors (88%), with top international origins including Costa Rica, typically belonging to the Post-2000s (Gen Z/Alpha) group (50%), primarily speaking English or Spanish.
- Domestic travelers account for 11.8% of guests.
- Key international markets include United States (53.8%) and Costa Rica (11.8%).
- Top languages spoken are English (51.8%) followed by Spanish (25%).
- A significant demographic segment is the Post-2000s (Gen Z/Alpha) group, representing 50% of guests.
Recommendations for Hosts
- Focus marketing internationally, particularly towards travelers from Costa Rica.
- Tailor amenities and listing descriptions to appeal to the dominant Post-2000s (Gen Z/Alpha) demographic (e.g., highlight fast WiFi, smart home features, local guides).
- Highlight unique local experiences or amenities relevant to the primary guest profile.
- Consider seasonal promotions aligned with peak travel times for key origin markets.
Nearby Short-Term Rental Market Comparison
How does the Tambor Airbnb market stack up against its neighbors? Compare key performance metrics like average monthly revenue, ADR, and occupancy rates in surrounding areas to understand the broader regional STR landscape.
| Market | Active Properties | Monthly Revenue | Daily Rate | Avg. Occupancy |
|---|---|---|---|---|
| Nacascolo | 32 | $6,132 | $1145.14 | 33% |
| Pinilla | 91 | $4,982 | $544.03 | 35% |
| Playa Tamarindo | 21 | $4,869 | $404.48 | 44% |
| Playa Langosta | 163 | $4,380 | $474.00 | 39% |
| Punta Islita | 27 | $4,193 | $518.64 | 36% |
| Tamarindo | 1,302 | $3,897 | $386.82 | 41% |
| Osa | 10 | $3,418 | $586.45 | 32% |
| Cabo Velas | 922 | $3,316 | $381.01 | 38% |
| Playa Grande | 33 | $3,195 | $397.35 | 40% |
| Nosara | 873 | $3,169 | $421.13 | 39% |