Sixaola Airbnb Market Analysis 2026: Short Term Rental Data & Vacation Rental Statistics in Cantón Talamanca, Costa Rica
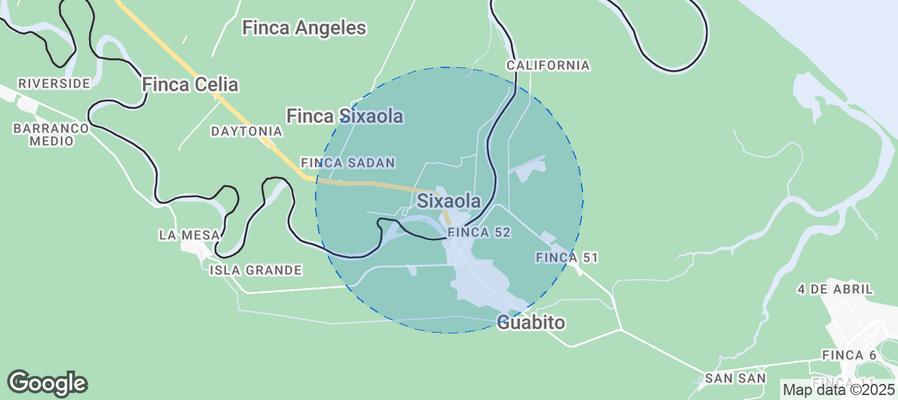
Is Airbnb profitable in Sixaola in 2026? Explore comprehensive Airbnb analytics for Sixaola, Cantón Talamanca, Costa Rica to uncover income potential. This 2026 STR market report for Sixaola, based on AirROI data from February 2025 to January 2026, reveals key trends in the niche market of 24 active listings.
Whether you're considering an Airbnb investment in Sixaola, optimizing your existing vacation rental, or exploring rental arbitrage opportunities, understanding the Sixaola Airbnb data is crucial. Leveraging the low regulation environment is key to maximizing your short term rental income potential. Let's dive into the specifics.
Key Sixaola Airbnb Performance Metrics Overview
Monthly Airbnb Revenue Variations & Income Potential in Sixaola (2026)
Understanding the monthly revenue variations for Airbnb listings in Sixaola is key to maximizing your short term rental income potential. Seasonality significantly impacts earnings. Our analysis, based on data from the past 12 months, shows that the peak revenue month for STRs in Sixaola is typically November, while January often presents the lowest earnings, highlighting opportunities for strategic pricing adjustments during shoulder and low seasons. Explore the typical Airbnb income in Sixaola across different performance tiers:
- Best-in-class properties (Top 10%) achieve $4,623+ monthly, often utilizing dynamic pricing and superior guest experiences.
- Strong performing properties (Top 25%) earn $2,372 or more, indicating effective management and desirable locations/amenities.
- Typical properties (Median) generate around $682 per month, representing the average market performance.
- Entry-level properties (Bottom 25%) see earnings around $265, often with potential for optimization.
Average Monthly Airbnb Earnings Trend in Sixaola
Sixaola Airbnb Occupancy Rate Trends (2026)
Maximize your bookings by understanding the Sixaola STR occupancy trends. Seasonal demand shifts significantly influence how often properties are booked. Typically, Augustsees the highest demand (peak season occupancy), while October experiences the lowest (low season). Effective strategies, like adjusting minimum stays or offering promotions, can boost occupancy during slower periods. Here's how different property tiers perform in Sixaola:
- Best-in-class properties (Top 10%) achieve 62%+ occupancy, indicating high desirability and potentially optimized availability.
- Strong performing properties (Top 25%) maintain 42% or higher occupancy, suggesting good market fit and guest satisfaction.
- Typical properties (Median) have an occupancy rate around 19%.
- Entry-level properties (Bottom 25%) average 8% occupancy, potentially facing higher vacancy.
Average Monthly Occupancy Rate Trend in Sixaola
Average Daily Rate (ADR) Airbnb Trends in Sixaola (2026)
Effective short term rental pricing strategy in Sixaola involves understanding monthly ADR fluctuations. The Average Daily Rate (ADR) for Airbnb in Sixaola typically peaks in January and dips lowest during June. Leveraging Airbnb dynamic pricing tools or strategies based on this seasonality can significantly boost revenue. Here's a look at the typical nightly rates achieved:
- Best-in-class properties (Top 10%) command rates of $258+ per night, often due to premium features or locations.
- Strong performing properties (Top 25%) achieve nightly rates of $158 or more.
- Typical properties (Median) charge around $98 per night.
- Entry-level properties (Bottom 25%) earn around $74 per night.
Average Daily Rate (ADR) Trend by Month in Sixaola
Get Live Sixaola Market Intelligence 👇
Explore Real-time Analytics
Airbnb Seasonality Analysis & Trends in Sixaola (2026)
Peak Season (November, April, August)
- Revenue averages $1,911 per month
- Occupancy rates average 31.2%
- Daily rates average $130
Shoulder Season
- Revenue averages $1,676 per month
- Occupancy maintains around 28.0%
- Daily rates hold near $130
Low Season (January, June, December)
- Revenue drops to average $1,082 per month
- Occupancy decreases to average 21.9%
- Daily rates adjust to average $133
Seasonality Insights for Sixaola
- The Airbnb seasonality in Sixaola shows moderate seasonality with distinct peak and low periods. While the sections above show seasonal averages, it's also insightful to look at the extremes:
- During the high season, the absolute peak month showcases Sixaola's highest earning potential, with monthly revenues capable of climbing to $1,921, occupancy reaching a high of 41.5%, and ADRs peaking at $139.
- Conversely, the slowest single month of the year, typically falling within the low season, marks the market's lowest point. In this month, revenue might dip to $866, occupancy could drop to 17.0%, and ADRs may adjust down to $124.
- Understanding both the seasonal averages and these monthly peaks and troughs in revenue, occupancy, and ADR is crucial for maximizing your Airbnb profit potential in Sixaola.
Seasonal Strategies for Maximizing Profit
- Peak Season: Maximize revenue through premium pricing and potentially longer minimum stays. Ensure high availability.
- Low Season: Offer competitive pricing, special promotions (e.g., extended stay discounts), and flexible cancellation policies. Target off-season travelers like remote workers or budget-conscious guests.
- Shoulder Seasons: Implement dynamic pricing that balances peak and low rates. Target weekend travelers or specific events. Offer slightly more flexible terms than peak season.
- Regularly analyze your own performance against these Sixaola seasonality benchmarks and adjust your pricing and availability strategy accordingly.
Best Areas for Airbnb Investment in Sixaola (2026)
Exploring the top neighborhoods for short-term rentals in Sixaola? This section highlights key areas, outlining why they are attractive for hosts and guests, along with notable local attractions. Consider these locations based on your target guest profile and investment strategy.
| Neighborhood / Area | Why Host Here? (Target Guests & Appeal) | Key Attractions & Landmarks |
|---|---|---|
| Sixaola Town | A charming village near the border with Panama, offering a unique cultural experience and access to nature. Popular for visitors looking to explore both Costa Rica and Panama, ideal for family and nature-focused trips. | Sixaola River, Border Crossing to Panama, Local Markets, Tropical Gardens, Wildlife Observation |
| Cahuita National Park | Famous for its beautiful beaches, coral reefs, and diverse wildlife. An excellent spot for eco-tourism and adventure seekers, perfect for Airbnb hosts catering to nature lovers. | Cahuita Beach, Coral Reefs, Wildlife Trails, Snorkeling Tours, Ecological Tours |
| Puerto Viejo de Talamanca | A vibrant beach town known for its Afro-Caribbean culture and stunning beaches. Attracts surfers, backpackers, and travelers looking for a laid-back atmosphere with plenty of nightlife options. | Punta Uva Beach, Cocles Beach, La Feria, Gandoca-Manzanillo National Wildlife Refuge, Nightlife and Bars |
| Bribri Indigenous Reserve | A unique opportunity to experience indigenous culture and natural beauty. Offers eco-tourism and cultural exchanges, appealing to travelers interested in diverse cultural experiences. | Bribri Waterfalls, Cultural Tours, Chocolate Tours, Organic Farms, Natural Hot Springs |
| Punta Uva | Known for its stunning beaches and lush nature, it’s a perfect getaway for tourists seeking relaxation and adventure. Offers opportunities for swimming, snorkeling, and wildlife spotting. | Punta Uva Beach, Snorkeling, Wildlife Tours, Kayaking, Local Restaurants |
| Manzanillo | A small village with a strong community feel and pristine beaches. Popular among visitors looking for tranquility and natural beauty, ideal for couples and solo travelers. | Manzanillo Beach, Gandoca-Manzanillo Wildlife Sanctuary, Local Cuisine, Beachfront Relaxation, Fishing and Boat Tours |
| Cocles Beach | Beautiful beach known for its surf and laid-back vibe. Attracts surfers and tourists looking for a lively beach atmosphere, perfect for hosting young travelers. | Surfing Spots, Beach Bars, Restaurants, Tropical Scenery, Yoga Retreats |
| Limon | The capital of the Limon province, known for its Afro-Caribbean culture, beaches, and port. Great for tourists looking for cultural experiences and local festivities. | Limon Beach, Port and Cruise Ship Terminal, Local Festivals, Cultural Heritage Sites, Nature Reserves |
Understanding Airbnb License Requirements & STR Laws in Sixaola (2026)
While Sixaola, Cantón Talamanca, Costa Rica currently shows low STR regulations, specific Airbnb license requirements might still exist or change. Always verify the latest short term rental regulations and Airbnb license requirements directly with local government authorities for Sixaola to ensure full compliance before hosting.
(Source: AirROI data, 2026, based on 4% licensed listings)
Top Performing Airbnb Properties in Sixaola (2026)
Benchmark your potential! Explore examples of top-performing Airbnb properties in Sixaolabased on Trailing Twelve Month (TTM) revenue. Analyze their characteristics, revenue, occupancy rate, and ADR to understand what drives success in this market.
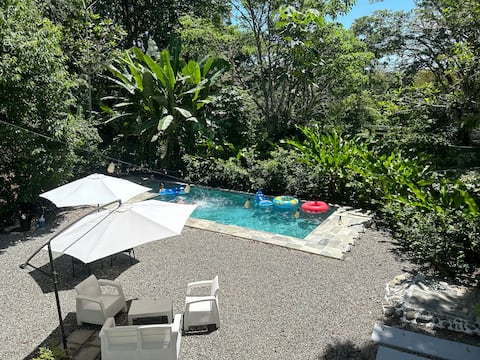
Beautiful house with private pool to rest & relax
Entire Place • 2 bedrooms
Villa Paraíso w/ pool and AC-15 min from Punta Uva
Entire Place • 3 bedrooms

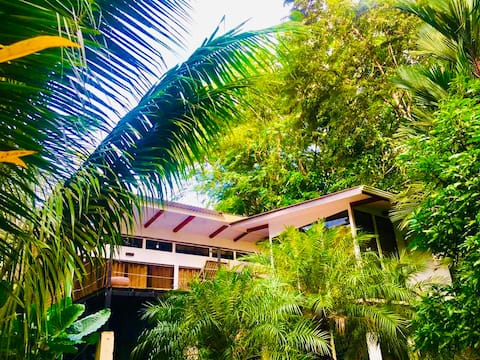
Peaceful Jungle Paradise (CASA)
Entire Place • 2 bedrooms
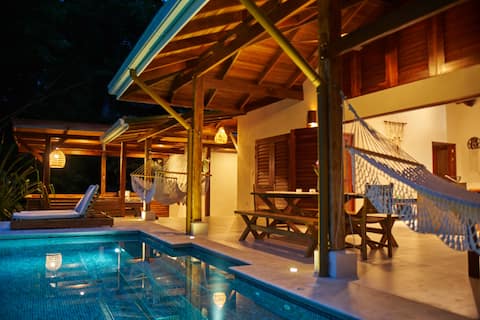
Luxury Tropical Villa with Pool and Guest House
Entire Place • 2 bedrooms
Casa Alma Caribeña, Cocles (Fiber Optic, Pool)
Entire Place • 4 bedrooms
Jane's Garden Home in the Rainforest of Gandoca
Entire Place • 2 bedrooms
Note: Performance varies based on location, size, amenities, seasonality, and management quality. Data reflects the past 12 months.
Top Performing Airbnb Hosts in Sixaola (2026)
Learn from the best! This table showcases top-performing Airbnb hosts in Sixaola based on the number of properties managed and estimated total revenue over the past year. Analyze their scale and performance metrics.
| Host Name | Properties | Grossing Revenue | Stay Reviews | Avg Rating |
|---|---|---|---|---|
| Analaura | 1 | $60,321 | 41 | 4.93/5.0 |
| Terry And Tracie | 2 | $45,324 | 47 | 5.00/5.0 |
| Rodolfo | 1 | $43,156 | 30 | 4.77/5.0 |
| Los Suenos Properties | 1 | $13,932 | 1 | Not Rated |
| Carlos | 1 | $13,006 | 49 | 4.73/5.0 |
| Valérie | 1 | $12,729 | 4 | 5.00/5.0 |
| Mariusz | 4 | $12,031 | 27 | 4.45/5.0 |
| Laura | 1 | $10,096 | 1 | Not Rated |
| Mona | 1 | $9,491 | 21 | 5.00/5.0 |
| Sven | 1 | $2,963 | 2 | Not Rated |
Analyzing the strategies of top hosts, such as their property selection, pricing, and guest communication, can offer valuable lessons for optimizing your own Airbnb operations in Sixaola.
Dive Deeper: Advanced Sixaola STR Market Data (2026)
Ready to unlock more insights? AirROI provides access to advanced metrics and comprehensive Airbnb data for Sixaola. Explore detailed analytics beyond this report to refine your investment strategy, optimize pricing, and maximize your vacation rental profits.
Explore Advanced MetricsSixaola Short-Term Rental Market Composition (2026): Property & Room Types
Room Type Distribution
Property Type Distribution
Market Composition Insights for Sixaola
- The Sixaola Airbnb market composition is heavily skewed towards Entire Home/Apt listings, which make up 91.7% of the 24 active rentals. This indicates strong guest preference for privacy and space.
- Looking at the property type distribution in Sixaola, House properties are the most common (79.2%), reflecting the local real estate landscape.
- Houses represent a significant 79.2% portion, catering likely to families or larger groups.
- Smaller segments like hotel/boutique (combined 4.2%) offer potential for unique stay experiences.
Sixaola Airbnb Room Capacity Analysis (2026): Bedroom Distribution
Distribution of Listings by Number of Bedrooms
Room Capacity Insights for Sixaola
- The dominant room capacity in Sixaola is 2 bedrooms listings, making up 41.7% of the market. This suggests a strong demand for properties suitable for couples or solo travelers.
- Together, 2 bedrooms and 1 bedroom properties represent 79.2% of the active Airbnb listings in Sixaola, indicating a high concentration in these sizes.
Sixaola Vacation Rental Guest Capacity Trends (2026)
Distribution of Listings by Guest Capacity
Guest Capacity Insights for Sixaola
- The most common guest capacity trend in Sixaola vacation rentals is listings accommodating 2 guests (33.3%). This suggests the primary traveler segment is likely couples or solo travelers.
- Properties designed for 2 guests and 4 guests dominate the Sixaola STR market, accounting for 62.5% of listings.
- 25.0% of properties accommodate 6+ guests, serving the market segment for larger families or group travel in Sixaola.
- On average, properties in Sixaola are equipped to host 4.1 guests.
Sixaola Airbnb Booking Patterns (2026): Available vs. Booked Days
Available Days Distribution
Booked Days Distribution
Booking Pattern Insights for Sixaola
- The most common availability pattern in Sixaola falls within the 271-366 days range, representing 79.2% of listings. This suggests many properties have significant open periods on their calendars.
- Approximately 95.9% of listings show high availability (181+ days open annually), indicating potential for increased bookings or specific owner usage patterns.
- For booked days, the 1-30 days range is most frequent in Sixaola (50%), reflecting common guest stay durations or potential owner blocking patterns.
- A notable 4.2% of properties secure long booking periods (181+ days booked per year), highlighting successful long-term rental strategies or significant owner usage.
Sixaola Airbnb Minimum Stay Requirements Analysis
Distribution of Listings by Minimum Night Requirement
1 Night
6 listings
25% of total
2 Nights
10 listings
41.7% of total
3 Nights
1 listings
4.2% of total
4-6 Nights
2 listings
8.3% of total
30+ Nights
5 listings
20.8% of total
Key Insights
- The most prevalent minimum stay requirement in Sixaola is 2 Nights, adopted by 41.7% of listings. This highlights the market's preference for shorter, flexible bookings.
- A strong majority (66.7%) of the Sixaola Airbnb data shows acceptance of very short stays (1-2 nights), indicating a dynamic, high-turnover market.
- A significant segment (20.8%) caters to monthly stays (30+ nights) in Sixaola, pointing to opportunities in the extended-stay market.
Recommendations
- Align with the market by considering a 2 Nights minimum stay, as 41.7% of Sixaola hosts use this setting.
- If feasible, allowing 1-night stays, especially midweek or during low season, could capture last-minute bookings, as only 25% currently do.
- Explore offering discounts for stays of 30+ nights to attract the 20.8% of the market seeking extended stays.
- Adjust minimum nights based on seasonality – potentially shorter during low season and longer during peak demand periods in Sixaola.
Sixaola Airbnb Cancellation Policy Trends Analysis (2026)
Flexible
10 listings
41.7% of total
Moderate
7 listings
29.2% of total
Firm
6 listings
25% of total
Strict
1 listings
4.2% of total
Cancellation Policy Insights for Sixaola
- The prevailing Airbnb cancellation policy trend in Sixaola is Flexible, used by 41.7% of listings.
- The market strongly favors guest-friendly terms, with 70.9% of listings offering Flexible or Moderate policies. This suggests guests in Sixaola may expect booking flexibility.
- Strict cancellation policies are quite rare (4.2%), potentially making listings with this policy less competitive unless justified by high demand or property type.
Recommendations for Hosts
- Consider adopting a Flexible policy to align with the 41.7% market standard in Sixaola.
- Using a Strict policy might deter some guests, as only 4.2% of listings use it. Evaluate if potential revenue protection outweighs possible lower booking rates.
- Regularly review your cancellation policy against competitors and market demand shifts in Sixaola.
Sixaola STR Booking Lead Time Analysis (2026)
Average Booking Lead Time by Month
Booking Lead Time Insights for Sixaola
- The overall average booking lead time for vacation rentals in Sixaola is 38 days.
- Guests book furthest in advance for stays during November (average 75 days), likely coinciding with peak travel demand or local events.
- The shortest booking windows occur for stays in June (average 9 days), indicating more last-minute travel plans during this time.
- Seasonally, Winter (49 days avg.) sees the longest lead times, while Spring (28 days avg.) has the shortest, reflecting typical travel planning cycles.
Recommendations for Hosts
- Use the overall average lead time (38 days) as a baseline for your pricing and availability strategy in Sixaola.
- For November stays, consider implementing length-of-stay discounts or slightly higher rates for bookings made less than 75 days out to capitalize on advance planning.
- During June, focus on last-minute booking availability and promotions, as guests book with very short notice (9 days avg.).
- Target marketing efforts for the Winter season well in advance (at least 49 days) to capture early planners.
- Monitor your own booking lead times against these Sixaola averages to identify opportunities for dynamic pricing adjustments.
Popular & Essential Airbnb Amenities in Sixaola (2026)
Amenity Prevalence
Amenity Insights for Sixaola
- Essential amenities in Sixaola that guests expect include: Free parking on premises, Wifi. Lacking these (any) could significantly impact bookings.
- Popular amenities like Kitchen, Hot water, Refrigerator are common but not universal. Offering these can provide a competitive edge.
Recommendations for Hosts
- Ensure your listing includes all essential amenities for Sixaola: Free parking on premises, Wifi.
- Prioritize adding missing essentials: Free parking on premises, Wifi.
- Consider adding popular differentiators like Kitchen or Hot water to increase appeal.
- Highlight unique or less common amenities you offer (e.g., hot tub, dedicated workspace, EV charger) in your listing description and photos.
- Regularly check competitor amenities in Sixaola to stay competitive.
Sixaola Airbnb Guest Demographics & Profile Analysis (2026)
Guest Profile Summary for Sixaola
- The typical guest profile for Airbnb in Sixaola consists of a mix of domestic (58%) and international guests, often arriving from nearby San José, typically belonging to the Post-2000s (Gen Z/Alpha) group (50%), primarily speaking Spanish or English.
- Domestic travelers account for 58.1% of guests.
- Key international markets include Costa Rica (58.1%) and United States (16.3%).
- Top languages spoken are Spanish (40.5%) followed by English (40.5%).
- A significant demographic segment is the Post-2000s (Gen Z/Alpha) group, representing 50% of guests.
Recommendations for Hosts
- Balance marketing efforts between domestic and international channels based on the guest mix.
- Tailor amenities and listing descriptions to appeal to the dominant Post-2000s (Gen Z/Alpha) demographic (e.g., highlight fast WiFi, smart home features, local guides).
- Highlight unique local experiences or amenities relevant to the primary guest profile.
- Consider seasonal promotions aligned with peak travel times for key origin markets.
Nearby Short-Term Rental Market Comparison
How does the Sixaola Airbnb market stack up against its neighbors? Compare key performance metrics like average monthly revenue, ADR, and occupancy rates in surrounding areas to understand the broader regional STR landscape.
| Market | Active Properties | Monthly Revenue | Daily Rate | Avg. Occupancy |
|---|---|---|---|---|
| Osa | 10 | $3,418 | $586.45 | 32% |
| Savegre de Aguirre | 15 | $2,740 | $372.47 | 36% |
| Savegre | 186 | $2,150 | $256.31 | 34% |
| Bahía Ballena | 1,282 | $2,099 | $237.59 | 37% |
| Cahuita | 2,053 | $1,396 | $147.36 | 37% |
| Potrero Cerrado | 10 | $1,208 | $128.50 | 26% |
| Bocas del Toro | 490 | $1,157 | $154.59 | 34% |
| Bastimentos | 103 | $1,125 | $193.27 | 29% |
| Boca Chica | 29 | $1,106 | $217.98 | 29% |
| Puerto Cortés | 241 | $1,084 | $160.97 | 33% |