Filadelfia Airbnb Market Analysis 2026: Short Term Rental Data & Vacation Rental Statistics in Provincia de Guanacaste, Costa Rica
Is Airbnb profitable in Filadelfia in 2026? Explore comprehensive Airbnb analytics for Filadelfia, Provincia de Guanacaste, Costa Rica to uncover income potential. This 2026 STR market report for Filadelfia, based on AirROI data from June 2024 to May 2025, reveals key trends in the niche market of 19 active listings.
Whether you're considering an Airbnb investment in Filadelfia, optimizing your existing vacation rental, or exploring rental arbitrage opportunities, understanding the Filadelfia Airbnb data is crucial. Understanding the local regulations is key to maximizing your short term rental income potential. Let's dive into the specifics.
Key Filadelfia Airbnb Performance Metrics Overview
Monthly Airbnb Revenue Variations & Income Potential in Filadelfia (2026)
Understanding the monthly revenue variations for Airbnb listings in Filadelfia is key to maximizing your short term rental income potential. Seasonality significantly impacts earnings. Our analysis, based on data from the past 12 months, shows that the peak revenue month for STRs in Filadelfia is typically October, while June often presents the lowest earnings, highlighting opportunities for strategic pricing adjustments during shoulder and low seasons. Explore the typical Airbnb income in Filadelfia across different performance tiers:
- Best-in-class properties (Top 10%) achieve $14,169+ monthly, often utilizing dynamic pricing and superior guest experiences.
- Strong performing properties (Top 25%) earn $9,098 or more, indicating effective management and desirable locations/amenities.
- Typical properties (Median) generate around $2,751 per month, representing the average market performance.
- Entry-level properties (Bottom 25%) see earnings around $1,024, often with potential for optimization.
Average Monthly Airbnb Earnings Trend in Filadelfia
Filadelfia Airbnb Occupancy Rate Trends (2026)
Maximize your bookings by understanding the Filadelfia STR occupancy trends. Seasonal demand shifts significantly influence how often properties are booked. Typically, Junesees the highest demand (peak season occupancy), while May experiences the lowest (low season). Effective strategies, like adjusting minimum stays or offering promotions, can boost occupancy during slower periods. Here's how different property tiers perform in Filadelfia:
- Best-in-class properties (Top 10%) achieve 55%+ occupancy, indicating high desirability and potentially optimized availability.
- Strong performing properties (Top 25%) maintain 39% or higher occupancy, suggesting good market fit and guest satisfaction.
- Typical properties (Median) have an occupancy rate around 30%.
- Entry-level properties (Bottom 25%) average 23% occupancy, potentially facing higher vacancy.
Average Monthly Occupancy Rate Trend in Filadelfia
Average Daily Rate (ADR) Airbnb Trends in Filadelfia (2026)
Effective short term rental pricing strategy in Filadelfia involves understanding monthly ADR fluctuations. The Average Daily Rate (ADR) for Airbnb in Filadelfia typically peaks in December and dips lowest during May. Leveraging Airbnb dynamic pricing tools or strategies based on this seasonality can significantly boost revenue. Here's a look at the typical nightly rates achieved:
- Best-in-class properties (Top 10%) command rates of $735+ per night, often due to premium features or locations.
- Strong performing properties (Top 25%) achieve nightly rates of $465 or more.
- Typical properties (Median) charge around $116 per night.
- Entry-level properties (Bottom 25%) earn around $64 per night.
Average Daily Rate (ADR) Trend by Month in Filadelfia
Get Live Filadelfia Market Intelligence 👇

Explore Real-time Analytics
Airbnb Seasonality Analysis & Trends in Filadelfia (2025)
Peak Season (October, November, September)
- Revenue averages $9,457 per month
- Occupancy rates average 26.3%
- Daily rates average $356
Shoulder Season
- Revenue averages $5,306 per month
- Occupancy maintains around 31.7%
- Daily rates hold near $360
Low Season (April, May, June)
- Revenue drops to average $1,663 per month
- Occupancy decreases to average 36.8%
- Daily rates adjust to average $318
Seasonality Insights for Filadelfia
- The Airbnb seasonality in Filadelfia shows highly seasonal trends requiring careful strategy. While the sections above show seasonal averages, it's also insightful to look at the extremes:
- During the high season, the absolute peak month showcases Filadelfia's highest earning potential, with monthly revenues capable of climbing to $11,263, occupancy reaching a high of 63.3%, and ADRs peaking at $429.
- Conversely, the slowest single month of the year, typically falling within the low season, marks the market's lowest point. In this month, revenue might dip to $645, occupancy could drop to 21.5%, and ADRs may adjust down to $270.
- Understanding both the seasonal averages and these monthly peaks and troughs in revenue, occupancy, and ADR is crucial for maximizing your Airbnb profit potential in Filadelfia.
Seasonal Strategies for Maximizing Profit
- Peak Season: Maximize revenue through premium pricing and potentially longer minimum stays. Ensure high availability.
- Low Season: Offer competitive pricing, special promotions (e.g., extended stay discounts), and flexible cancellation policies. Target off-season travelers like remote workers or budget-conscious guests.
- Shoulder Seasons: Implement dynamic pricing that balances peak and low rates. Target weekend travelers or specific events. Offer slightly more flexible terms than peak season.
- Regularly analyze your own performance against these Filadelfia seasonality benchmarks and adjust your pricing and availability strategy accordingly.
Best Areas for Airbnb Investment in Filadelfia (2026)
Exploring the top neighborhoods for short-term rentals in Filadelfia? This section highlights key areas, outlining why they are attractive for hosts and guests, along with notable local attractions. Consider these locations based on your target guest profile and investment strategy.
| Neighborhood / Area | Why Host Here? (Target Guests & Appeal) | Key Attractions & Landmarks |
|---|---|---|
| Playa Potrero | A tranquil beach town known for its stunning views and clear waters. Attracts tourists looking for relaxation and water activities such as snorkeling and fishing. | Playa Potrero Beach, Diving and snorkeling tours, Sailing excursions, Potrero Bay |
| Playa Flamingo | Famous for its beautiful beach with powdery white sand and vibrant nightlife. Highly sought after by both tourists and investors for vacation rentals. | Playa Flamingo Beach, Flamingo Marina, Sunset views, Local restaurants and bars |
| Surfside | A laid-back beach community popular for surfers and families alike. Offers great waves and a charming, relaxed vibe that's perfect for vacationers. | Surfing spots, Shops and restaurants along the beach, Beachfront activities |
| Cabo Velas | Known for its luxury developments and stunning ocean views, Cabo Velas attracts high-end travelers and has a growing rental market. | Playa Grande, National Park Marino Las Baulas, Turtle watching tours, Golf courses |
| Tamarindo | A vibrant beach town famous for its surf culture and nightlife. It's one of the most popular destinations for tourists and has a strong Airbnb market. | Tamarindo Beach, Surf schools, Nightlife and dining, Wildlife watching tours |
| Los Pargos | An emerging spot for tourists looking for a quieter beach experience. Great for eco-tourism and attracting nature lovers. | Playa Negra, Surfing and yoga retreats, Nature reserves |
| Hacienda Pinilla | A luxury resort community that offers a variety of amenities and access to beautiful beaches, appealing to both tourists and investors. | Private beaches, Golf course, Equestrian center, Spa services |
| Santa Cruz | A charming town in the mountains known for its culture and local cuisine. A unique option for travelers seeking an authentic Costa Rican experience. | Local artisan markets, Cultural festivals, Traditional food experiences |
Understanding Airbnb License Requirements & STR Laws in Filadelfia (2026)
With 16% of listings showing registration in 2026, understanding potential Airbnb license requirements is crucial in Filadelfia. Always verify the latest short term rental regulations and Airbnb license requirements directly with local government authorities for Filadelfia to ensure full compliance before hosting.
(Source: AirROI data, 2026, based on 16% licensed listings)
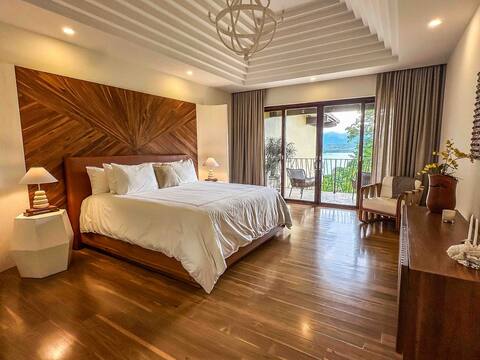
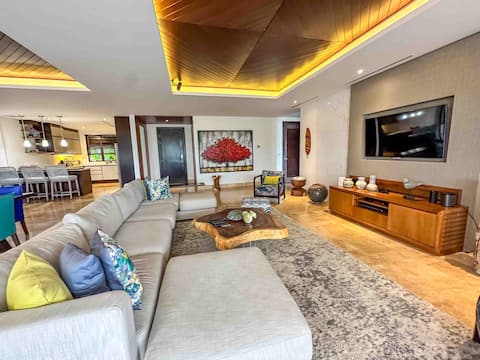
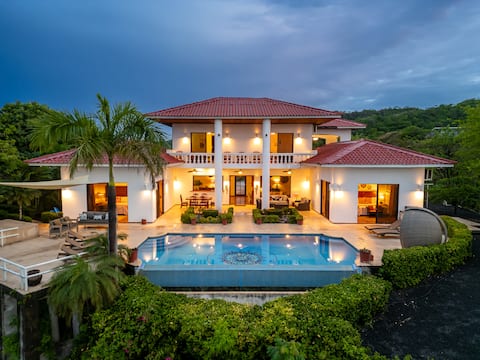
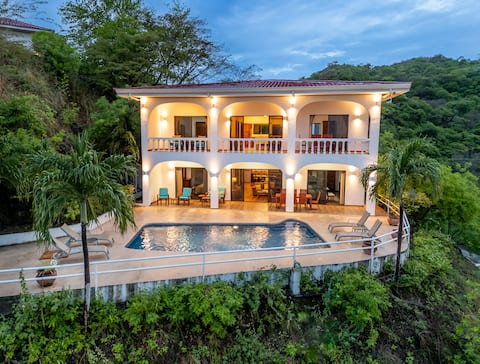
Top Performing Airbnb Properties in Filadelfia (2026)
Benchmark your potential! Explore examples of top-performing Airbnb properties in Filadelfiabased on Trailing Twelve Month (TTM) revenue. Analyze their characteristics, revenue, occupancy rate, and ADR to understand what drives success in this market.
Amazing Condo on exclusive Peninsula Papagayo
Entire Place • 3 bedrooms
Amazing Family Condo-Exclusive Peninsula Papagayo
Entire Place • 3 bedrooms
New Listing! Villa Allamanda
Entire Place • N/A
New Listing! Villa Lantana
Entire Place • 4 bedrooms

Enchanting Garden House with Panoramic Views
Entire Place • 3 bedrooms

The Grand Seaclusion
Entire Place • 4 bedrooms
Note: Performance varies based on location, size, amenities, seasonality, and management quality. Data reflects the past 12 months.
Top Performing Airbnb Hosts in Filadelfia (2026)
Learn from the best! This table showcases top-performing Airbnb hosts in Filadelfia based on the number of properties managed and estimated total revenue over the past year. Analyze their scale and performance metrics.
| Host Name | Properties | Grossing Revenue | Stay Reviews | Avg Rating |
|---|---|---|---|---|
| Host #80585034 | 2 | $283,168 | 0 | Not Rated |
| Host #96335001 | 2 | $140,932 | 0 | Not Rated |
| CasIdeal | 2 | $63,051 | 3 | 5.00/5.0 |
| Host #364179275 | 1 | $15,140 | 0 | Not Rated |
| Host #58184786 | 1 | $14,380 | 0 | Not Rated |
| Host #4686026 | 1 | $10,022 | 0 | Not Rated |
| Host #363368462 | 1 | $6,569 | 0 | Not Rated |
| Yarina | 1 | $2,855 | 4 | 5.00/5.0 |
| Host #526585041 | 1 | $2,774 | 0 | Not Rated |
| Coastal Property Management | 1 | $2,540 | 2 | Not Rated |
Analyzing the strategies of top hosts, such as their property selection, pricing, and guest communication, can offer valuable lessons for optimizing your own Airbnb operations in Filadelfia.
Dive Deeper: Advanced Filadelfia STR Market Data (2026)
Ready to unlock more insights? AirROI provides access to advanced metrics and comprehensive Airbnb data for Filadelfia. Explore detailed analytics beyond this report to refine your investment strategy, optimize pricing, and maximize your vacation rental profits.
Explore Advanced MetricsFiladelfia Short-Term Rental Market Composition (2026): Property & Room Types
Room Type Distribution
Property Type Distribution
Market Composition Insights for Filadelfia
- The Filadelfia Airbnb market composition is heavily skewed towards Entire Home/Apt listings, which make up 84.2% of the 19 active rentals. This indicates strong guest preference for privacy and space.
- Looking at the property type distribution in Filadelfia, House properties are the most common (63.2%), reflecting the local real estate landscape.
- Houses represent a significant 63.2% portion, catering likely to families or larger groups.
Filadelfia Airbnb Room Capacity Analysis (2026): Bedroom Distribution
Distribution of Listings by Number of Bedrooms
Room Capacity Insights for Filadelfia
- The dominant room capacity in Filadelfia is 1 bedroom listings, making up 31.6% of the market. This suggests a strong demand for properties suitable for couples or solo travelers.
- Together, 1 bedroom and 2 bedrooms properties represent 57.9% of the active Airbnb listings in Filadelfia, indicating a high concentration in these sizes.
- A significant 42.1% of listings offer 3+ bedrooms, catering to larger groups and families seeking more space in Filadelfia.
Filadelfia Vacation Rental Guest Capacity Trends (2026)
Distribution of Listings by Guest Capacity
Guest Capacity Insights for Filadelfia
- The most common guest capacity trend in Filadelfia vacation rentals is listings accommodating 8+ guests (47.4%). This suggests the primary traveler segment is likely larger groups.
- Properties designed for 8+ guests and 4 guests dominate the Filadelfia STR market, accounting for 73.7% of listings.
- 58.0% of properties accommodate 6+ guests, serving the market segment for larger families or group travel in Filadelfia.
- On average, properties in Filadelfia are equipped to host 6.2 guests.
Filadelfia Airbnb Booking Patterns (2026): Available vs. Booked Days
Available Days Distribution
Booked Days Distribution
Booking Pattern Insights for Filadelfia
- The most common availability pattern in Filadelfia falls within the 271-366 days range, representing 84.2% of listings. This suggests many properties have significant open periods on their calendars.
- Approximately 100.0% of listings show high availability (181+ days open annually), indicating potential for increased bookings or specific owner usage patterns.
- For booked days, the 1-30 days range is most frequent in Filadelfia (42.1%), reflecting common guest stay durations or potential owner blocking patterns.
Filadelfia Airbnb Minimum Stay Requirements Analysis
Distribution of Listings by Minimum Night Requirement
1 Night
4 listings
21.1% of total
2 Nights
3 listings
15.8% of total
3 Nights
1 listings
5.3% of total
4-6 Nights
3 listings
15.8% of total
30+ Nights
8 listings
42.1% of total
Key Insights
- The most prevalent minimum stay requirement in Filadelfia is 30+ Nights, adopted by 42.1% of listings. This highlights the market's preference for longer commitments.
- A significant segment (42.1%) caters to monthly stays (30+ nights) in Filadelfia, pointing to opportunities in the extended-stay market.
Recommendations
- Align with the market by considering a 30+ Nights minimum stay, as 42.1% of Filadelfia hosts use this setting.
- If feasible, allowing 1-night stays, especially midweek or during low season, could capture last-minute bookings, as only 21.1% currently do.
- Explore offering discounts for stays of 30+ nights to attract the 42.1% of the market seeking extended stays.
- Adjust minimum nights based on seasonality – potentially shorter during low season and longer during peak demand periods in Filadelfia.
Filadelfia Airbnb Cancellation Policy Trends Analysis (2026)
Flexible
3 listings
37.5% of total
Moderate
1 listings
12.5% of total
Firm
2 listings
25% of total
Strict
2 listings
25% of total
Cancellation Policy Insights for Filadelfia
- The prevailing Airbnb cancellation policy trend in Filadelfia is Flexible, used by 37.5% of listings.
- There's a relatively balanced mix between guest-friendly (50.0%) and stricter (50.0%) policies, offering choices for different guest needs.
Recommendations for Hosts
- Consider adopting a Flexible policy to align with the 37.5% market standard in Filadelfia.
- Regularly review your cancellation policy against competitors and market demand shifts in Filadelfia.
Filadelfia STR Booking Lead Time Analysis (2026)
Average Booking Lead Time by Month
Booking Lead Time Insights for Filadelfia
- The overall average booking lead time for vacation rentals in Filadelfia is 30 days.
- Guests book furthest in advance for stays during March (average 56 days), likely coinciding with peak travel demand or local events.
- The shortest booking windows occur for stays in October (average 2 days), indicating more last-minute travel plans during this time.
- Seasonally, Spring (52 days avg.) sees the longest lead times, while Summer (11 days avg.) has the shortest, reflecting typical travel planning cycles.
Recommendations for Hosts
- Use the overall average lead time (30 days) as a baseline for your pricing and availability strategy in Filadelfia.
- For March stays, consider implementing length-of-stay discounts or slightly higher rates for bookings made less than 56 days out to capitalize on advance planning.
- During October, focus on last-minute booking availability and promotions, as guests book with very short notice (2 days avg.).
- Target marketing efforts for the Spring season well in advance (at least 52 days) to capture early planners.
- Monitor your own booking lead times against these Filadelfia averages to identify opportunities for dynamic pricing adjustments.
Popular & Essential Airbnb Amenities in Filadelfia (2026)
Amenity Prevalence
Amenity Insights for Filadelfia
- Essential amenities in Filadelfia that guests expect include: Wifi, Kitchen, Air conditioning. Lacking these (any) could significantly impact bookings.
- Popular amenities like Free parking on premises, Washer, TV are common but not universal. Offering these can provide a competitive edge.
Recommendations for Hosts
- Ensure your listing includes all essential amenities for Filadelfia: Wifi, Kitchen, Air conditioning.
- Consider adding popular differentiators like Free parking on premises or Washer to increase appeal.
- Highlight unique or less common amenities you offer (e.g., hot tub, dedicated workspace, EV charger) in your listing description and photos.
- Regularly check competitor amenities in Filadelfia to stay competitive.
Filadelfia Airbnb Guest Demographics & Profile Analysis (2026)
Guest Profile Summary for Filadelfia
- The typical guest profile for Airbnb in Filadelfia consists of a mix of domestic (53%) and international guests, often arriving from nearby Cartago, typically belonging to the Post-2000s (Gen Z/Alpha) group (50%), primarily speaking Spanish or English.
- Domestic travelers account for 53.3% of guests.
- Key international markets include Costa Rica (53.3%) and United States (20%).
- Top languages spoken are Spanish (42.1%) followed by English (36.8%).
- A significant demographic segment is the Post-2000s (Gen Z/Alpha) group, representing 50% of guests.
Recommendations for Hosts
- Balance marketing efforts between domestic and international channels based on the guest mix.
- Tailor amenities and listing descriptions to appeal to the dominant Post-2000s (Gen Z/Alpha) demographic (e.g., highlight fast WiFi, smart home features, local guides).
- Highlight unique local experiences or amenities relevant to the primary guest profile.
- Consider seasonal promotions aligned with peak travel times for key origin markets.
Nearby Short-Term Rental Market Comparison
How does the Filadelfia Airbnb market stack up against its neighbors? Compare key performance metrics like average monthly revenue, ADR, and occupancy rates in surrounding areas to understand the broader regional STR landscape.
| Market | Active Properties | Monthly Revenue | Daily Rate | Avg. Occupancy |
|---|---|---|---|---|
| Pinilla | 60 | $6,074 | $666.82 | 37% |
| Nacascolo | 37 | $5,874 | $1305.69 | 32% |
| Playa Tamarindo | 21 | $5,749 | $402.66 | 51% |
| Tamarindo | 139 | $5,016 | $467.65 | 41% |
| Playa Langosta | 158 | $4,478 | $510.68 | 43% |
| Punta Islita | 33 | $4,230 | $582.47 | 36% |
| Tamarindo | 1,092 | $4,100 | $385.79 | 43% |
| Cabo Velas | 901 | $3,465 | $388.34 | 40% |
| Nosara | 895 | $3,198 | $410.98 | 40% |
| Tempate | 708 | $3,015 | $399.02 | 36% |