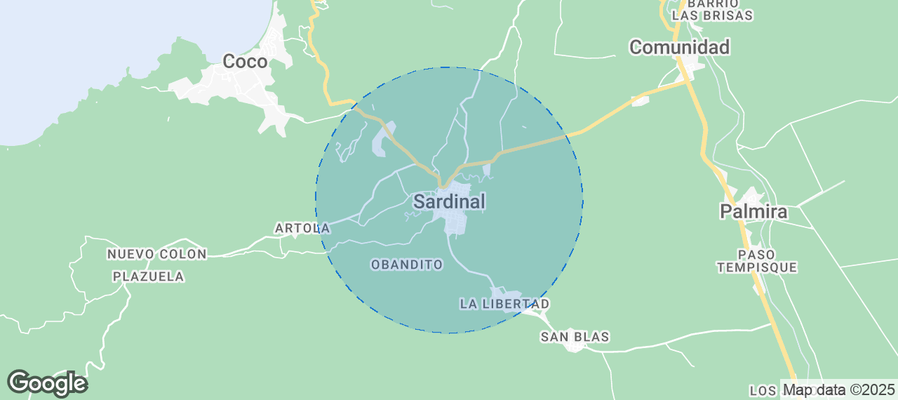
Sardinal Airbnb Market Analysis 2026: Short Term Rental Data & Vacation Rental Statistics in Provincia de Guanacaste, Costa Rica
Is Airbnb profitable in Sardinal in 2026? Explore comprehensive Airbnb analytics for Sardinal, Provincia de Guanacaste, Costa Rica to uncover income potential. This 2026 STR market report for Sardinal, based on AirROI data from February 2025 to January 2026, reveals key trends in the bustling market of 1,400 active listings.
Whether you're considering an Airbnb investment in Sardinal, optimizing your existing vacation rental, or exploring rental arbitrage opportunities, understanding the Sardinal Airbnb data is crucial. Leveraging the low regulation environment is key to maximizing your short term rental income potential. Let's dive into the specifics.
Key Sardinal Airbnb Performance Metrics Overview
Monthly Airbnb Revenue Variations & Income Potential in Sardinal (2026)
Understanding the monthly revenue variations for Airbnb listings in Sardinal is key to maximizing your short term rental income potential. Seasonality significantly impacts earnings. Our analysis, based on data from the past 12 months, shows that the peak revenue month for STRs in Sardinal is typically February, while September often presents the lowest earnings, highlighting opportunities for strategic pricing adjustments during shoulder and low seasons. Explore the typical Airbnb income in Sardinal across different performance tiers:
- Best-in-class properties (Top 10%) achieve $7,092+ monthly, often utilizing dynamic pricing and superior guest experiences.
- Strong performing properties (Top 25%) earn $3,466 or more, indicating effective management and desirable locations/amenities.
- Typical properties (Median) generate around $1,621 per month, representing the average market performance.
- Entry-level properties (Bottom 25%) see earnings around $699, often with potential for optimization.
Average Monthly Airbnb Earnings Trend in Sardinal
Sardinal Airbnb Occupancy Rate Trends (2026)
Maximize your bookings by understanding the Sardinal STR occupancy trends. Seasonal demand shifts significantly influence how often properties are booked. Typically, Februarysees the highest demand (peak season occupancy), while October experiences the lowest (low season). Effective strategies, like adjusting minimum stays or offering promotions, can boost occupancy during slower periods. Here's how different property tiers perform in Sardinal:
- Best-in-class properties (Top 10%) achieve 75%+ occupancy, indicating high desirability and potentially optimized availability.
- Strong performing properties (Top 25%) maintain 55% or higher occupancy, suggesting good market fit and guest satisfaction.
- Typical properties (Median) have an occupancy rate around 33%.
- Entry-level properties (Bottom 25%) average 15% occupancy, potentially facing higher vacancy.
Average Monthly Occupancy Rate Trend in Sardinal
Average Daily Rate (ADR) Airbnb Trends in Sardinal (2026)
Effective short term rental pricing strategy in Sardinal involves understanding monthly ADR fluctuations. The Average Daily Rate (ADR) for Airbnb in Sardinal typically peaks in December and dips lowest during August. Leveraging Airbnb dynamic pricing tools or strategies based on this seasonality can significantly boost revenue. Here's a look at the typical nightly rates achieved:
- Best-in-class properties (Top 10%) command rates of $500+ per night, often due to premium features or locations.
- Strong performing properties (Top 25%) achieve nightly rates of $246 or more.
- Typical properties (Median) charge around $146 per night.
- Entry-level properties (Bottom 25%) earn around $97 per night.
Average Daily Rate (ADR) Trend by Month in Sardinal
Get Live Sardinal Market Intelligence 👇
Explore Real-time Analytics
Airbnb Seasonality Analysis & Trends in Sardinal (2026)
Peak Season (February, March, January)
- Revenue averages $4,218 per month
- Occupancy rates average 50.1%
- Daily rates average $251
Shoulder Season
- Revenue averages $2,933 per month
- Occupancy maintains around 36.0%
- Daily rates hold near $230
Low Season (August, September, October)
- Revenue drops to average $1,877 per month
- Occupancy decreases to average 27.0%
- Daily rates adjust to average $210
Seasonality Insights for Sardinal
- The Airbnb seasonality in Sardinal shows highly seasonal trends requiring careful strategy. While the sections above show seasonal averages, it's also insightful to look at the extremes:
- During the high season, the absolute peak month showcases Sardinal's highest earning potential, with monthly revenues capable of climbing to $4,585, occupancy reaching a high of 58.4%, and ADRs peaking at $264.
- Conversely, the slowest single month of the year, typically falling within the low season, marks the market's lowest point. In this month, revenue might dip to $1,583, occupancy could drop to 25.0%, and ADRs may adjust down to $209.
- Understanding both the seasonal averages and these monthly peaks and troughs in revenue, occupancy, and ADR is crucial for maximizing your Airbnb profit potential in Sardinal.
Seasonal Strategies for Maximizing Profit
- Peak Season: Maximize revenue through premium pricing and potentially longer minimum stays. Ensure high availability.
- Low Season: Offer competitive pricing, special promotions (e.g., extended stay discounts), and flexible cancellation policies. Target off-season travelers like remote workers or budget-conscious guests.
- Shoulder Seasons: Implement dynamic pricing that balances peak and low rates. Target weekend travelers or specific events. Offer slightly more flexible terms than peak season.
- Regularly analyze your own performance against these Sardinal seasonality benchmarks and adjust your pricing and availability strategy accordingly.
Best Areas for Airbnb Investment in Sardinal (2026)
Exploring the top neighborhoods for short-term rentals in Sardinal? This section highlights key areas, outlining why they are attractive for hosts and guests, along with notable local attractions. Consider these locations based on your target guest profile and investment strategy.
| Neighborhood / Area | Why Host Here? (Target Guests & Appeal) | Key Attractions & Landmarks |
|---|---|---|
| Playa Hermosa | Beautiful beach known for its calm waters and relaxing atmosphere. Ideal for families and travelers looking for a peaceful getaway with stunning sunsets. | Playa Hermosa Beach, Local restaurants, Water sports activities, Nature trails, Wildlife viewing |
| Playas del Coco | One of the most popular beach towns in Guanacaste, known for its vibrant nightlife and numerous dining options. Perfect for tourists looking for both relaxation and adventure. | Coco Beach, Nightlife and bars, Water sports and tours, Local markets, Fishing excursions |
| Tamarindo | Famous surf town that attracts tourists year-round. Known for its beautiful beaches, lively atmosphere, and variety of activities. | Tamarindo Beach, Surf schools, Shopping and dining, Estuary tours, Wildlife refuges |
| Four Seasons Resort at Peninsula Papagayo | Luxury resort area that attracts high-end tourists seeking exclusive accommodations and amenities. Great for upscale vacation rentals. | Private beaches, World-class golf courses, Spa and wellness retreats, Nature trails, Fine dining options |
| Rincón de la Vieja | National park known for its biodiversity and volcanic activity. Attracts eco-tourists and adventure seekers looking for outdoor activities. | Hiking trails, Hot springs, Waterfalls, Wildlife viewing, Zip-lining |
| Guanacaste | A province known for its rich culture, natural beauty, and dry tropical climate. Offers diverse experiences from cultural tours to beach days. | National parks, Local culture and festivals, Beaches and coastlines, Rural tourism, Horseback riding |
| Nicoya Peninsula | A popular destination for wellness retreats and surfing. Known for its stunning beaches and laid-back atmosphere. | Santa Teresa Beach, Wellness retreats, Yoga studios, Surfing spots, Local artisanal markets |
| Samara Beach | Quieter beach town that offers a more local experience. Great for families and those looking for off-the-beaten-path destinations. | Samara Beach, Natural reserve, Kayaking, Local dining options, Cultural experiences |
Understanding Airbnb License Requirements & STR Laws in Sardinal (2026)
While Sardinal, Provincia de Guanacaste, Costa Rica currently shows low STR regulations, specific Airbnb license requirements might still exist or change. Always verify the latest short term rental regulations and Airbnb license requirements directly with local government authorities for Sardinal to ensure full compliance before hosting.
(Source: AirROI data, 2026, based on 1% licensed listings)
Top Performing Airbnb Properties in Sardinal (2026)
Benchmark your potential! Explore examples of top-performing Airbnb properties in Sardinalbased on Trailing Twelve Month (TTM) revenue. Analyze their characteristics, revenue, occupancy rate, and ADR to understand what drives success in this market.
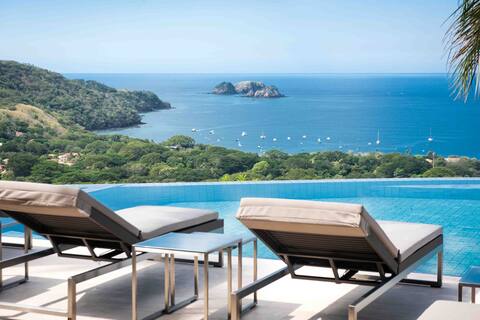
Pictures Perfect Ocean View Villa- King Summit
Entire Place • 6 bedrooms

The Malinche Palace
Entire Place • 8 bedrooms
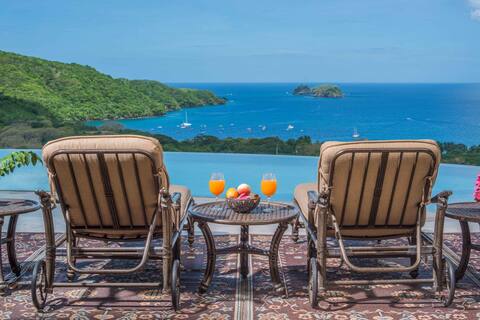
Mar-a-Villa by Star Villas
Entire Place • 5 bedrooms

Villa Madera
Entire Place • 3 bedrooms
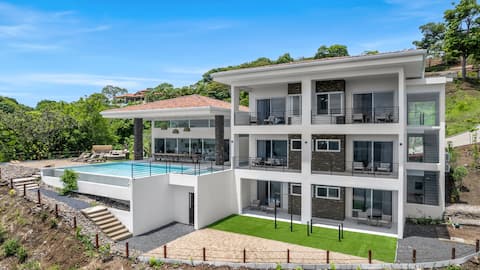
6 Suites - Gated - Vacation Planning Included!
Entire Place • 6 bedrooms

Casa Cardumen - Beachfront Villa
Entire Place • 4 bedrooms
Note: Performance varies based on location, size, amenities, seasonality, and management quality. Data reflects the past 12 months.
Top Performing Airbnb Hosts in Sardinal (2026)
Learn from the best! This table showcases top-performing Airbnb hosts in Sardinal based on the number of properties managed and estimated total revenue over the past year. Analyze their scale and performance metrics.
| Host Name | Properties | Grossing Revenue | Stay Reviews | Avg Rating |
|---|---|---|---|---|
| Rich Coast Vacations | 99 | $3,424,844 | 1319 | 4.81/5.0 |
| Zindis | 67 | $3,038,629 | 939 | 4.83/5.0 |
| Diego | 9 | $1,601,606 | 145 | 4.97/5.0 |
| Krain Vacation Rentals | 21 | $1,194,779 | 776 | 4.79/5.0 |
| The Garrett Group | 42 | $1,005,760 | 822 | 4.75/5.0 |
| Equitykey Group | 59 | $982,735 | 1013 | 4.81/5.0 |
| Brokers Costa Rica | 27 | $847,858 | 391 | 4.90/5.0 |
| Kenny | 26 | $622,235 | 610 | 4.71/5.0 |
| Max | 2 | $470,847 | 407 | 4.88/5.0 |
| Villas Sol | 19 | $430,694 | 378 | 4.65/5.0 |
Analyzing the strategies of top hosts, such as their property selection, pricing, and guest communication, can offer valuable lessons for optimizing your own Airbnb operations in Sardinal.
Dive Deeper: Advanced Sardinal STR Market Data (2026)
Ready to unlock more insights? AirROI provides access to advanced metrics and comprehensive Airbnb data for Sardinal. Explore detailed analytics beyond this report to refine your investment strategy, optimize pricing, and maximize your vacation rental profits.
Explore Advanced MetricsSardinal Short-Term Rental Market Composition (2026): Property & Room Types
Room Type Distribution
Property Type Distribution
Market Composition Insights for Sardinal
- The Sardinal Airbnb market composition is heavily skewed towards Entire Home/Apt listings, which make up 94.4% of the 1,400 active rentals. This indicates strong guest preference for privacy and space.
- Looking at the property type distribution in Sardinal, Apartment/Condo properties are the most common (55.9%), reflecting the local real estate landscape.
- Houses represent a significant 38.4% portion, catering likely to families or larger groups.
- Smaller segments like hotel/boutique, unique stays, others, outdoor/unique (combined 5.7%) offer potential for unique stay experiences.
Sardinal Airbnb Room Capacity Analysis (2026): Bedroom Distribution
Distribution of Listings by Number of Bedrooms
Room Capacity Insights for Sardinal
- The dominant room capacity in Sardinal is 2 bedrooms listings, making up 38.1% of the market. This suggests a strong demand for properties suitable for couples or solo travelers.
- Together, 2 bedrooms and 1 bedroom properties represent 60.0% of the active Airbnb listings in Sardinal, indicating a high concentration in these sizes.
- A significant 33.9% of listings offer 3+ bedrooms, catering to larger groups and families seeking more space in Sardinal.
Sardinal Vacation Rental Guest Capacity Trends (2026)
Distribution of Listings by Guest Capacity
Guest Capacity Insights for Sardinal
- The most common guest capacity trend in Sardinal vacation rentals is listings accommodating 4 guests (29.1%). This suggests the primary traveler segment is likely small families or groups.
- Properties designed for 4 guests and 6 guests dominate the Sardinal STR market, accounting for 49.2% of listings.
- 42.0% of properties accommodate 6+ guests, serving the market segment for larger families or group travel in Sardinal.
- On average, properties in Sardinal are equipped to host 4.9 guests.
Sardinal Airbnb Booking Patterns (2026): Available vs. Booked Days
Available Days Distribution
Booked Days Distribution
Booking Pattern Insights for Sardinal
- The most common availability pattern in Sardinal falls within the 271-366 days range, representing 57.6% of listings. This suggests many properties have significant open periods on their calendars.
- Approximately 88.1% of listings show high availability (181+ days open annually), indicating potential for increased bookings or specific owner usage patterns.
- For booked days, the 31-90 days range is most frequent in Sardinal (35.6%), reflecting common guest stay durations or potential owner blocking patterns.
- A notable 12.6% of properties secure long booking periods (181+ days booked per year), highlighting successful long-term rental strategies or significant owner usage.
Sardinal Airbnb Minimum Stay Requirements Analysis
Distribution of Listings by Minimum Night Requirement
1 Night
174 listings
12.4% of total
2 Nights
271 listings
19.4% of total
3 Nights
179 listings
12.8% of total
4-6 Nights
126 listings
9% of total
7-29 Nights
21 listings
1.5% of total
30+ Nights
629 listings
44.9% of total
Key Insights
- The most prevalent minimum stay requirement in Sardinal is 30+ Nights, adopted by 44.9% of listings. This highlights the market's preference for longer commitments.
- A significant segment (44.9%) caters to monthly stays (30+ nights) in Sardinal, pointing to opportunities in the extended-stay market.
Recommendations
- Align with the market by considering a 30+ Nights minimum stay, as 44.9% of Sardinal hosts use this setting.
- If feasible, allowing 1-night stays, especially midweek or during low season, could capture last-minute bookings, as only 12.4% currently do.
- Explore offering discounts for stays of 30+ nights to attract the 44.9% of the market seeking extended stays.
- Adjust minimum nights based on seasonality – potentially shorter during low season and longer during peak demand periods in Sardinal.
Sardinal Airbnb Cancellation Policy Trends Analysis (2026)
Super Strict 30 Days
135 listings
9.7% of total
Super Strict 60 Days
77 listings
5.6% of total
Limited
19 listings
1.4% of total
Flexible
160 listings
11.5% of total
Moderate
251 listings
18.1% of total
Firm
617 listings
44.5% of total
Strict
128 listings
9.2% of total
Cancellation Policy Insights for Sardinal
- The prevailing Airbnb cancellation policy trend in Sardinal is Firm, used by 44.5% of listings.
- A majority (53.7%) of hosts in Sardinal utilize Firm or Strict policies, indicating a market where hosts prioritize booking security.
- Strict cancellation policies are quite rare (9.2%), potentially making listings with this policy less competitive unless justified by high demand or property type.
Recommendations for Hosts
- Consider adopting a Firm policy to align with the 44.5% market standard in Sardinal.
- Using a Strict policy might deter some guests, as only 9.2% of listings use it. Evaluate if potential revenue protection outweighs possible lower booking rates.
- Regularly review your cancellation policy against competitors and market demand shifts in Sardinal.
Sardinal STR Booking Lead Time Analysis (2026)
Average Booking Lead Time by Month
Booking Lead Time Insights for Sardinal
- The overall average booking lead time for vacation rentals in Sardinal is 62 days.
- Guests book furthest in advance for stays during January (average 110 days), likely coinciding with peak travel demand or local events.
- The shortest booking windows occur for stays in September (average 31 days), indicating more last-minute travel plans during this time.
- Seasonally, Winter (93 days avg.) sees the longest lead times, while Summer (44 days avg.) has the shortest, reflecting typical travel planning cycles.
Recommendations for Hosts
- Use the overall average lead time (62 days) as a baseline for your pricing and availability strategy in Sardinal.
- For January stays, consider implementing length-of-stay discounts or slightly higher rates for bookings made less than 110 days out to capitalize on advance planning.
- Target marketing efforts for the Winter season well in advance (at least 93 days) to capture early planners.
- Monitor your own booking lead times against these Sardinal averages to identify opportunities for dynamic pricing adjustments.
Popular & Essential Airbnb Amenities in Sardinal (2026)
Amenity Prevalence
Amenity Insights for Sardinal
- Essential amenities in Sardinal that guests expect include: Wifi, Air conditioning, TV. Lacking these (any) could significantly impact bookings.
- Popular amenities like Free parking on premises, Kitchen, Pool are common but not universal. Offering these can provide a competitive edge.
- A pool is a highly desired but not standard amenity, making it a key feature for attracting guests seeking leisure in Sardinal.
Recommendations for Hosts
- Ensure your listing includes all essential amenities for Sardinal: Wifi, Air conditioning, TV.
- Prioritize adding missing essentials: Wifi, Air conditioning, TV.
- Consider adding popular differentiators like Free parking on premises or Kitchen to increase appeal.
- Highlight unique or less common amenities you offer (e.g., hot tub, dedicated workspace, EV charger) in your listing description and photos.
- Regularly check competitor amenities in Sardinal to stay competitive.
Sardinal Airbnb Guest Demographics & Profile Analysis (2026)
Guest Profile Summary for Sardinal
- The typical guest profile for Airbnb in Sardinal consists of predominantly international visitors (76%), with top international origins including Costa Rica, typically belonging to the Post-2000s (Gen Z/Alpha) group (50%), primarily speaking English or Spanish.
- Domestic travelers account for 24.0% of guests.
- Key international markets include United States (46.9%) and Costa Rica (24%).
- Top languages spoken are English (52.4%) followed by Spanish (29%).
- A significant demographic segment is the Post-2000s (Gen Z/Alpha) group, representing 50% of guests.
Recommendations for Hosts
- Focus marketing internationally, particularly towards travelers from Costa Rica.
- Tailor amenities and listing descriptions to appeal to the dominant Post-2000s (Gen Z/Alpha) demographic (e.g., highlight fast WiFi, smart home features, local guides).
- Highlight unique local experiences or amenities relevant to the primary guest profile.
- Consider seasonal promotions aligned with peak travel times for key origin markets.
Nearby Short-Term Rental Market Comparison
How does the Sardinal Airbnb market stack up against its neighbors? Compare key performance metrics like average monthly revenue, ADR, and occupancy rates in surrounding areas to understand the broader regional STR landscape.
| Market | Active Properties | Monthly Revenue | Daily Rate | Avg. Occupancy |
|---|---|---|---|---|
| Nacascolo | 32 | $6,132 | $1145.14 | 33% |
| Pinilla | 91 | $4,982 | $544.03 | 35% |
| Playa Tamarindo | 21 | $4,869 | $404.48 | 44% |
| Playa Langosta | 163 | $4,380 | $474.00 | 39% |
| Punta Islita | 27 | $4,193 | $518.64 | 36% |
| Tamarindo | 1,302 | $3,897 | $386.82 | 41% |
| Cabo Velas | 922 | $3,316 | $381.01 | 38% |
| Playa Grande | 33 | $3,195 | $397.35 | 40% |
| Nosara | 873 | $3,169 | $421.13 | 39% |
| Tempate | 681 | $3,024 | $398.54 | 35% |