Santiago de Cuba Airbnb Market Analysis 2025: Short Term Rental Data & Vacation Rental Statistics in Santiago de Cuba, Cuba
Is Airbnb profitable in Santiago de Cuba in 2025? Explore comprehensive Airbnb analytics for Santiago de Cuba, Santiago de Cuba, Cuba to uncover income potential. This 2025 STR market report for Santiago de Cuba, based on AirROI data from May 2024 to April 2025, reveals key trends in the market of 230 active listings.
Whether you're considering an Airbnb investment in Santiago de Cuba, optimizing your existing vacation rental, or exploring rental arbitrage opportunities, understanding the Santiago de Cuba Airbnb data is crucial. Leveraging the low regulation environment is key to maximizing your short term rental income potential. Let's dive into the specifics.
Key Santiago de Cuba Airbnb Performance Metrics Overview
Monthly Airbnb Revenue Variations & Income Potential in Santiago de Cuba (2025)
Understanding the monthly revenue variations for Airbnb listings in Santiago de Cuba is key to maximizing your short term rental income potential. Seasonality significantly impacts earnings. Our analysis, based on data from the past 12 months, shows that the peak revenue month for STRs in Santiago de Cuba is typically May, while December often presents the lowest earnings, highlighting opportunities for strategic pricing adjustments during shoulder and low seasons. Explore the typical Airbnb income in Santiago de Cuba across different performance tiers:
- Best-in-class properties (Top 10%) achieve $877+ monthly, often utilizing dynamic pricing and superior guest experiences.
- Strong performing properties (Top 25%) earn $490 or more, indicating effective management and desirable locations/amenities.
- Typical properties (Median) generate around $279 per month, representing the average market performance.
- Entry-level properties (Bottom 25%) see earnings around $117, often with potential for optimization.
Average Monthly Airbnb Earnings Trend in Santiago de Cuba
Santiago de Cuba Airbnb Occupancy Rate Trends (2025)
Maximize your bookings by understanding the Santiago de Cuba STR occupancy trends. Seasonal demand shifts significantly influence how often properties are booked. Typically, Februarysees the highest demand (peak season occupancy), while June experiences the lowest (low season). Effective strategies, like adjusting minimum stays or offering promotions, can boost occupancy during slower periods. Here's how different property tiers perform in Santiago de Cuba:
- Best-in-class properties (Top 10%) achieve 69%+ occupancy, indicating high desirability and potentially optimized availability.
- Strong performing properties (Top 25%) maintain 45% or higher occupancy, suggesting good market fit and guest satisfaction.
- Typical properties (Median) have an occupancy rate around 23%.
- Entry-level properties (Bottom 25%) average 12% occupancy, potentially facing higher vacancy.
Average Monthly Occupancy Rate Trend in Santiago de Cuba
Average Daily Rate (ADR) Airbnb Trends in Santiago de Cuba (2025)
Effective short term rental pricing strategy in Santiago de Cuba involves understanding monthly ADR fluctuations. The Average Daily Rate (ADR) for Airbnb in Santiago de Cuba typically peaks in July and dips lowest during February. Leveraging Airbnb dynamic pricing tools or strategies based on this seasonality can significantly boost revenue. Here's a look at the typical nightly rates achieved:
- Best-in-class properties (Top 10%) command rates of $46+ per night, often due to premium features or locations.
- Strong performing properties (Top 25%) achieve nightly rates of $34 or more.
- Typical properties (Median) charge around $22 per night.
- Entry-level properties (Bottom 25%) earn around $17 per night.
Average Daily Rate (ADR) Trend by Month in Santiago de Cuba
Get Live Santiago de Cuba Market Intelligence 👇

Explore Real-time Analytics
Airbnb Seasonality Analysis & Trends in Santiago de Cuba (2025)
Peak Season (May, June, November)
- Revenue averages $564 per month
- Occupancy rates average 30.3%
- Daily rates average $33
Shoulder Season
- Revenue averages $414 per month
- Occupancy maintains around 31.8%
- Daily rates hold near $32
Low Season (January, April, December)
- Revenue drops to average $252 per month
- Occupancy decreases to average 30.4%
- Daily rates adjust to average $30
Seasonality Insights for Santiago de Cuba
- The Airbnb seasonality in Santiago de Cuba shows highly seasonal trends requiring careful strategy. While the sections above show seasonal averages, it's also insightful to look at the extremes:
- During the high season, the absolute peak month showcases Santiago de Cuba's highest earning potential, with monthly revenues capable of climbing to $599, occupancy reaching a high of 41.2%, and ADRs peaking at $33.
- Conversely, the slowest single month of the year, typically falling within the low season, marks the market's lowest point. In this month, revenue might dip to $224, occupancy could drop to 26.4%, and ADRs may adjust down to $30.
- Understanding both the seasonal averages and these monthly peaks and troughs in revenue, occupancy, and ADR is crucial for maximizing your Airbnb profit potential in Santiago de Cuba.
Seasonal Strategies for Maximizing Profit
- Peak Season: Maximize revenue through premium pricing and potentially longer minimum stays. Ensure high availability.
- Low Season: Offer competitive pricing, special promotions (e.g., extended stay discounts), and flexible cancellation policies. Target off-season travelers like remote workers or budget-conscious guests.
- Shoulder Seasons: Implement dynamic pricing that balances peak and low rates. Target weekend travelers or specific events. Offer slightly more flexible terms than peak season.
- Regularly analyze your own performance against these Santiago de Cuba seasonality benchmarks and adjust your pricing and availability strategy accordingly.
Best Areas for Airbnb Investment in Santiago de Cuba (2025)
Exploring the top neighborhoods for short-term rentals in Santiago de Cuba? This section highlights key areas, outlining why they are attractive for hosts and guests, along with notable local attractions. Consider these locations based on your target guest profile and investment strategy.
| Neighborhood / Area | Why Host Here? (Target Guests & Appeal) | Key Attractions & Landmarks |
|---|---|---|
| Historical Center | The vibrant cultural heart of Santiago de Cuba, rich in history and colonial architecture. Ideal for tourists who want to experience the authentic Cuban culture and history. | Catedral de Santiago de Cuba, Castillo del Morro, Parque de la Libertad, Casa de la Trova, Museo del Caribe |
| Nodal | A central neighborhood that offers easy access to various attractions and is popular among visitors for its local ambiance. Great for those wanting a mix of tourist and local experiences. | Plaza de Marte, Cerro de la Gran Piedra, Cuba's music scene, Local markets, Santiago's nightlife |
| Pueblo Nuevo | A lively neighborhood known for its vibrant street life and community feel. Attractive for travelers looking for genuine experiences away from the tourist rush. | Street food stalls, Local artisan shops, Cultural festivals |
| Reparto Sueño | A quieter and more residential area that provides a peaceful retreat while still being close to the city's main attractions. Great for families or long-term stays. | Parque de los Sueños, Nearby beaches, Local cafes |
| Las Coloradas | Known for its colorful homes and friendly atmosphere, this area attracts visitors looking for a unique and charming place to stay. | Beaches, Local art, Nature parks |
| Vista Hermosa | A lovely neighborhood offering panoramic views of Santiago de Cuba. Perfect for those looking for scenic beauty and tranquility. | Panoramic viewpoints, Local parks, Outdoor activities |
| Santuario del Cobre | A cultural and spiritual site that attracts both tourists and pilgrims, offering unique experiences and insights into Cuban traditions. | Basilica del Cobre, Natural surroundings, Local crafts |
| Altamira | An upscale residential area known for its modern amenities and proximity to the ocean, appealing to visitors seeking comfort and luxury during their stay. | Coastal promenades, Luxury dining, Recreation areas |
Understanding Airbnb License Requirements & STR Laws in Santiago de Cuba (2025)
While Santiago de Cuba, Santiago de Cuba, Cuba currently shows low STR regulations, specific Airbnb license requirements might still exist or change. Always verify the latest short term rental regulations and Airbnb license requirements directly with local government authorities for Santiago de Cuba to ensure full compliance before hosting.
(Source: AirROI data, 2025, based on 1% licensed listings)
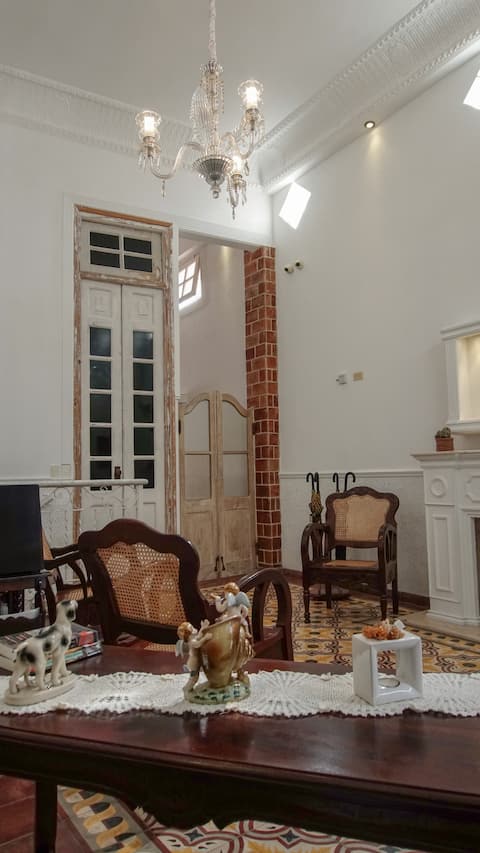
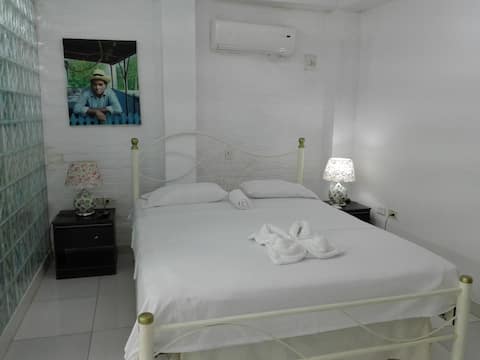
Top Performing Airbnb Properties in Santiago de Cuba (2025)
Benchmark your potential! Explore examples of top-performing Airbnb properties in Santiago de Cubabased on Trailing Twelve Month (TTM) revenue. Analyze their characteristics, revenue, occupancy rate, and ADR to understand what drives success in this market.
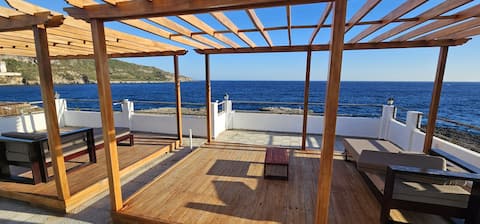
Casa Vista Mar, Siboney
Entire Place • 8 bedrooms

Boutique Hotel Arizona
Private Room • 1 bedroom
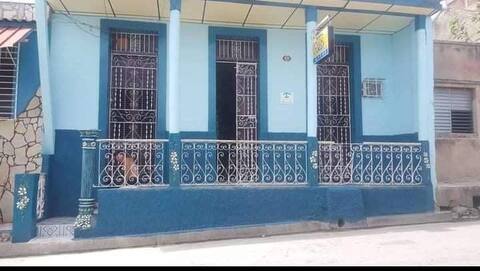
Hostal Ache de Pablo
Private Room • 4 bedrooms
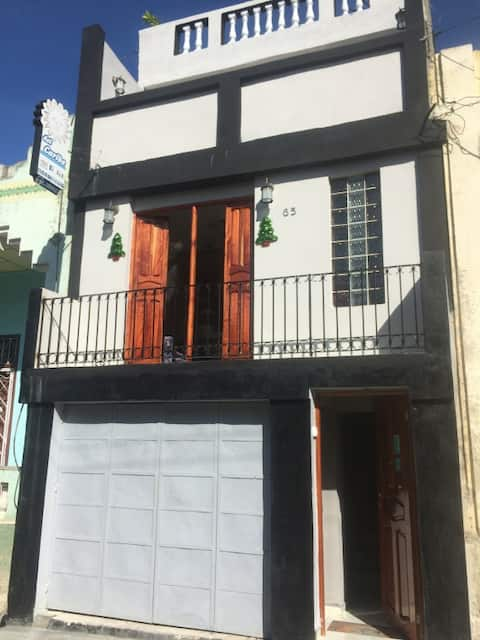
Top Views of Santiago Terrace + Wifi
Entire Place • 3 bedrooms
ACA Authentic Casa Antigua Room # 4
Private Room • N/A
Apartamento Confort. Current inverter.
Entire Place • 1 bedroom
Note: Performance varies based on location, size, amenities, seasonality, and management quality. Data reflects the past 12 months.
Top Performing Airbnb Hosts in Santiago de Cuba (2025)
Learn from the best! This table showcases top-performing Airbnb hosts in Santiago de Cuba based on the number of properties managed and estimated total revenue over the past year. Analyze their scale and performance metrics.
| Host Name | Properties | Grossing Revenue | Stay Reviews | Avg Rating |
|---|---|---|---|---|
| Eloy | 4 | $25,182 | 127 | 3.70/5.0 |
| Raul | 7 | $24,744 | 298 | 4.82/5.0 |
| Host #76631763 | 1 | $18,648 | 0 | 0.00/5.0 |
| Hostal Sol Del Caribe | 4 | $15,045 | 212 | 4.89/5.0 |
| Manuel | 6 | $9,876 | 88 | 4.89/5.0 |
| Mari | 1 | $9,782 | 18 | 4.72/5.0 |
| Host #332930640 | 1 | $9,602 | 0 | 0.00/5.0 |
| Miguel | 4 | $7,846 | 21 | 1.22/5.0 |
| Hector Rene Pavón Yero | 2 | $7,779 | 69 | 4.99/5.0 |
| Ainhoa | 3 | $7,605 | 99 | 4.49/5.0 |
Analyzing the strategies of top hosts, such as their property selection, pricing, and guest communication, can offer valuable lessons for optimizing your own Airbnb operations in Santiago de Cuba.
Dive Deeper: Advanced Santiago de Cuba STR Market Data (2025)
Ready to unlock more insights? AirROI provides access to advanced metrics and comprehensive Airbnb data for Santiago de Cuba. Explore detailed analytics beyond this report to refine your investment strategy, optimize pricing, and maximize your vacation rental profits.
Explore Advanced MetricsSantiago de Cuba Short-Term Rental Market Composition (2025): Property & Room Types
Room Type Distribution
Property Type Distribution
Market Composition Insights for Santiago de Cuba
- The Santiago de Cuba Airbnb market composition is heavily skewed towards Private Room listings, which make up 73% of the 230 active rentals. This indicates strong guest preference for privacy and space.
- Looking at the property type distribution in Santiago de Cuba, Hotel/Boutique properties are the most common (62.6%), reflecting the local real estate landscape.
- Houses represent a significant 23.9% portion, catering likely to families or larger groups.
- The presence of 62.6% Hotel/Boutique listings indicates integration with traditional hospitality.
- Smaller segments like others (combined 3.5%) offer potential for unique stay experiences.
Santiago de Cuba Airbnb Room Capacity Analysis (2025): Bedroom Distribution
Distribution of Listings by Number of Bedrooms
Room Capacity Insights for Santiago de Cuba
- The dominant room capacity in Santiago de Cuba is 1 bedroom listings, making up 38.3% of the market. This suggests a strong demand for properties suitable for couples or solo travelers.
- Together, 1 bedroom and 2 bedrooms properties represent 55.3% of the active Airbnb listings in Santiago de Cuba, indicating a high concentration in these sizes.
Santiago de Cuba Vacation Rental Guest Capacity Trends (2025)
Distribution of Listings by Guest Capacity
Guest Capacity Insights for Santiago de Cuba
- The most common guest capacity trend in Santiago de Cuba vacation rentals is listings accommodating 2 guests (24.3%). This suggests the primary traveler segment is likely couples or solo travelers.
- Properties designed for 2 guests and 3 guests dominate the Santiago de Cuba STR market, accounting for 37.3% of listings.
- On average, properties in Santiago de Cuba are equipped to host 2.2 guests.
Santiago de Cuba Airbnb Booking Patterns (2025): Available vs. Booked Days
Available Days Distribution
Booked Days Distribution
Booking Pattern Insights for Santiago de Cuba
- The most common availability pattern in Santiago de Cuba falls within the 271-366 days range, representing 76.5% of listings. This suggests many properties have significant open periods on their calendars.
- Approximately 96.9% of listings show high availability (181+ days open annually), indicating potential for increased bookings or specific owner usage patterns.
- For booked days, the 31-90 days range is most frequent in Santiago de Cuba (40.4%), reflecting common guest stay durations or potential owner blocking patterns.
- A notable 3.0% of properties secure long booking periods (181+ days booked per year), highlighting successful long-term rental strategies or significant owner usage.
Santiago de Cuba Airbnb Minimum Stay Requirements Analysis
Distribution of Listings by Minimum Night Requirement
1 Night
198 listings
87.2% of total
2 Nights
22 listings
9.7% of total
3 Nights
2 listings
0.9% of total
7-29 Nights
1 listings
0.4% of total
30+ Nights
4 listings
1.8% of total
Key Insights
- The most prevalent minimum stay requirement in Santiago de Cuba is 1 Night, adopted by 87.2% of listings. This highlights the market's preference for shorter, flexible bookings.
- A strong majority (96.9%) of the Santiago de Cuba Airbnb data shows acceptance of very short stays (1-2 nights), indicating a dynamic, high-turnover market.
- Dedicated monthly rentals (30+ nights) represent a small niche (1.8%), possibly an untapped area for hosts.
Recommendations
- Align with the market by considering a 1 Night minimum stay, as 87.2% of Santiago de Cuba hosts use this setting.
- Adjust minimum nights based on seasonality – potentially shorter during low season and longer during peak demand periods in Santiago de Cuba.
Santiago de Cuba Airbnb Cancellation Policy Trends Analysis (2025)
Flexible
109 listings
64.5% of total
Moderate
41 listings
24.3% of total
Firm
6 listings
3.6% of total
Strict
13 listings
7.7% of total
Cancellation Policy Insights for Santiago de Cuba
- The prevailing Airbnb cancellation policy trend in Santiago de Cuba is Flexible, used by 64.5% of listings.
- The market strongly favors guest-friendly terms, with 88.8% of listings offering Flexible or Moderate policies. This suggests guests in Santiago de Cuba may expect booking flexibility.
- Strict cancellation policies are quite rare (7.7%), potentially making listings with this policy less competitive unless justified by high demand or property type.
Recommendations for Hosts
- Consider adopting a Flexible policy to align with the 64.5% market standard in Santiago de Cuba.
- Given the high prevalence of Flexible policies (64.5%), offering this can enhance booking appeal, especially during shoulder seasons.
- Using a Strict policy might deter some guests, as only 7.7% of listings use it. Evaluate if potential revenue protection outweighs possible lower booking rates.
- Regularly review your cancellation policy against competitors and market demand shifts in Santiago de Cuba.
Santiago de Cuba STR Booking Lead Time Analysis (2025)
Average Booking Lead Time by Month
Booking Lead Time Insights for Santiago de Cuba
- The overall average booking lead time for vacation rentals in Santiago de Cuba is 39 days.
- Guests book furthest in advance for stays during November (average 56 days), likely coinciding with peak travel demand or local events.
- The shortest booking windows occur for stays in June (average 31 days), indicating more last-minute travel plans during this time.
- Seasonally, Fall (46 days avg.) sees the longest lead times, while Winter (35 days avg.) has the shortest, reflecting typical travel planning cycles.
Recommendations for Hosts
- Use the overall average lead time (39 days) as a baseline for your pricing and availability strategy in Santiago de Cuba.
- For November stays, consider implementing length-of-stay discounts or slightly higher rates for bookings made less than 56 days out to capitalize on advance planning.
- Target marketing efforts for the Fall season well in advance (at least 46 days) to capture early planners.
- Monitor your own booking lead times against these Santiago de Cuba averages to identify opportunities for dynamic pricing adjustments.
Popular & Essential Airbnb Amenities in Santiago de Cuba (2025)
Amenity Prevalence
Amenity Insights for Santiago de Cuba
- Essential amenities in Santiago de Cuba that guests expect include: Air conditioning, Essentials. Lacking these (any) could significantly impact bookings.
- Popular amenities like Hot water, Washer, TV are common but not universal. Offering these can provide a competitive edge.
- Warning: Wifi is not universally provided but is considered essential globally. Ensure reliable Wifi is offered.
Recommendations for Hosts
- Ensure your listing includes all essential amenities for Santiago de Cuba: Air conditioning, Essentials.
- Prioritize adding missing essentials: Air conditioning, Essentials.
- Consider adding popular differentiators like Hot water or Washer to increase appeal.
- Highlight unique or less common amenities you offer (e.g., hot tub, dedicated workspace, EV charger) in your listing description and photos.
- Regularly check competitor amenities in Santiago de Cuba to stay competitive.
Santiago de Cuba Airbnb Guest Demographics & Profile Analysis (2025)
Guest Profile Summary for Santiago de Cuba
- The typical guest profile for Airbnb in Santiago de Cuba consists of predominantly international visitors (100%), with top international origins including Germany, typically belonging to the Post-2000s (Gen Z/Alpha) group (50%), primarily speaking English or Spanish.
- Domestic travelers account for 0.0% of guests.
- Key international markets include United States (19.2%) and Germany (13.6%).
- Top languages spoken are English (34.6%) followed by Spanish (24.6%).
- A significant demographic segment is the Post-2000s (Gen Z/Alpha) group, representing 50% of guests.
Recommendations for Hosts
- Focus marketing internationally, particularly towards travelers from Germany.
- Tailor amenities and listing descriptions to appeal to the dominant Post-2000s (Gen Z/Alpha) demographic (e.g., highlight fast WiFi, smart home features, local guides).
- Highlight unique local experiences or amenities relevant to the primary guest profile.
- Consider seasonal promotions aligned with peak travel times for key origin markets.
Nearby Short-Term Rental Market Comparison
How does the Santiago de Cuba Airbnb market stack up against its neighbors? Compare key performance metrics like average monthly revenue, ADR, and occupancy rates in surrounding areas to understand the broader regional STR landscape.
| Market | Active Properties | Monthly Revenue | Daily Rate | Avg. Occupancy |
|---|---|---|---|---|
| Drapers | 35 | $2,230 | $400.95 | 31% |
| Boscobel | 57 | $1,885 | $333.21 | 29% |
| Oracabessa | 39 | $1,271 | $199.79 | 27% |
| Portland Parish | 10 | $1,184 | $125.52 | 31% |
| Kingston | 1,700 | $1,182 | $118.11 | 37% |
| Port Antonio | 122 | $1,156 | $168.00 | 26% |
| Port Maria | 15 | $1,115 | $179.41 | 30% |
| Long Bay | 27 | $1,105 | $220.30 | 21% |
| Priestmans River | 20 | $965 | $202.15 | 28% |
| Bog Walk | 10 | $927 | $110.99 | 26% |