Bisento Airbnb Market Analysis 2026: Short Term Rental Data & Vacation Rental Statistics in Curaçao, Curaçao
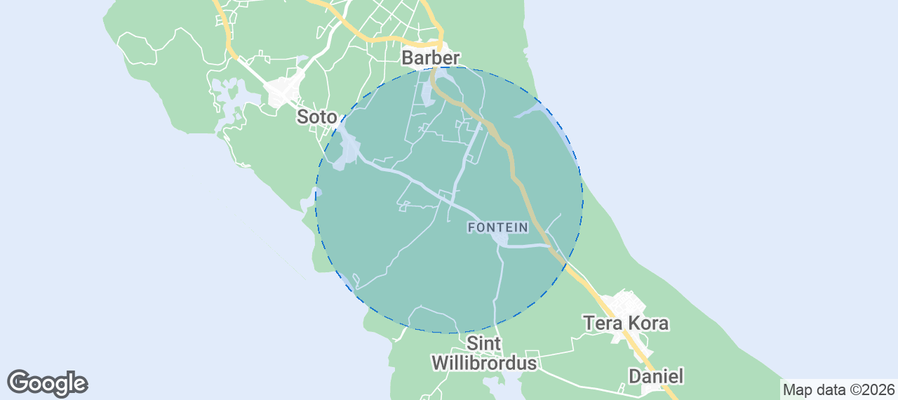
Is Airbnb profitable in Bisento in 2026? Explore comprehensive Airbnb analytics for Bisento, Curaçao, Curaçao to uncover income potential. This 2026 STR market report for Bisento, based on AirROI data from February 2025 to January 2026, reveals key trends in the niche market of 20 active listings.
Whether you're considering an Airbnb investment in Bisento, optimizing your existing vacation rental, or exploring rental arbitrage opportunities, understanding the Bisento Airbnb data is crucial. Leveraging the low regulation environment is key to maximizing your short term rental income potential. Let's dive into the specifics.
Key Bisento Airbnb Performance Metrics Overview
Monthly Airbnb Revenue Variations & Income Potential in Bisento (2026)
Understanding the monthly revenue variations for Airbnb listings in Bisento is key to maximizing your short term rental income potential. Seasonality significantly impacts earnings. Our analysis, based on data from the past 12 months, shows that the peak revenue month for STRs in Bisento is typically December, while May often presents the lowest earnings, highlighting opportunities for strategic pricing adjustments during shoulder and low seasons. Explore the typical Airbnb income in Bisento across different performance tiers:
- Best-in-class properties (Top 10%) achieve $5,150+ monthly, often utilizing dynamic pricing and superior guest experiences.
- Strong performing properties (Top 25%) earn $3,369 or more, indicating effective management and desirable locations/amenities.
- Typical properties (Median) generate around $1,792 per month, representing the average market performance.
- Entry-level properties (Bottom 25%) see earnings around $934, often with potential for optimization.
Average Monthly Airbnb Earnings Trend in Bisento
Bisento Airbnb Occupancy Rate Trends (2026)
Maximize your bookings by understanding the Bisento STR occupancy trends. Seasonal demand shifts significantly influence how often properties are booked. Typically, Februarysees the highest demand (peak season occupancy), while May experiences the lowest (low season). Effective strategies, like adjusting minimum stays or offering promotions, can boost occupancy during slower periods. Here's how different property tiers perform in Bisento:
- Best-in-class properties (Top 10%) achieve 91%+ occupancy, indicating high desirability and potentially optimized availability.
- Strong performing properties (Top 25%) maintain 81% or higher occupancy, suggesting good market fit and guest satisfaction.
- Typical properties (Median) have an occupancy rate around 60%.
- Entry-level properties (Bottom 25%) average 34% occupancy, potentially facing higher vacancy.
Average Monthly Occupancy Rate Trend in Bisento
Average Daily Rate (ADR) Airbnb Trends in Bisento (2026)
Effective short term rental pricing strategy in Bisento involves understanding monthly ADR fluctuations. The Average Daily Rate (ADR) for Airbnb in Bisento typically peaks in January and dips lowest during April. Leveraging Airbnb dynamic pricing tools or strategies based on this seasonality can significantly boost revenue. Here's a look at the typical nightly rates achieved:
- Best-in-class properties (Top 10%) command rates of $196+ per night, often due to premium features or locations.
- Strong performing properties (Top 25%) achieve nightly rates of $153 or more.
- Typical properties (Median) charge around $112 per night.
- Entry-level properties (Bottom 25%) earn around $59 per night.
Average Daily Rate (ADR) Trend by Month in Bisento
Get Live Bisento Market Intelligence 👇
Explore Real-time Analytics
Airbnb Seasonality Analysis & Trends in Bisento (2026)
Peak Season (December, February, April)
- Revenue averages $2,916 per month
- Occupancy rates average 70.2%
- Daily rates average $128
Shoulder Season
- Revenue averages $2,605 per month
- Occupancy maintains around 57.4%
- Daily rates hold near $127
Low Season (January, May, July)
- Revenue drops to average $2,229 per month
- Occupancy decreases to average 49.9%
- Daily rates adjust to average $129
Seasonality Insights for Bisento
- The Airbnb seasonality in Bisento shows moderate seasonality with distinct peak and low periods. While the sections above show seasonal averages, it's also insightful to look at the extremes:
- During the high season, the absolute peak month showcases Bisento's highest earning potential, with monthly revenues capable of climbing to $3,143, occupancy reaching a high of 80.6%, and ADRs peaking at $140.
- Conversely, the slowest single month of the year, typically falling within the low season, marks the market's lowest point. In this month, revenue might dip to $1,968, occupancy could drop to 43.8%, and ADRs may adjust down to $122.
- Understanding both the seasonal averages and these monthly peaks and troughs in revenue, occupancy, and ADR is crucial for maximizing your Airbnb profit potential in Bisento.
Seasonal Strategies for Maximizing Profit
- Peak Season: Maximize revenue through premium pricing and potentially longer minimum stays. Ensure high availability.
- Low Season: Offer competitive pricing, special promotions (e.g., extended stay discounts), and flexible cancellation policies. Target off-season travelers like remote workers or budget-conscious guests.
- Shoulder Seasons: Implement dynamic pricing that balances peak and low rates. Target weekend travelers or specific events. Offer slightly more flexible terms than peak season.
- Regularly analyze your own performance against these Bisento seasonality benchmarks and adjust your pricing and availability strategy accordingly.
Best Areas for Airbnb Investment in Bisento (2026)
Exploring the top neighborhoods for short-term rentals in Bisento? This section highlights key areas, outlining why they are attractive for hosts and guests, along with notable local attractions. Consider these locations based on your target guest profile and investment strategy.
| Neighborhood / Area | Why Host Here? (Target Guests & Appeal) | Key Attractions & Landmarks |
|---|---|---|
| Willemstad | The capital city with a UNESCO World Heritage Site designation, famous for its colorful Dutch colonial architecture and vibrant culture. It's a hub for tourists seeking historical sites, shopping, and dining. | Punda, Otrobanda, Floating Market, Queen Emma Bridge, Kura Hulanda Museum |
| Mambo Beach | A lively beach destination known for its beautiful coastline, nightlife, and various water sports activities. It's popular among beachgoers and families looking for a fun vacation. | Beach clubs, Seaquarium Beach, Mambo Beach Boulevard, Snorkeling tours, Water sports activities |
| Jan Thiel | A scenic area known for its luxurious homes, beaches, and quiet atmosphere. It appeals to travelers looking for a more relaxed vacation experience surrounded by nature. | Jan Thiel Beach, Zanzibar Beach Club, Quiqui River Nature Reserve, Kayaking trips, Snorkeling and diving sites |
| Cas Abao Beach | Renowned for its stunning beaches and clear waters, it's a favorite for snorkeling and sunbathing. This area attracts those looking for a peaceful beach day away from the crowds. | Cas Abao Beach, Snorkeling spots, Beach restaurants, Diving excursions, Sunbathing areas |
| Westpunt | A tranquil area known for its natural beauty and proximity to some of the best snorkeling spots. Ideal for nature lovers and those seeking adventure in a calm setting. | Playa Lagun, Playa Kalki, Christoffel National Park, Diving schools, Scenic viewpoints |
| Pietermaai | A trendy neighborhood with a mix of historic buildings and modern bars and restaurants. It's becoming increasingly popular for nightlife and cultural experiences. | Klein Curacao trips, Pietermaai Beach, Café Barista, Local shops, Art galleries |
| Royal Palm Resort | A luxury resort area offering premium services and amenities. It's attractive to travelers looking for an upscale experience in a beautiful location. | Royal Palm Beach, Spa facilities, Fine dining, Water sports rentals, Poolside relaxation |
| Banda Abou | Known for its beautiful landscapes and less commercialized beaches. This area appeals to those seeking a more authentic Curacao experience away from the tourist hotspots. | Shete Boka National Park, Playa Forti, Natural Sea Aquarium, Hiking trails, Local restaurants |
Understanding Airbnb License Requirements & STR Laws in Bisento (2026)
While Bisento, Curaçao, Curaçao currently shows low STR regulations, specific Airbnb license requirements might still exist or change. Always verify the latest short term rental regulations and Airbnb license requirements directly with local government authorities for Bisento to ensure full compliance before hosting.
(Source: AirROI data, 2026, finding no licensed listings among those analyzed)
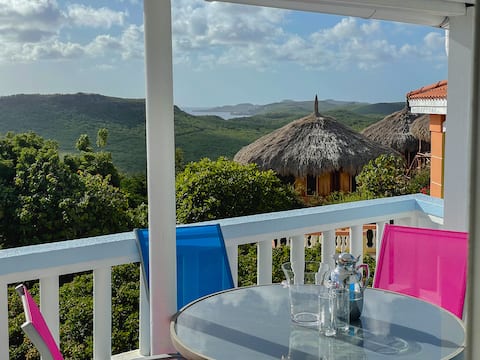
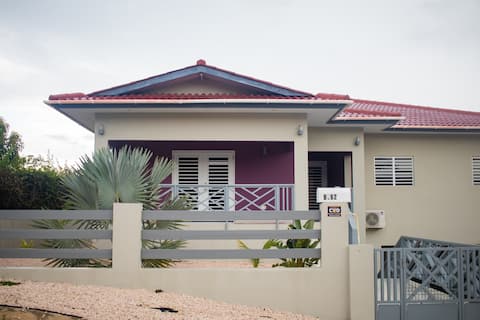
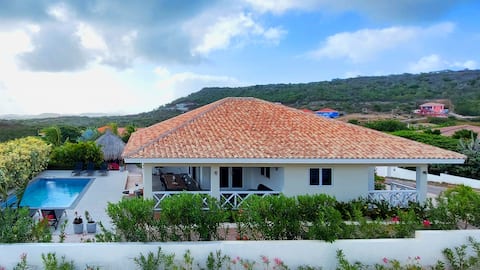
Top Performing Airbnb Properties in Bisento (2026)
Benchmark your potential! Explore examples of top-performing Airbnb properties in Bisentobased on Trailing Twelve Month (TTM) revenue. Analyze their characteristics, revenue, occupancy rate, and ADR to understand what drives success in this market.
Hilltop Ocean Vista - Cas Abou Villa w/ Pool
Entire Place • 3 bedrooms

Villa Neshi - Cas Abou Resort
Entire Place • 5 bedrooms
Legacy Villa 2 at Fontein with Private Pool
Entire Place • 4 bedrooms

Villa Monte Azul
Entire Place • 3 bedrooms
Villa Blenchi, private swimming pool, with lots of privacy
Entire Place • 3 bedrooms
Palu Sinta with Private pool and privacy
Entire Place • 2 bedrooms
Note: Performance varies based on location, size, amenities, seasonality, and management quality. Data reflects the past 12 months.
Top Performing Airbnb Hosts in Bisento (2026)
Learn from the best! This table showcases top-performing Airbnb hosts in Bisento based on the number of properties managed and estimated total revenue over the past year. Analyze their scale and performance metrics.
| Host Name | Properties | Grossing Revenue | Stay Reviews | Avg Rating |
|---|---|---|---|---|
| Alex | 1 | $69,687 | 36 | 4.97/5.0 |
| Villas And More | 1 | $66,318 | 17 | 4.88/5.0 |
| Jack | 2 | $60,834 | 38 | 4.69/5.0 |
| Julisha | 1 | $55,016 | 41 | 4.88/5.0 |
| Team PMI Curaçao | 1 | $44,949 | 14 | 5.00/5.0 |
| Math | 1 | $24,296 | 23 | 4.83/5.0 |
| Amber | 1 | $22,915 | 41 | 4.95/5.0 |
| Diana | 1 | $18,204 | 3 | 5.00/5.0 |
| Maroons Rentals | 2 | $14,094 | 9 | 5.00/5.0 |
| Shamira | 3 | $13,339 | 15 | 4.79/5.0 |
Analyzing the strategies of top hosts, such as their property selection, pricing, and guest communication, can offer valuable lessons for optimizing your own Airbnb operations in Bisento.
Dive Deeper: Advanced Bisento STR Market Data (2026)
Ready to unlock more insights? AirROI provides access to advanced metrics and comprehensive Airbnb data for Bisento. Explore detailed analytics beyond this report to refine your investment strategy, optimize pricing, and maximize your vacation rental profits.
Explore Advanced MetricsBisento Short-Term Rental Market Composition (2026): Property & Room Types
Room Type Distribution
Property Type Distribution
Market Composition Insights for Bisento
- The Bisento Airbnb market composition is heavily skewed towards Entire Home/Apt listings, which make up 100% of the 20 active rentals. This indicates strong guest preference for privacy and space.
- Looking at the property type distribution in Bisento, House properties are the most common (75%), reflecting the local real estate landscape.
- Houses represent a significant 75% portion, catering likely to families or larger groups.
Bisento Airbnb Room Capacity Analysis (2026): Bedroom Distribution
Distribution of Listings by Number of Bedrooms
Room Capacity Insights for Bisento
- The dominant room capacity in Bisento is 1 bedroom listings, making up 40% of the market. This suggests a strong demand for properties suitable for couples or solo travelers.
- Together, 1 bedroom and 3 bedrooms properties represent 65.0% of the active Airbnb listings in Bisento, indicating a high concentration in these sizes.
- A significant 35.0% of listings offer 3+ bedrooms, catering to larger groups and families seeking more space in Bisento.
Bisento Vacation Rental Guest Capacity Trends (2026)
Distribution of Listings by Guest Capacity
Guest Capacity Insights for Bisento
- The most common guest capacity trend in Bisento vacation rentals is listings accommodating 2 guests (30%). This suggests the primary traveler segment is likely couples or solo travelers.
- Properties designed for 2 guests and 4 guests dominate the Bisento STR market, accounting for 60.0% of listings.
- 35.0% of properties accommodate 6+ guests, serving the market segment for larger families or group travel in Bisento.
- On average, properties in Bisento are equipped to host 4.3 guests.
Bisento Airbnb Booking Patterns (2026): Available vs. Booked Days
Available Days Distribution
Booked Days Distribution
Booking Pattern Insights for Bisento
- The most common availability pattern in Bisento falls within the 271-366 days range, representing 40% of listings. This suggests many properties have significant open periods on their calendars.
- Approximately 60.0% of listings show high availability (181+ days open annually), indicating potential for increased bookings or specific owner usage patterns.
- For booked days, the 181-270 days range is most frequent in Bisento (30%), reflecting common guest stay durations or potential owner blocking patterns.
- A notable 40.0% of properties secure long booking periods (181+ days booked per year), highlighting successful long-term rental strategies or significant owner usage.
Bisento Airbnb Minimum Stay Requirements Analysis
Distribution of Listings by Minimum Night Requirement
4-6 Nights
10 listings
50% of total
7-29 Nights
2 listings
10% of total
30+ Nights
8 listings
40% of total
Key Insights
- The most prevalent minimum stay requirement in Bisento is 4-6 Nights, adopted by 50% of listings. This highlights the market's preference for longer commitments.
- A significant segment (40%) caters to monthly stays (30+ nights) in Bisento, pointing to opportunities in the extended-stay market.
Recommendations
- Align with the market by considering a 4-6 Nights minimum stay, as 50% of Bisento hosts use this setting.
- Explore offering discounts for stays of 30+ nights to attract the 40% of the market seeking extended stays.
- Adjust minimum nights based on seasonality – potentially shorter during low season and longer during peak demand periods in Bisento.
Bisento Airbnb Cancellation Policy Trends Analysis (2026)
Flexible
4 listings
20% of total
Moderate
4 listings
20% of total
Firm
8 listings
40% of total
Strict
4 listings
20% of total
Cancellation Policy Insights for Bisento
- The prevailing Airbnb cancellation policy trend in Bisento is Firm, used by 40% of listings.
- A majority (60.0%) of hosts in Bisento utilize Firm or Strict policies, indicating a market where hosts prioritize booking security.
Recommendations for Hosts
- Consider adopting a Firm policy to align with the 40% market standard in Bisento.
- Regularly review your cancellation policy against competitors and market demand shifts in Bisento.
Bisento STR Booking Lead Time Analysis (2026)
Average Booking Lead Time by Month
Booking Lead Time Insights for Bisento
- The overall average booking lead time for vacation rentals in Bisento is 104 days.
- Guests book furthest in advance for stays during June (average 142 days), likely coinciding with peak travel demand or local events.
- The shortest booking windows occur for stays in May (average 80 days), indicating more last-minute travel plans during this time.
- Seasonally, Winter (117 days avg.) sees the longest lead times, while Fall (111 days avg.) has the shortest, reflecting typical travel planning cycles.
Recommendations for Hosts
- Use the overall average lead time (104 days) as a baseline for your pricing and availability strategy in Bisento.
- For June stays, consider implementing length-of-stay discounts or slightly higher rates for bookings made less than 142 days out to capitalize on advance planning.
- Target marketing efforts for the Winter season well in advance (at least 117 days) to capture early planners.
- Monitor your own booking lead times against these Bisento averages to identify opportunities for dynamic pricing adjustments.
Popular & Essential Airbnb Amenities in Bisento (2026)
Amenity Prevalence
Amenity Insights for Bisento
- Essential amenities in Bisento that guests expect include: Private entrance, Bed linens, Wifi, Coffee maker, Air conditioning, Dishes and silverware, Kitchen, Free parking on premises, Hot water kettle, Hot water. Lacking these (any) could significantly impact bookings.
Recommendations for Hosts
- Ensure your listing includes all essential amenities for Bisento: Private entrance, Bed linens, Wifi, Coffee maker, Air conditioning, Dishes and silverware, Kitchen, Free parking on premises, Hot water kettle, Hot water.
- Prioritize adding missing essentials: Hot water kettle, Hot water.
- Highlight unique or less common amenities you offer (e.g., hot tub, dedicated workspace, EV charger) in your listing description and photos.
- Regularly check competitor amenities in Bisento to stay competitive.
Bisento Airbnb Guest Demographics & Profile Analysis (2026)
Guest Profile Summary for Bisento
- The typical guest profile for Airbnb in Bisento consists of predominantly international visitors (99%), with top international origins including Canada, typically belonging to the Post-2000s (Gen Z/Alpha) group (50%), primarily speaking English or French.
- Domestic travelers account for 1.2% of guests.
- Key international markets include United States (30.6%) and Canada (16.5%).
- Top languages spoken are English (42.9%) followed by French (16.3%).
- A significant demographic segment is the Post-2000s (Gen Z/Alpha) group, representing 50% of guests.
Recommendations for Hosts
- Focus marketing internationally, particularly towards travelers from Canada.
- Tailor amenities and listing descriptions to appeal to the dominant Post-2000s (Gen Z/Alpha) demographic (e.g., highlight fast WiFi, smart home features, local guides).
- Highlight unique local experiences or amenities relevant to the primary guest profile.
- Consider seasonal promotions aligned with peak travel times for key origin markets.
Nearby Short-Term Rental Market Comparison
How does the Bisento Airbnb market stack up against its neighbors? Compare key performance metrics like average monthly revenue, ADR, and occupancy rates in surrounding areas to understand the broader regional STR landscape.
| Market | Active Properties | Monthly Revenue | Daily Rate | Avg. Occupancy |
|---|---|---|---|---|
| Malmok Beach | 81 | $11,669 | $702.93 | 56% |
| Punta Brabo | 284 | $6,312 | $434.21 | 57% |
| Savaneta | 61 | $5,596 | $333.99 | 60% |
| Tierra Del Sol | 169 | $4,888 | $355.61 | 54% |
| West Punt | 557 | $4,519 | $327.74 | 51% |
| San Nicolaas | 55 | $4,489 | $273.05 | 50% |
| Bubali | 715 | $4,420 | $309.30 | 56% |
| Sint Willibrordus | 64 | $4,293 | $411.99 | 46% |
| Noord | 567 | $3,681 | $300.19 | 54% |
| Catiri | 45 | $3,640 | $244.89 | 57% |